Python:Matplotlib 画曲线和柱状图(Code)
原文链接:http://blog.csdn.net/ikerpeng/article/details/20523679
参考资料:http://matplotlib.org/gallery.html matplotlib画廊
有少量修改,如有疑问,请访问原作者!
首先补充一下:两种体系7种颜色 r g b y m c k (红,绿,蓝,黄,品红,青,黑)
在科研的过程中,坐标系中的XY不一定就是等尺度的。例如在声波中对Y轴取对数。肆意我们也必须知道这种坐标系如何画出来的。
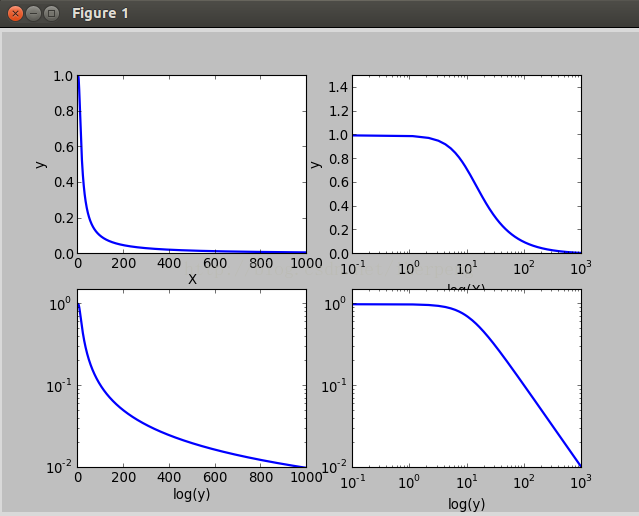
1:对数坐标图
有3个函数可以实现这种功能,分别是:semilogx(),semilogy(),loglog()。它们分别表示对X轴,Y轴,XY轴取对数。下面在一个2*2的figure里面来比较这四个子图(还有plot())。
def drawsemilogx():

    w=np.linspace(0.1,1000,1000)

    p=np.abs(1/(1+0.1j*w))

    plt.subplot(221)

    plt.plot(w,p,lw=2)

    plt.xlabel('X')

    plt.ylabel('y');

    plt.subplot(222)

    plt.semilogx(w,p,lw=2)

    plt.ylim(0,1.5)

    plt.xlabel('log(X)')

    plt.ylabel('y')

    plt.subplot(223)

    plt.semilogy(w,p,lw=2)

    plt.ylim(0,1.5)

    plt.xlabel('x')

    plt.xlabel('log(y)')

    plt.subplot(224)

    plt.loglog(w,p,lw=2)

    plt.ylim(0,1.5)

    plt.xlabel('log(x)')

    plt.xlabel('log(y)')

    plt.show()
如上面的代码所示,对一个低通滤波器函数绘图。得到四个不同坐标尺度的图像。如下图所示:
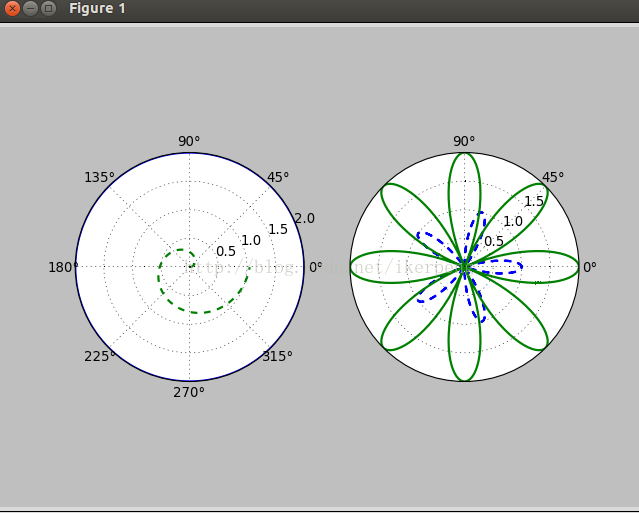
2,极坐标图像
极坐标系中的点由一个夹角和一段相对于中心位置的距离来表示。其实在plot()函数里面本来就有一个polar的属性,让他为True就行了。下面绘制一个极坐标图像:
def drawEightFlower():

    theta=np.arange(0,2*np.pi,0.02)

    plt.subplot(121,polar=True)

    plt.plot(theta,2*np.ones_like(theta),lw=2)

    plt.plot(theta,theta/6,'--',lw=2)

    plt.subplot(122,polar=True)

    plt.plot(theta,np.cos(5*theta),'--',lw=2)

    plt.plot(theta,2*np.cos(4*theta),lw=2)

    plt.rgrids(np.arange(0.5,2,0.5),angle=45)

    plt.thetagrids([0,45,90]);

    plt.show();
整个代码很好理解,在后面的13,14行没见过。第一个plt.rgrids(np.arange(0.5,2,0.5),angle=45) 表示绘制半径为0.5 1.0 1.5的三个同心圆,同时将这些半径的值标记在45度位置的那个直径上面。plt.thetagrids([0,45,90]) 表示的是在theta为0,45,90度的位置上标记上度数。得到的图像是:
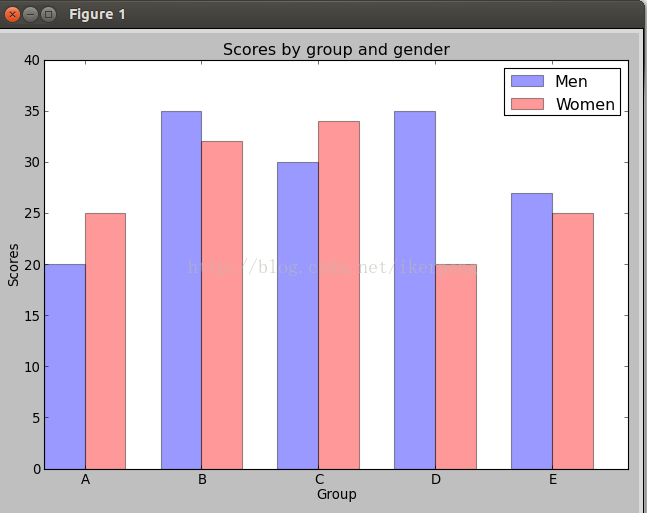
3,柱状图:
核心代码matplotlib.pyplot.bar(left, height, width=0.8, bottom=None, hold=None, **kwargs)里面重要的参数是左边起点,高度,宽度。下面例子:
def drawPillar():

    n_groups = 5;

    means_men = (20, 35, 30, 35, 27)

    means_women = (25, 32, 34, 20, 25)

    fig, ax = plt.subplots()

    index = np.arange(n_groups)

    bar_width = 0.35

    opacity = 0.4

    rects1 = plt.bar(index, means_men, bar_width,alpha=opacity, color='b',label=    'Men')

    rects2 = plt.bar(index + bar_width, means_women, bar_width,alpha=opacity,color='r',label='Women')

    plt.xlabel('Group')

    plt.ylabel('Scores')

    plt.title('Scores by group and gender')

    plt.xticks(index + bar_width, ('A', 'B', 'C', 'D', 'E'))

    plt.ylim(0,40);

    plt.legend();

    plt.tight_layout();

    plt.show();
得到的图像是:
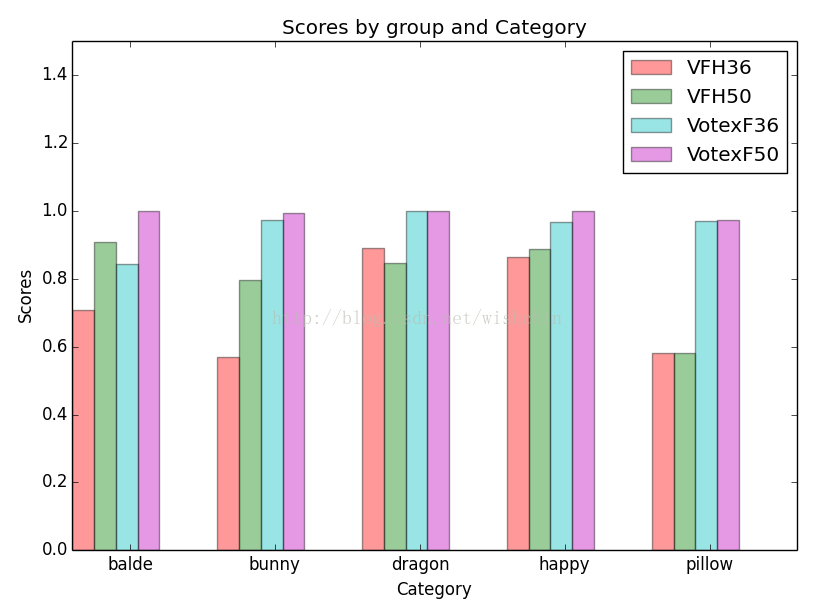
再贴一图:
这是我关于pose识别率的实验结果,感觉结果真是令人不可思议!(非博主原文!)
def drawBarChartPoseRatio():

    n_groups = 5

    means_VotexF36 = (0.84472049689441, 0.972477064220183, 1.0, 0.9655172413793104, 0.970970970970971)

    means_VotexF50 = (1.0,              0.992992992992993, 1.0, 0.9992348890589136, 0.9717125382262997)

    means_VFH36    = (0.70853858784893, 0.569731081926204, 0.8902900378310215, 0.8638638638638638, 0.5803008248423096)

    means_VFH50    = (0.90786948176583, 0.796122576610381, 0.8475120385232745, 0.8873762376237624, 0.5803008248423096)

    fig, ax = plt.subplots()

    index = np.arange(n_groups)

    bar_width = 0.3

    opacity   = 0.4

    rects1 = plt.bar(index,             means_VFH36,    bar_width/2, alpha=opacity, color='r', label='VFH36'   )

    rects2 = plt.bar(index+ bar_width/2,  means_VFH50,  bar_width/2, alpha=opacity, color='g', label='VFH50'   )

    rects3 = plt.bar(index+bar_width, means_VotexF36,     bar_width/2, alpha=opacity, color='c', label='VotexF36')

    rects4 = plt.bar(index+1.5*bar_width, means_VotexF50, bar_width/2, alpha=opacity, color='m', label='VotexF50')

    plt.xlabel('Category')

    plt.ylabel('Scores')

    plt.title('Scores by group and Category')

    #plt.xticks(index - 0.2+ 2*bar_width, ('balde', 'bunny', 'dragon', 'happy', 'pillow'))

    plt.xticks(index - 0.2+ 2*bar_width, ('balde', 'bunny', 'dragon', 'happy', 'pillow'),fontsize =18)

    plt.yticks(fontsize =18)  #change the num axis size

    plt.ylim(0,1.5)  #The ceil

    plt.legend()

    plt.tight_layout()

    plt.show()
柱状图显示:
4:散列图,由离散的点构成的。
函数是:
matplotlib.pyplot.scatter(x, y, s=20, c='b', marker='o', cmap=None, norm=None, vmin=None, vmax=None, alpha=None, linewidths=None, verts=None, hold=None,**kwargs),其中,xy是点的坐标,s点的大小,maker是形状可以maker=(5,1)5表示形状是5边型,1表示是星型(0表示多边形,2放射型,3圆形);alpha表示透明度;facecolor=‘none’表示不填充。例子如下:
def drawStar():

    plt.figure(figsize=(8,4))

    x=np.random.random(100)

    y=np.random.random(100)

    plt.scatter(x,y,s=x*1000,c='y',marker=(5,1),alpha=0.5,lw=2,facecolors='none')

    plt.xlim(0,1)

    plt.ylim(0,1)

    plt.show()
上面代码的facecolors参数使得前面的c=‘y’不起作用了。图像:

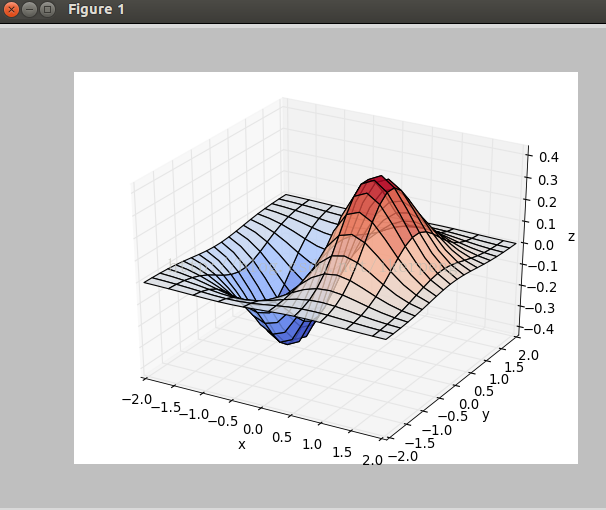
5,3D图像,主要是调用3D图像库。看下面的例子:
def draw3Dgrid():

    x,y=np.mgrid[-2:2:20j,-2:2:20j]

    z=x*np.exp(-x**2-y**2)

    ax=plt.subplot(111,projection='3d')

    ax.plot_surface(x,y,z,rstride=2,cstride=1,cmap=plt.cm.coolwarm,alpha=0.8)

    ax.set_xlabel('x')

    ax.set_ylabel('y')

    ax.set_zlabel('z')

    plt.show()
得到的图像如下图所示:
到此,matplotlib基本操作的学习结束了,相信大家也可以基本完成自己的科研任务了。下面将继续学习python的相关课程,请继续关注。
参考书目:
《python科学计算》
《matplotlib手册》
Python:Matplotlib 画曲线和柱状图(Code)的更多相关文章
- python matplotlib 画图表(点状图)
首先,选择自己希望画的图:在官方网站就可以直接点击图,然后就会出现源代码: http://matplotlib.org/gallery.html
- matplotlib画散点图和柱状图,等高线图,image图
一:散点图: scatter函数原型 其中散点的形状参数marker如下: 其中颜色参数c如下: n = 1024 # 均值是0, 方差是1, 取1024个数 x = np.rando ...
- ProE常用曲线方程:Python Matplotlib 版本代码(蝴蝶曲线)
花纹的生成可以使用贴图的方式,同样也可以使用方程,本文列出了几种常用曲线的方程式,以取代贴图方式完成特定花纹的生成. 注意极坐标的使用................. 前面部分基础资料,参考:Pyt ...
- python中matplotlib画折线图实例(坐标轴数字、字符串混搭及标题中文显示)
最近在用python中的matplotlib画折线图,遇到了坐标轴 "数字+刻度" 混合显示.标题中文显示.批量处理等诸多问题.通过学习解决了,来记录下.如有错误或不足之处,望请指 ...
- 使用Python matplotlib做动态曲线
今天看到“Python实时监控CPU使用率”的教程: https://www.w3cschool.cn/python3/python3-ja3d2z2g.html 自己也学习如何使用Python ma ...
- Python - matplotlib 数据可视化
在许多实际问题中,经常要对给出的数据进行可视化,便于观察. 今天专门针对Python中的数据可视化模块--matplotlib这块内容系统的整理,方便查找使用. 本文来自于对<利用python进 ...
- matplotlib画线(2)
这篇随笔是matplotlib画线的补充>>> #nocl参数控制图例中有几列,>>> import numpy as np>>> import ...
- python matplotlib plot 数据中的中文无法正常显示的解决办法
转发自:http://blog.csdn.net/laoyaotask/article/details/22117745?utm_source=tuicool python matplotlib pl ...
- 1.1.3-学习Opencv与MFC混合编程之---画图工具 通过对话框进行工具的参数设置 画曲线 绘图校正
源代码:http://download.csdn.net/detail/nuptboyzhb/3961688 l 对话框 1.“插入”->“资源”->“对话框” 2.对话框属性如下: 双击 ...
随机推荐
- 通过JDBC取Oracle数据库的时间字段时,时间丢失,只剩日期
通过JDBC连接Oracle数据库,在查询的时候发现时间字段取出来值后只剩下了日期,时间消失了.查资料发现跟Oracle jdbc驱动版本有关,这里先贴出解决方案: 修改数据库的连接方式: try { ...
- [USACO10DEC]宝箱Treasure Chest
区间DP,但是卡空间. n2的就是f[i,j]=sum[i,j]-min(f[i+1][j],f[i][j-1])表示这个区间和减去对手取走的最多的. 但是空间是64MB,就很难受 发现一定是由大区间 ...
- 58.fetch phbase
1.fetch phbase工作流程 The coordinating node identifies which documents need to be fetched and issues a ...
- 34.初识搜索引擎及timeout机制
主要知识点 1.对搜索执行结果的说明 2.timeout机制讲解 一.对执行 GET /_search 的结果的说明 执行结果如下(只保留部分) { "took": 29, &qu ...
- MySQL主要命令(3)
//修该数据, 不要忘了set update table_name set col_name = value where 条件 //删除数据 , 指定条件对应的数据 delete from table ...
- [bzoj1070][SCOI2007]修车_费用流
修车 bzoj-1070 SCOI-2007 题目大意:有m个人要修n台车,每个工人修不同的车的时间不同,问将所有的车都修完,最少需要花费的时间. 注释:$2\le m\le 9$,$1\le n \ ...
- Windows 10不能正常打开开始菜单问题修复
1.可以尝试通过命令重新注注册Windows Store app: powershell -ExecutionPolicy Unrestricted Add-AppxPackage -DisableD ...
- C#实体转换
using System; using System.Collections.Generic; using System.Data; using System.Data.Common; using S ...
- oc12--对象作为参数
// main.m // 对象作为方法的参数传递 #import <Foundation/Foundation.h> /* 士兵 事物名称: 士兵(Soldier) 属性:姓名(name) ...
- sublime-text 编译C
sublime的优点多多. 先下好sublime-text 如果不会下载 在ubuntu 下输入sudo apt-cache search sublime 查找到合适的安装包后apt-get inst ...