NetworkX系列教程(2)-graph生成器
本节主要讲解如何快速使用内置的方法生成graph,官方的文档在这里,里面包含了networkX的所有graph生成器,下面的内容只是我节选的内容,并将graph画出来而已.
声明,文中重复使用了以下代码块 ,现在统一注释在这里:
- plt.subplot(221) #生成2*2的组图,并且当前子图在2*2矩阵的第一个位置.第二个位置是222
- plt.title('complete_graph') #子图的标题
- nx.draw(G, with_labels=True, font_weight='bold') #将graph画出来
- plt.axis('on') #需要坐标轴,以便框住graph
- plt.xticks([]) #横坐标不需要刻度
- plt.yticks([]) #纵坐标不需要刻度
目录:
注意:如果代码出现找不库,请返回第一个教程,把库文件导入.
2.生成graph
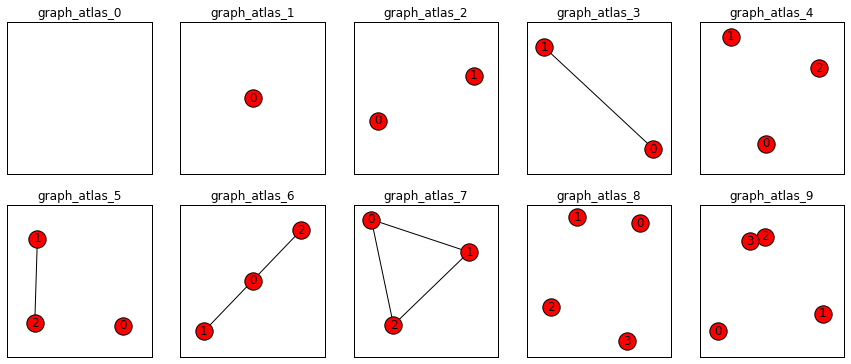
2.1小图图集的生成器
- #graph_atlas的图已经被定义,只需要按标号取出来就可以,下面将前10个取出来
- plt.subplots(2,5,figsize=(15,6))
- for ind in range(10):
- G.clear()
- G=nx.graph_atlas(ind)
- plt.subplot(2,5,ind+1)
- nx.draw(G,with_labels=True)
- #下面是设置图片
- plt.axis('on')
- plt.title('graph_atlas_%s'%ind)
- plt.xticks([])
- plt.yticks([])
- plt.show()
- plt.close()
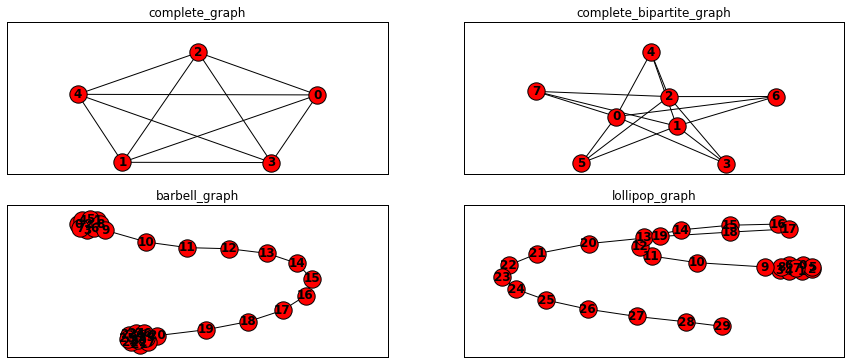
2.2调用函数生成经典的graph
- plt.subplots(2,2,figsize=(15,6))
- K_5 = nx.complete_graph(5)
- plt.subplot(221)
- plt.title('complete_graph')
- nx.draw(K_5, with_labels=True, font_weight='bold')
- plt.axis('on')
- plt.xticks([])
- plt.yticks([])
- K_3_5 = nx.complete_bipartite_graph(3, 5)
- plt.subplot(222)
- plt.title('complete_bipartite_graph')
- nx.draw(K_3_5, with_labels=True, font_weight='bold')
- plt.axis('on')
- plt.xticks([])
- plt.yticks([])
- barbell = nx.barbell_graph(10, 10)
- plt.subplot(223)
- plt.title('barbell_graph')
- nx.draw(barbell, with_labels=True, font_weight='bold')
- plt.axis('on')
- plt.xticks([])
- plt.yticks([])
- lollipop = nx.lollipop_graph(10, 20)
- plt.subplot(224)
- plt.title('lollipop_graph')
- nx.draw(lollipop, with_labels=True, font_weight='bold')
- plt.axis('on')
- plt.xticks([])
- plt.yticks([])
- plt.show()
2.3格子graph
- G.clear()
- plt.subplots(2,3,figsize=(15,6))
- #二维网格图
- G=nx.grid_2d_graph(2,3)
- plt.subplot(2,3,1)
- nx.draw(G,with_labels=True)
- plt.title('grid_2d_graph')
- plt.axis('on')
- plt.xticks([])
- plt.yticks([])
- #n维网格图
- grid_graph = nx.grid_graph(dim=[1, 3, 4])
- plt.subplot(2,3,2)
- nx.draw(grid_graph,with_labels=True)
- plt.title('grid_graph')
- plt.axis('on')
- plt.xticks([])
- plt.yticks([])
- #m×n的六角形格子图。
- G=nx.hexagonal_lattice_graph(2,3)
- plt.subplot(2,3,3)
- nx.draw(G,with_labels=True)
- plt.title('hexagonal_lattice_graph')
- plt.axis('on')
- plt.xticks([])
- plt.yticks([])
- #n维超立方体图形。
- G=nx.hypercube_graph(3)
- plt.subplot(2,3,4)
- nx.draw(G,with_labels=True)
- plt.title('hypercube_graph')
- plt.axis('on')
- plt.xticks([])
- plt.yticks([])
- #三角格子图
- G=nx.triangular_lattice_graph(1,3)
- plt.subplot(2,3,5)
- nx.draw(G,with_labels=True)
- plt.title('hypercube_graph')
- plt.axis('on')
- plt.xticks([])
- plt.yticks([])
- plt.show()

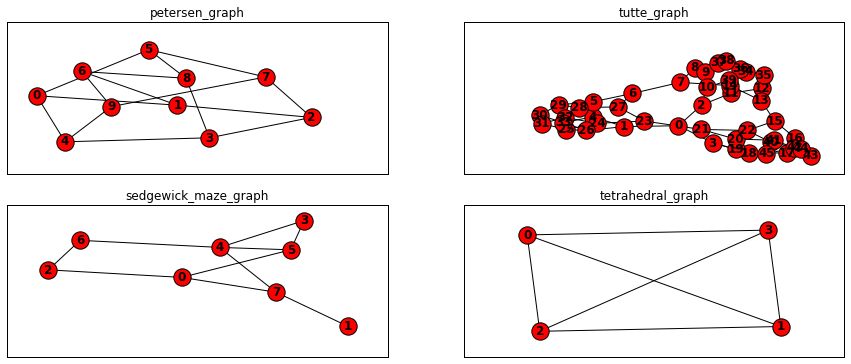
2.4各种已经被命名的小graph
- plt.subplots(2,2,figsize=(15,6))
- petersen = nx.petersen_graph()
- plt.subplot(221)
- plt.title('petersen_graph')
- nx.draw(petersen, with_labels=True, font_weight='bold')
- plt.axis('on')
- plt.xticks([])
- plt.yticks([])
- tutte = nx.tutte_graph()
- plt.subplot(222)
- plt.title('tutte_graph')
- nx.draw(tutte, with_labels=True, font_weight='bold')
- plt.axis('on')
- plt.xticks([])
- plt.yticks([])
- maze = nx.sedgewick_maze_graph()
- plt.subplot(223)
- plt.title('sedgewick_maze_graph')
- nx.draw(maze, with_labels=True, font_weight='bold')
- plt.axis('on')
- plt.xticks([])
- plt.yticks([])
- tet = nx.tetrahedral_graph()
- plt.subplot(224)
- plt.title('tetrahedral_graph')
- nx.draw(tet, with_labels=True, font_weight='bold')
- plt.axis('on')
- plt.xticks([])
- plt.yticks([])
- plt.show()
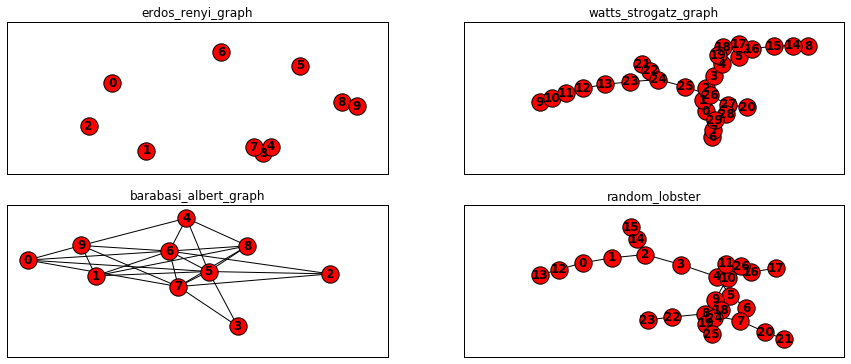
2.5使用随机graph生成器
- plt.subplots(2,2,figsize=(15,6))
- er = nx.erdos_renyi_graph(10, 0.15)
- plt.subplot(221)
- plt.title('erdos_renyi_graph')
- nx.draw(er, with_labels=True, font_weight='bold')
- plt.axis('on')
- plt.xticks([])
- plt.yticks([])
- ws = nx.watts_strogatz_graph(30, 3, 0.1)
- plt.subplot(222)
- plt.title('watts_strogatz_graph')
- nx.draw(ws, with_labels=True, font_weight='bold')
- plt.axis('on')
- plt.xticks([])
- plt.yticks([])
- ba = nx.barabasi_albert_graph(10, 5)
- plt.subplot(223)
- plt.title('barabasi_albert_graph')
- nx.draw(ba, with_labels=True, font_weight='bold')
- plt.axis('on')
- plt.xticks([])
- plt.yticks([])
- red = nx.random_lobster(10, 0.9, 0.9)
- plt.subplot(224)
- plt.title('random_lobster')
- nx.draw(red, with_labels=True, font_weight='bold')
- plt.axis('on')
- plt.xticks([])
- plt.yticks([])
- plt.show()
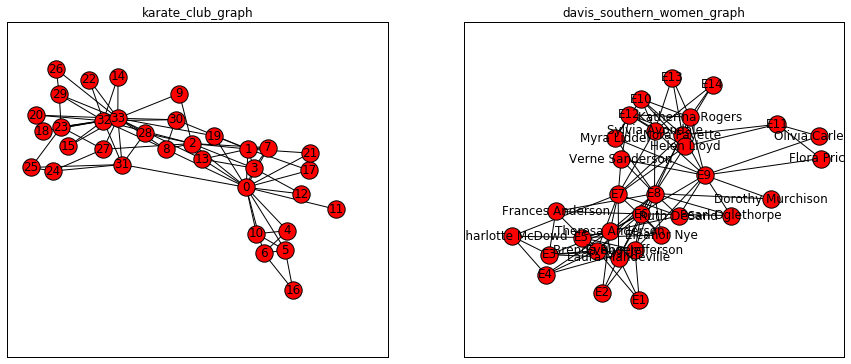
2.6社交网络
- plt.subplots(2,2,figsize=(15,6))
- #返回Zachary的空手道俱乐部图。
- G.clear()
- G = nx.karate_club_graph()
- plt.subplot(1,2,1)
- nx.draw(G,with_labels=True)
- plt.title('karate_club_graph')
- plt.axis('on')
- plt.xticks([])
- plt.yticks([])
- #戴维斯南方女性社交网络。
- G.clear()
- G = nx.davis_southern_women_graph()
- plt.subplot(1,2,2)
- nx.draw(G,with_labels=True)
- plt.title('davis_southern_women_graph')
- plt.axis('on')
- plt.xticks([])
- plt.yticks([])
- plt.show()
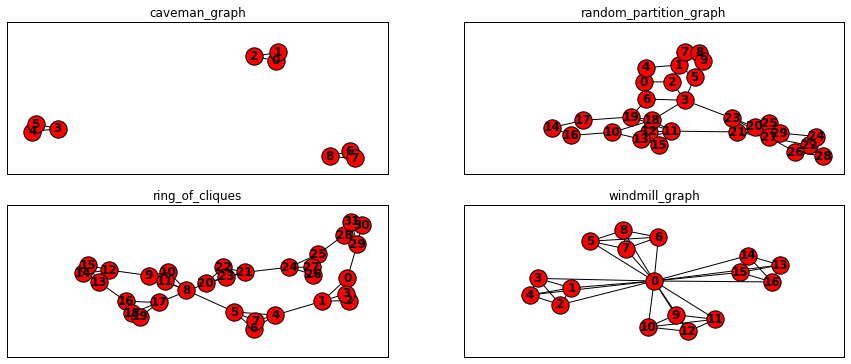
2.7社区
- plt.subplots(2,2,figsize=(15,6))
- er = nx.caveman_graph(3,3)
- plt.subplot(221)
- plt.title('caveman_graph')
- nx.draw(er, with_labels=True, font_weight='bold')
- plt.axis('on')
- plt.xticks([])
- plt.yticks([])
- ws = nx.random_partition_graph([10,10,10],.25,.01)
- plt.subplot(222)
- plt.title('random_partition_graph')
- nx.draw(ws, with_labels=True, font_weight='bold')
- plt.axis('on')
- plt.xticks([])
- plt.yticks([])
- ba = nx.ring_of_cliques(8, 4)
- plt.subplot(223)
- plt.title('ring_of_cliques')
- nx.draw(ba, with_labels=True, font_weight='bold')
- plt.axis('on')
- plt.xticks([])
- plt.yticks([])
- red = nx.windmill_graph(4,5)
- plt.subplot(224)
- plt.title('windmill_graph')
- nx.draw(red, with_labels=True, font_weight='bold')
- plt.axis('on')
- plt.xticks([])
- plt.yticks([])
- plt.show()
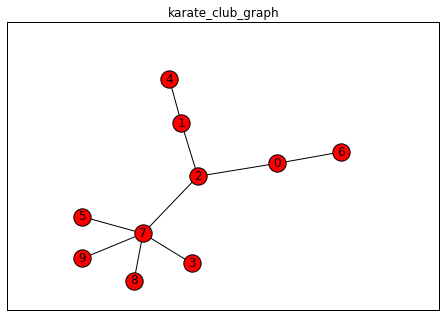
2.8树
- #返回随机树
- G.clear()
- G = nx.random_tree(10)
- nx.draw(G,with_labels=True)
- plt.title('random_tree')
- plt.axis('on')
- plt.xticks([])
- plt.yticks([])
- plt.show()
NetworkX系列教程(2)-graph生成器的更多相关文章
- NetworkX系列教程(11)-graph和其他数据格式转换
小书匠 Graph 图论 学过线性代数的都了解矩阵,在矩阵上的文章可做的很多,什么特征矩阵,单位矩阵等.grpah存储可以使用矩阵,比如graph的邻接矩阵,权重矩阵等,这节主要是在等到graph后 ...
- NetworkX系列教程(1)-创建graph
小书匠Graph图论 研究中经常涉及到图论的相关知识,而且常常面对某些术语时,根本不知道在说什么.前不久接触了NetworkX这个graph处理工具,发现这个工具已经解决绝大部分的图论问题(也许只是我 ...
- NetworkX系列教程(8)-Drawing Graph
小书匠Graph图论 如果只是简单使用nx.draw,是无法定制出自己需要的graph,并且这样的graph内的点坐标的不定的,运行一次变一次,实际中一般是要求固定的位置,这就需要到布局的概念了.详细 ...
- NetworkX系列教程(3)-手动创建graph
小书匠Graph图论 不可否认,日常中我们使用最多的还是,使用自己的数据去手动创建自己的图形,而不是使用生成器,现从给graph添加点和边入手,讲解手动创建graph. 目录: 3.给graph添加节 ...
- NetworkX系列教程(7)-对graph进行分析
小书匠Graph图论 graph构建完成后,对graph的连通等属性进行分析. 目录: 8.对图进行分析 8.1连通子图 8.2弱联通 8.3强连通 8.4子图 8.5条件过滤 注意:如果代码出现找不 ...
- NetworkX系列教程(6)-对graph进行操作
小书匠Graph图论 graph生成后,除了有查看操作,还有移除等操作,还有其他更多操作,具体可以看这里.下面将比较graph操作前后的不同. 目录: 7.对图进行操作 7.1移除某些节点和边 7.2 ...
- NetworkX系列教程(5)-查看graph的信息
小书匠Graph图论 有时候graph建好后,我们并不清除该graph内节点的,边的信息,这就需要调用函数去查看了. 目录: 6.查看Graph的信息 6.1查看graph内节点,边的 6.2查看gr ...
- NetworkX系列教程(4)-设置graph的信息
小书匠Graph图论 要画出美观的graph,需要对graph里面的节点,边,节点的布局都要进行设置,具体可以看官方文档:Adding attributes to graphs, nodes, and ...
- NetworkX系列教程(10)-算法之五:广度优先与深度优先
小书匠Graph图论 重头戏部分来了,写到这里我感觉得仔细认真点了,可能在NetworkX中,实现某些算法就一句话的事,但是这个算法是做什么的,用在什么地方,原理是怎么样的,不清除,所以,我决定先把图 ...
随机推荐
- CSS Cursor屬性 (光标停留显示)
<html> <body> <p>请把鼠标移动到单词上,可以看到鼠标指针发生变化:</p> <span style="cursor:au ...
- MySQL多表关联查询数量
//多表关联查询数量select user, t1.count1, t2.count2from user tleft join ( select user_id, count(sport_type) ...
- 2..net core 和.net framework 版本
同一台机器上可以安装多个版本的.net core runtime.比如: 每个.net core项目都可以指定自己所用的版本,所以改变某个项目的target version不会影响到其他的.安装新的r ...
- solr的post.jar
http://iamyida.iteye.com/blog/2207920 跟益达学Solr5之玩转post.jar
- iOS音频学习笔记二:iOS SDK中与音频有关的相关框架
上层: Media Player Framework: 包含MPMoviePlayerController.MPMoviePlayerViewController.MPMusicPla ...
- 小程序npm构建
npm initnpm install --productionnpm i 第三方组件名称 -S --production //重要
- 【leetcode】366.Find Leaves of Binary Tree
原题 Given a binary tree, collect a tree's nodes as if you were doing this: Collect and remove all lea ...
- Windows下静态库的制作与使用
参考 静态链接 VS 动态链接 静态库 VS 动态库 实验环境 OS:Windows10 企业版 IDE:Visual Studio 2017旗舰版 前言 静态链接库与动态链接库都是共享代码的方式,如 ...
- 【蜂窝】at+qcfg="band"的计算和使用
查询附件 Quectel_EC25_LTE_模块产品规格书_V1.6 可知当前的蜂窝模块所对应的band频带是什么? eg.1 EC25-AU 当前选择4G 优先, FDD LTE 可看手册QCFG命 ...
- Python获取爬虫数据, r.text 与 r.content 的区别
1.简单粗暴来讲: text 返回的是unicode 型的数据,一般是在网页的header中定义的编码形式. content返回的是bytes,二级制型的数据. 如果想要提取文本就用text 但是如果 ...