Pandas数据处理+Matplotlib绘图案例
利用pandas对数据进行预处理然后再使用matplotlib对处理后的数据进行数据可视化是数据分析中常用的方法。
第一组例子(星巴克咖啡店)
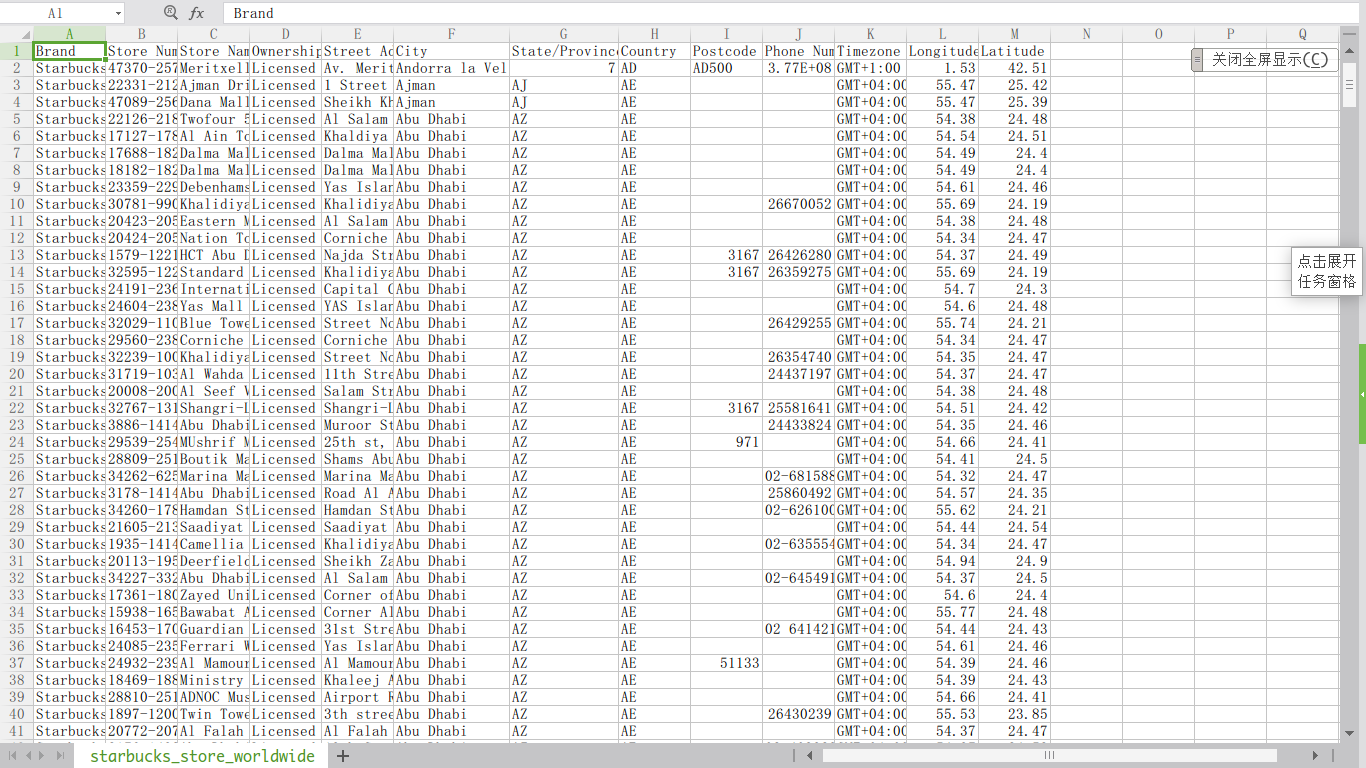
假如我们现在有这样一组数据:星巴克在全球的咖啡店信息,如下图所示。数据来源:starbucks_store_locations。
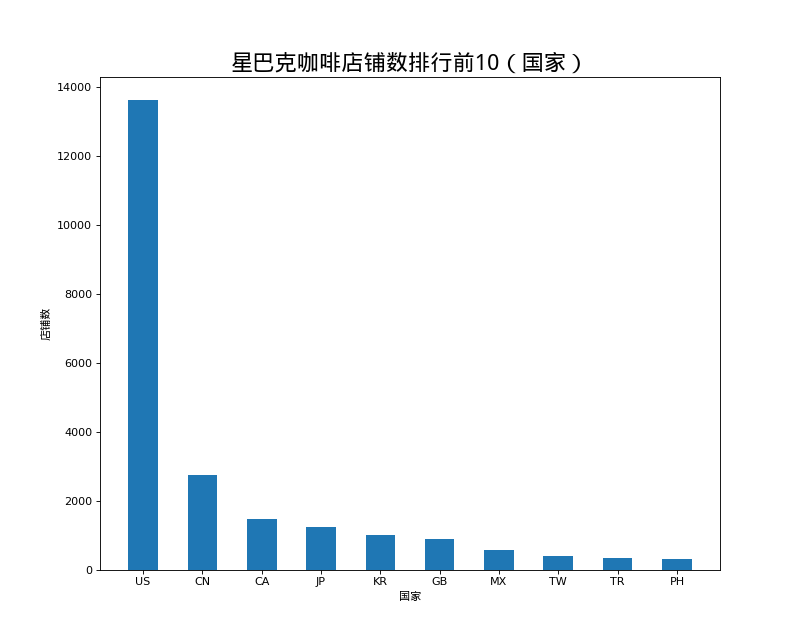
店铺总数排名前10的国家
# coding=utf-8

# 统计店铺数排名前10的国家

import pandas as pd

from matplotlib import pyplot as plt

from matplotlib import font_manager

# 准备工作

font = font_manager.FontProperties(fname="/usr/share/fonts/truetype/wqy/wqy-microhei.ttc")

file_path = "./starbucks_store_worldwide.csv"

df = pd.read_csv(file_path)

# 处理数据

data1 = df.groupby(by="Country").count().sort_values(by="Brand", ascending=False)[:10]["Brand"]

_x = data1.index

_y = data1.values

# 画图

plt.figure(figsize=(10,8), dpi=80)

plt.bar(range(len(_x)), _y, width=0.5)

plt.xticks(range(len(_x)), _x)

plt.xlabel("国家", fontproperties=font)

plt.ylabel("店铺数", fontproperties=font)

plt.title("星巴克咖啡店铺数排行前10(国家)", fontproperties=font, size=20)

plt.show()
结果如图:
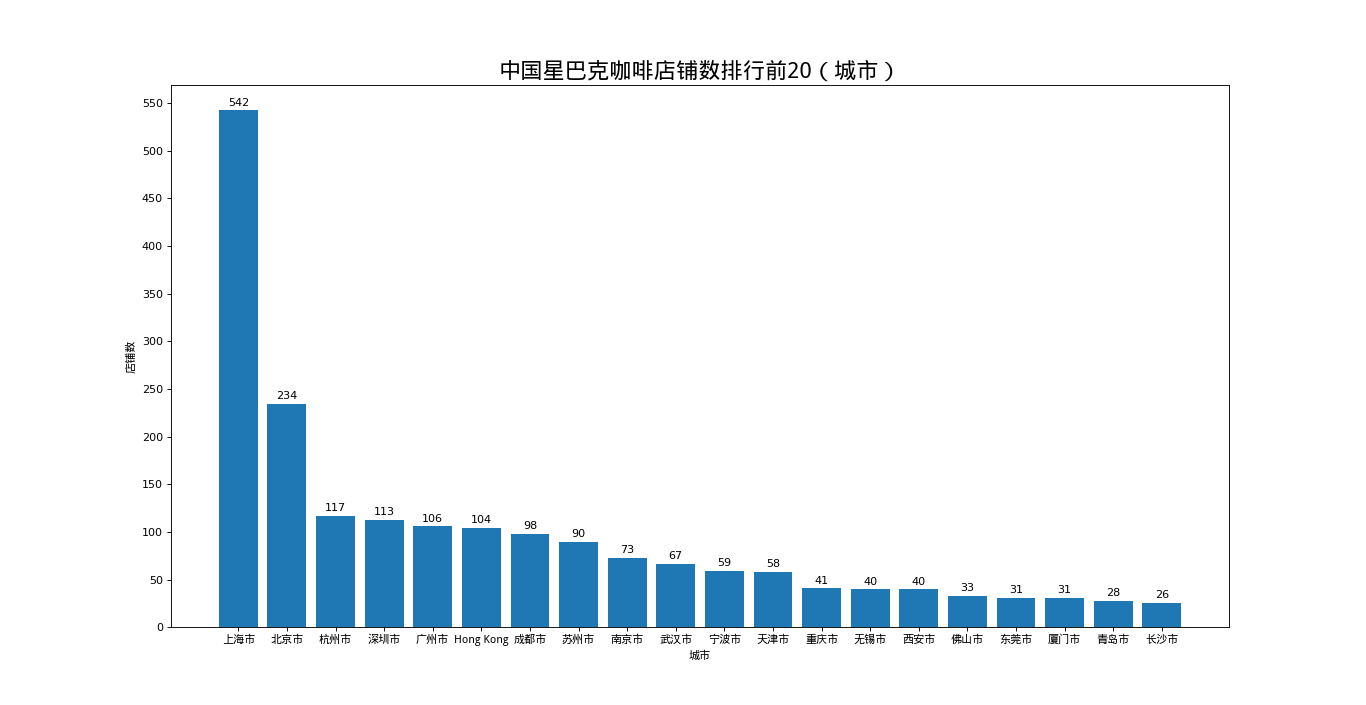
中国店铺数排名前20的城市
# coding=utf-8

# 统计中国店铺数排名前20的城市

import pandas as pd

from matplotlib import pyplot as plt

from matplotlib import font_manager

font = font_manager.FontProperties(fname="/usr/share/fonts/truetype/wqy/wqy-microhei.ttc")

file_path = "./starbucks_store_worldwide.csv"

df = pd.read_csv(file_path)

# 处理数据

df = df[df["Country"] == "CN"]

data1 = df.groupby(by="City").count().sort_values(by="Brand", ascending=False)[:20]["Brand"]

_x = list(data1.index)

_y = list(data1.values)

# 画图

plt.figure(figsize=(20,8), dpi=80)

plt.bar(range(len(_x)), _y)

# 添加条形图数值

for xx, yy in zip(range(len(_x)),_y):

    plt.text(xx, yy+5, str(yy), ha='center')

plt.xticks(range(len(_x)), _x, fontproperties=font)

plt.yticks(range(max(_y)+50)[::50])

plt.xlabel("城市", fontproperties=font)

plt.ylabel("店铺数", fontproperties=font)

plt.title("中国星巴克咖啡店铺数排行前20(城市)", fontproperties=font, size=20)

plt.show()
结果如图:
第二组例子(世界排行前10000书籍信息)
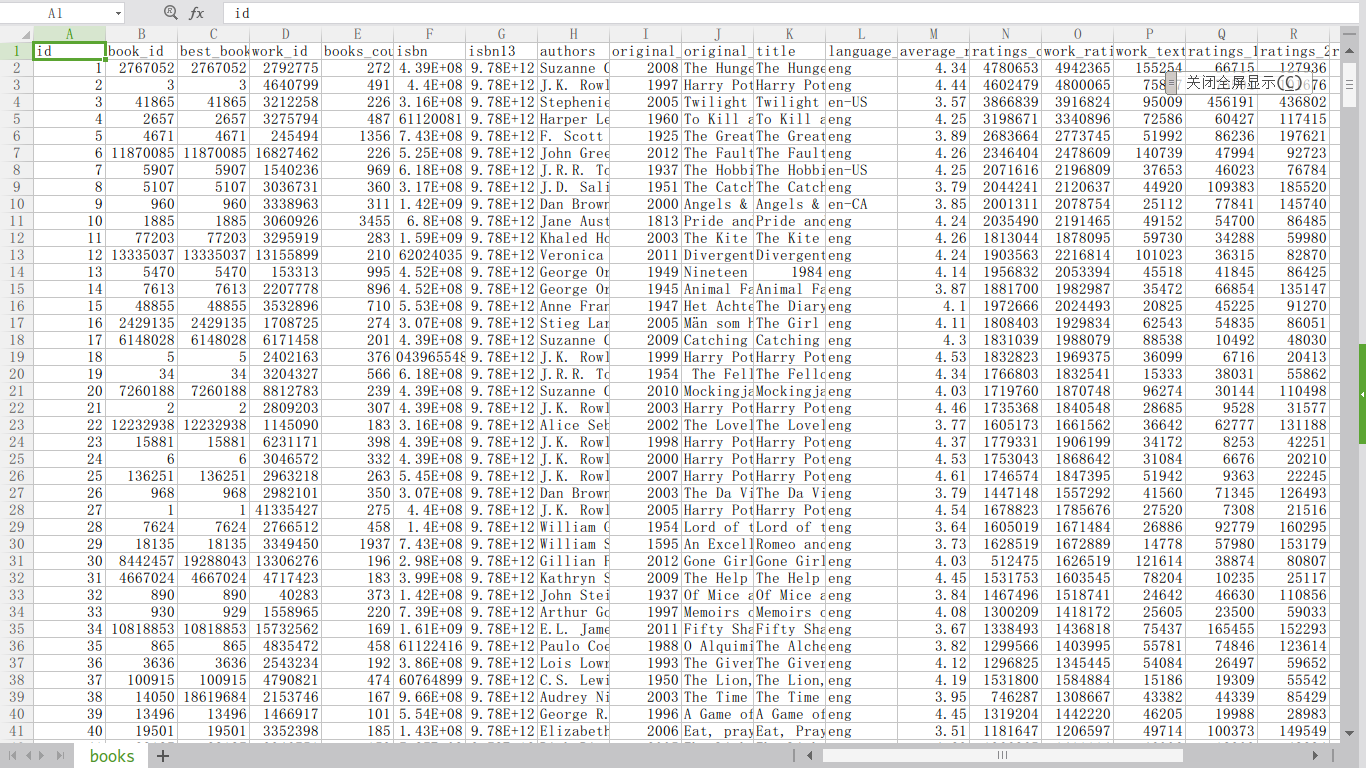
假如我们现在有这样一组数据:世界排行前10000书籍信息,如下图所示。数据来源:books。
各年份书籍平均评分
#  coding=utf-8

import pandas as pd

from matplotlib import pyplot as plt

file_path = "./books.csv"

pd.set_option('display.max_columns', 100)

df = pd.read_csv(file_path)

# 不同年份书籍的平均评分

# 去除NaN

data1 = df[pd.notnull(df["original_publication_year"])]

#

print(type(data1))

grouped = data1["average_rating"].groupby(by=data1["original_publication_year"]).mean()

print(grouped)

_x = grouped.index

_y = grouped.values

plt.figure(figsize=(20, 8), dpi=80)

plt.plot(range(len(_x)), _y)

plt.xticks(range(len(_x))[::15], _x[::15].astype(int), rotation=45)

plt.grid()

plt.show()
结果如图:
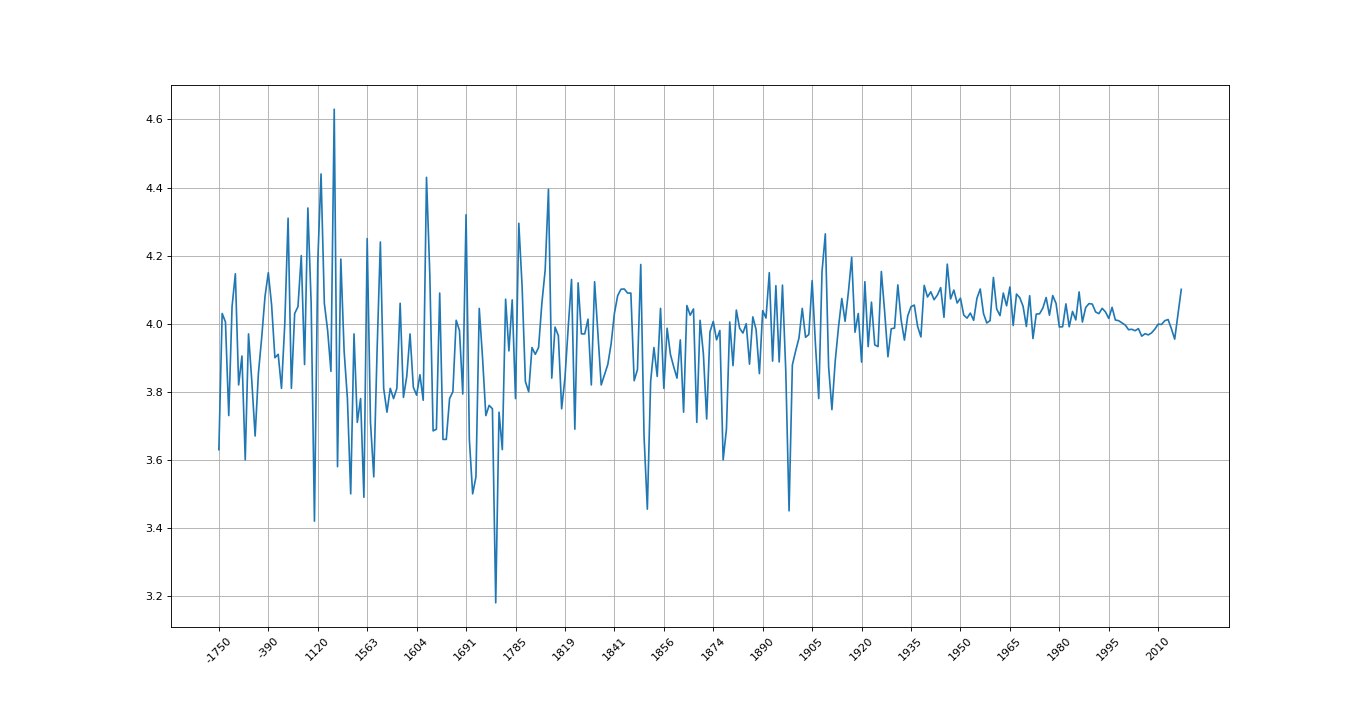
由于公元前的年份书籍较少,每年只有一本,所以数据波动幅度会很大,越往后就会越趋于平稳
911紧急求救电话信息
这个案例不牵扯绘图,但是这个案例中有个很重要的问题就是关于对数据进行遍历的问题。数据来源:Emergency - 911 Calls
假如我们要读取这个数据文件中各类求救电话的数量,应该怎么做呢?我们首先来看一下这个数据文件的基本信息。
# coding=utf-8

import pandas as pd

import numpy as np

file_path = "./911.csv"

pd.set_option('display.max_columns', 100)

df = pd.read_csv(file_path)

print(df.info())
结果如下:
<class 'pandas.core.frame.DataFrame'>

RangeIndex: 249737 entries, 0 to 249736

Data columns (total 9 columns):

lat          249737 non-null float64

lng          249737 non-null float64

desc         249737 non-null object

zip          219391 non-null float64

title        249737 non-null object

timeStamp    249737 non-null object

twp          249644 non-null object

addr         249737 non-null object

e            249737 non-null int64

dtypes: float64(3), int64(1), object(5)

memory usage: 17.1+ MB

None

Process finished with exit code 0
可以看到这个数据文件竟然有25万行之多- -
我们再查看他的第一行信息:
print(df.head(1))
结果如下:
         lat        lng                                               desc  \

0  40.297876 -75.581294  REINDEER CT & DEAD END;  NEW HANOVER; Station ...

       zip                   title            timeStamp          twp  \

0  19525.0  EMS: BACK PAINS/INJURY  2015-12-10 17:10:52  NEW HANOVER

                     addr  e

0  REINDEER CT & DEAD END  1

Process finished with exit code 0
可以看到类型适合具体事项都归类在了title里面,所以我们第一步首先要将类型和具体事项分隔开:
data1 = df["title"].str.split(": ").tolist()

# 这里我们直接对所得分类做了去重操作

data2 = set([i[0] for i in data1])
下面关键的一步,我们要统计各个分类下的求救电话数量。因为这个数据有25w行,所以如果像我之前的文章中去一行一行的遍历,程序的速度就会变得非常慢。这里我们使用for循环来遍历分类列表,则会快很多。
# 创建全0数组方便下一步的统计

a = pd.DataFrame(np.zeros((df.shape[0], len(data2))), columns=data2, dtype=int)

# 这一步就是将a中与原数据中相同索引行,但title中包含i类型求助信息的那个值置为1

for i in data2:

    a[i][df["title"].str.contains(i)] = 1

a_sum = a.sum(axis=0).sort_values(ascending=False)

print(a_sum)
结果如下:
EMS        124844

Traffic     87465

Fire        37432

dtype: int64
Pandas数据处理+Matplotlib绘图案例的更多相关文章
- 用Python的Pandas和Matplotlib绘制股票KDJ指标线
我最近出了一本书,<基于股票大数据分析的Python入门实战 视频教学版>,京东链接:https://item.jd.com/69241653952.html,在其中给出了MACD,KDJ ...
- Pandas与Matplotlib基础
pandas是Python中开源的,高性能的用于数据分析的库.其中包含了很多可用的数据结构及功能,各种结构支持相互转换,并且支持读取.保存数据.结合matplotlib库,可以将数据已图表的形式可视化 ...
- matplotlib绘图的基本操作
转自:Laumians博客园 更简明易懂看Matplotlib Python 画图教程 (莫烦Python)_演讲•公开课_科技_bilibili_哔哩哔哩 https://www.bilibili. ...
- Matplotlib绘图双纵坐标轴设置及控制设置时间格式
双y轴坐标轴图 今天利用matplotlib绘图,想要完成一个双坐标格式的图. fig=plt.figure(figsize=(20,15)) ax1=fig.add_subplot(111) ax1 ...
- Pandas与Matplotlib
Pandas与Matplotlib基础 pandas是Python中开源的,高性能的用于数据分析的库.其中包含了很多可用的数据结构及功能,各种结构支持相互转换,并且支持读取.保存数据.结合matplo ...
- Pandas与Matplotlib结合进行可视化
前面所介绍的都是以表格的形式中展现数据, 下面将介绍Pandas与Matplotlib配合绘制出折线图, 散点图, 饼图, 柱形图, 直方图等五大基本图形. Matplotlib是python中的一个 ...
- python数据分析使用matplotlib绘图
matplotlib绘图 关注公众号"轻松学编程"了解更多. Series和DataFrame都有一个用于生成各类图表的plot方法.默认情况下,它们所生成的是线形图 %matpl ...
- Python_科学计算平台__pypi体系的numpy、scipy、pandas、matplotlib库简介
1.numpy--基础,以矩阵为基础的数学计算模块,纯数学 存储和处理大型矩阵. 这个是很基础的扩展,其余的扩展都是以此为基础. 快速学习入口 https://docs.scipy.org/doc/n ...
- matplotlib 绘图
http://blog.csdn.net/jkhere/article/details/9324823 都打一遍 5 matplotlib-绘制精美的图表 matplotlib 是python最著名的 ...
随机推荐
- python learning 字符串方法
一.重点掌握的6种字符串方法: 1.join命令 功能:用于合并,将字符串中的每一个元素按照指定分隔符进行拼接 程序举例: seq = ['1','2','3','4'] sep = '+' v = ...
- 微信小程序wx.getLocation()获取经纬度及JavaScript SDK调用腾讯地图API获取某一类地址
简介 腾讯位置服务为微信小程序提供了基础的标点能力.线和圆的绘制接口等地图组件和位置展示.地图选点等地图API位置服务能力支持,使得开发者可以自由地实现自己的微信小程序产品. 在此基础上,腾讯位置服务 ...
- Mockito单元测试实战
最近使用Mockito完成了几个简单的测试,写个博客mark一下: 第一种模拟web请求 @SpringBootTest @RunWith(SpringRunner.class) @WebAppCon ...
- python函数把可变数据类型当默认参数值的问题(转)
add by zhj: 文章写的很好,其实只要默认参数在函数中只读不写,那默认值就不会被修改,可变类型做默认参数就不会有问题 方法二中,当result is None时,修改result的指向,不再指 ...
- XXL-JOB之本地环境搭建
一.源码下载 1.官网地址 登录以下地址查看详细搭建步骤: https://www.cnblogs.com/xuxueli/p/5021979.html 2.下载源码 根据1中打开的页面,下载源码,如 ...
- datetime 计算时间差
计算时间差: .date() # 格式化 .timedelta() # 时间差 import datetime # 今天 today = datetime.datetime ...
- netcorec程序部署配置
IIS方式: 1:iis配置netcore发布的文件 2:iis设置运行库无托管模式 3:安装DotNetCore.1.0.4_1.1.1-WindowsHosting.exe 4:安装dotnet- ...
- 短信利用weixin://connectToFreeWifi/?apKey=协议跳转到微信打开落地页h5
微信门店wifi接口,任意站跳转,跳转二维码长按识别加粉,接口支持动态传参数,支持微信支付等特殊接口对接. 代码如下使用 <head> <meta charset="utf ...
- windows10上安装mysql(详细步骤)
2016年09月06日 08:09:34 阅读数:46198 环境:windwos 10(1511) 64bit.mysql 5.7.14 时间:2016年9月5日 一.下载mysql 1. 在浏览器 ...
- php----------const 定义的常量和define()定义的常量的区别?
用法一:const用于类成员变量,一经定义不可修改,define用于全局常量,不可用于类成员变量的定义,const可在类中使用也可以在类外面使用,define不能. 定义:const 常量名=值; 没 ...