Prometheus+Grafana监控MySQL、Redis数据库
俗话说,没有监控的系统就是在裸奔,好的监控就是运维人员的第三只手,第三只眼。本文将使用prometheus及Grafana搭建一套监控系统来监控主机及数据库(MySQL、Redis)。
1. 安装Grafana
Grafana是一个可视化面板(Dashboard),有着非常漂亮的图表和布局展示,功能齐全的度量仪表盘和图形编辑器,支持Graphite、zabbix、InfluxDB、Prometheus等数据源。
1.1 下载并安装
下载地址:https://grafana.com/grafana/download

选择最新的版本进行安装,按照网站的提示运行脚本即可(监控服务器需可访问外网,如无法访问外网可与我沟通如何离线快速部署)。
运行如下脚本
wget https://dl.grafana.com/oss/release/grafana-6.3.3-1.x86_64.rpm

sudo yum localinstall grafana-6.3.-.x86_64.rpm
1.2 启动grafana
安装完成后,grafana服务默认已安装,配置文件为/etc/grafana/grafana.ini,如需修改路径及端口,可在该文件中修改

启动grafana
/etc/init.d/grafana-server start
1.3 登录grafana
访问页面http://服务器IP:3000 ,默认账号、密码admin/admin 首次登录将提示修改密码,建议修改

2. 安装Prometheus
2.1 Prometheus 主程序安装
Prometheus 主程序,主要是负责存储、抓取、聚合、查询方面
可登录官网进行下载,官网下载地址:https://prometheus.io/download/
根据操作系统类别选择文件进行下载,本次部署在linux上
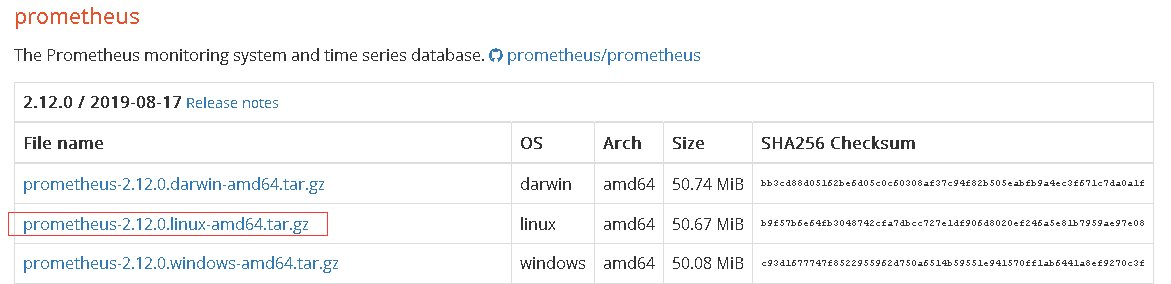
/**  下载*/

wget https://github.com/prometheus/prometheus/releases/download/v2.12.0/prometheus-2.12.0.linux-amd64.tar.gz

/**  解压*/

tar -zxvf prometheus-2.12..linux-amd64.tar.gz
2.2 启动prometheus主程序
生产环境可参考如下方式启动
/** 生产环境启动*/

nohup ./prometheus --config.file=prometheus.yml --web.enable-lifecycle --storage.tsdb.retention.time=60d   &

/**

 --web.enable-lifecycle  加上此参数可以远程热加载配置文件,无需重启prometheus,调用指令是curl -X POST http://ip:9090/-/reload

-- storage.tsdb.retention.time 数据默认保存时间为15天,启动时加上此参数可以控制数据保存时间

*/
其他的参数及配置可以在prometheus.yml中调整及配置
3. 在需监控的机器上部署exporter
3.1 监控linux主机
下载监控linux主机的node_exporter,依旧从官网下载
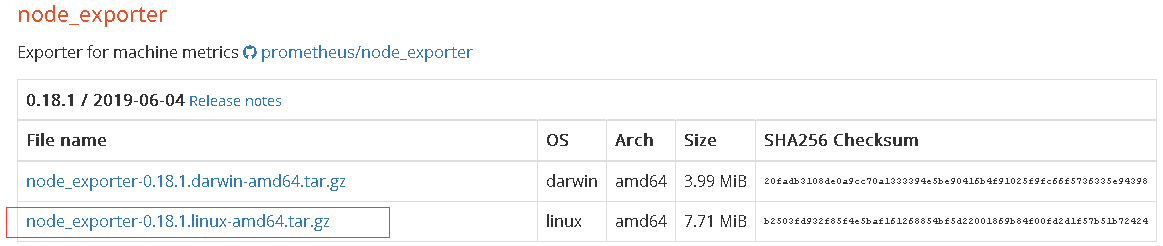
/**  下载  */

wget https://github.com/prometheus/node_exporter/releases/download/v0.18.1/node_exporter-0.18.1.linux-amd64.tar.gz

/**  解压  */

tar  -zxvf node_exporter-0.18..linux-amd64.tar.gz
可以按照默认方式启动
/** 启动 node_exporter*/

cd  node_exporter-0.18..linux-amd64

nohup ./node_exporter  &

/**

默认端口9100

*/
3.2 监控MySQL
3.2.1 下载
下载监控MySQL的mysqld_exporter,依旧从官网下载
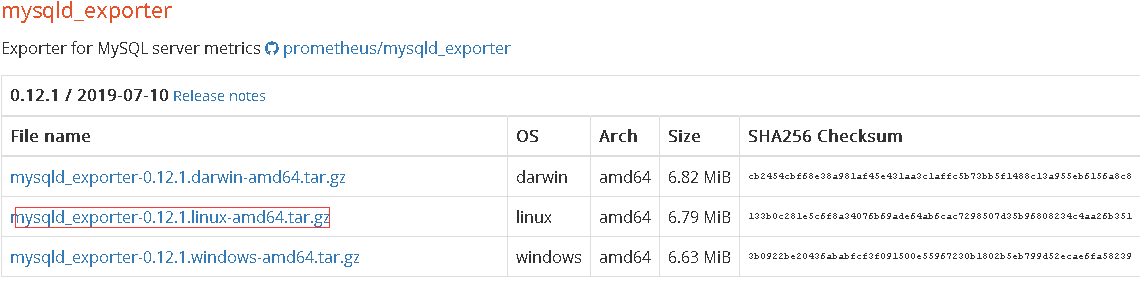
/**  下载  */

wget  https://github.com/prometheus/mysqld_exporter/releases/download/v0.12.1/mysqld_exporter-0.12.1.linux-amd64.tar.gz

/**  解压  */

tar -zxvf  mysqld_exporter-0.12..linux-amd64.tar.gz
3.2.2 监控账号及修改文件配置
在MySQL里配置MySQL监控账号
/**  创建账号  */

mysql> CREATE USER 'mysql_monitor'@'localhost' identified by 'mysql_monitor';

/** 授权 */

mysql> GRANT REPLICATION CLIENT, PROCESS ON *.* TO 'mysql_monitor'@'localhost';

mysql> GRANT SELECT ON performance_schema.* TO 'mysql_monitor'@'localhost';

/**

注意,不用版本对权限要求不一致,启动时注意查看日志,如权限不足则继续授权或创建对应的账号

*/
配置文件修改
cd mysqld_exporter-0.12..linux-amd64

vim .my.cnf

/**  添加如下配置 */

[client]

port=

user=mysql_monitor

password=mysql_monitor
3.2.3 启动监控脚本
nohup ./mysqld_exporter --config.my-cnf=.my.cnf &
3.3 监控redis
3.3.1 下载redis_exporter
官网上没有redis_exporter, 可以从github上获取,另外redis插件无需放在redis机器上也可以
/**  下载  */

wget https://github.com/oliver006/redis_exporter/releases/download/v0.30.0/redis_exporter-v0.30.0.linux-amd64.tar.gz

/**  解压  */

tar -zxvf  redis_exporter-v0.30.0.linux-amd64.tar.gz
3.3.2 启动redis_exporter
/**  redis无密码 */

nohup  ./redis_exporter -redis.addr=192.168.56.118: -web.listen-address 0.0.0.0:9121  &

/**  redis有密码  */

nohup  ./redis_exporter -redis.addr=192.168.56.118: -redis.password    -web.listen-address 0.0.0.0:9122 &

/**

 -web.listen-address  可以自定义监控端口

*/
4. 配置prometheus配置文件
4.1 添加各监控项
配置文件可以有多种配置方式,可以根据不同的分类和习惯配置。可参考如下方式配置
# my global config

global:

  scrape_interval:     15s # Set the scrape interval to every 15 seconds. Default is every 1 minute.

  evaluation_interval: 15s # Evaluate rules every 15 seconds. The default is every 1 minute.

  # scrape_timeout is set to the global default (10s).

# Alertmanager configuration

alerting:

  alertmanagers:

  - static_configs:

    - targets:

      # - alertmanager:9093

# Load rules once and periodically evaluate them according to the global 'evaluation_interval'.

rule_files:

  # - "first_rules.yml"

  # - "second_rules.yml"

# A scrape configuration containing exactly one endpoint to scrape:

# Here it's Prometheus itself.

scrape_configs:

  # The job name is added as a label `job=<job_name>` to any timeseries scraped from this config.

  - job_name: 'prometheus'

    # metrics_path defaults to '/metrics'

    # scheme defaults to 'http'.

    static_configs:

    - targets: ['localhost:9090']

  - job_name: 'OS'

    # metrics_path defaults to '/metrics'

    # scheme defaults to 'http'.

    static_configs:

    - targets: ['192.168.56.114:9100']

      labels:

          instance: '192.168.56.114'

    - targets: ['192.168.56.116:9100']

      labels:

          instance: '192.168.56.116'

    - targets: ['192.168.56.117:9100']

      labels:

          instance: '192.168.56.117'

##  上述job单独做主机监控,每台主机的instance不同

  - job_name: 'mysql'

    # metrics_path defaults to '/metrics'

    # scheme defaults to 'http'.

    static_configs:

    - targets: ['192.168.56.116:9104']

      labels:

          instance: '192.168.56.116'

    - targets: ['192.168.56.117:9104']

      labels:

          instance: '192.168.56.117'

  ## 以上是监控mysql的,instance和主机的instance的相同

  - job_name: 'redis'

    # metrics_path defaults to '/metrics'

    # scheme defaults to 'http'.

    static_configs:

    - targets: ['192.168.56.118:9121','192.168.56.118:9122']

      labels:

          instance: '192.168.56.118'

    - targets: ['192.168.56.118:9100']

      labels:

          instance: '192.168.56.118'

#   可以类似上述这种,redis的主机及各redis监控项组合在一起,instance使用相同的
4.2 启动或热加载prometheus
/**  启动  */

nohup ./prometheus --config.file=prometheus.yml --web.enable-lifecycle --storage.tsdb.retention.time=60d   &

/**

-- storage.tsdb.retention.time 数据默认保存时间为15天,启动时加上此参数可以控制数据保存时间

*/

/**  热加载  */

curl -X POST http://ip:9090/-/reload

/**

热加载的前提是启动时加了--web.enable-lifecycle

*/
5. 配置各监控仪表盘
5.1 下载各监控仪表盘
以上模板grafana官方网站均有,可以根据自己的需要下载对应的模板,对应地址为https://grafana.com/grafana/dashboards
找到对应的仪表盘模板后进入下载

5.2 配置数据源
本次使用的均为prometheus数据源,因此配置一个prometheus的数据源
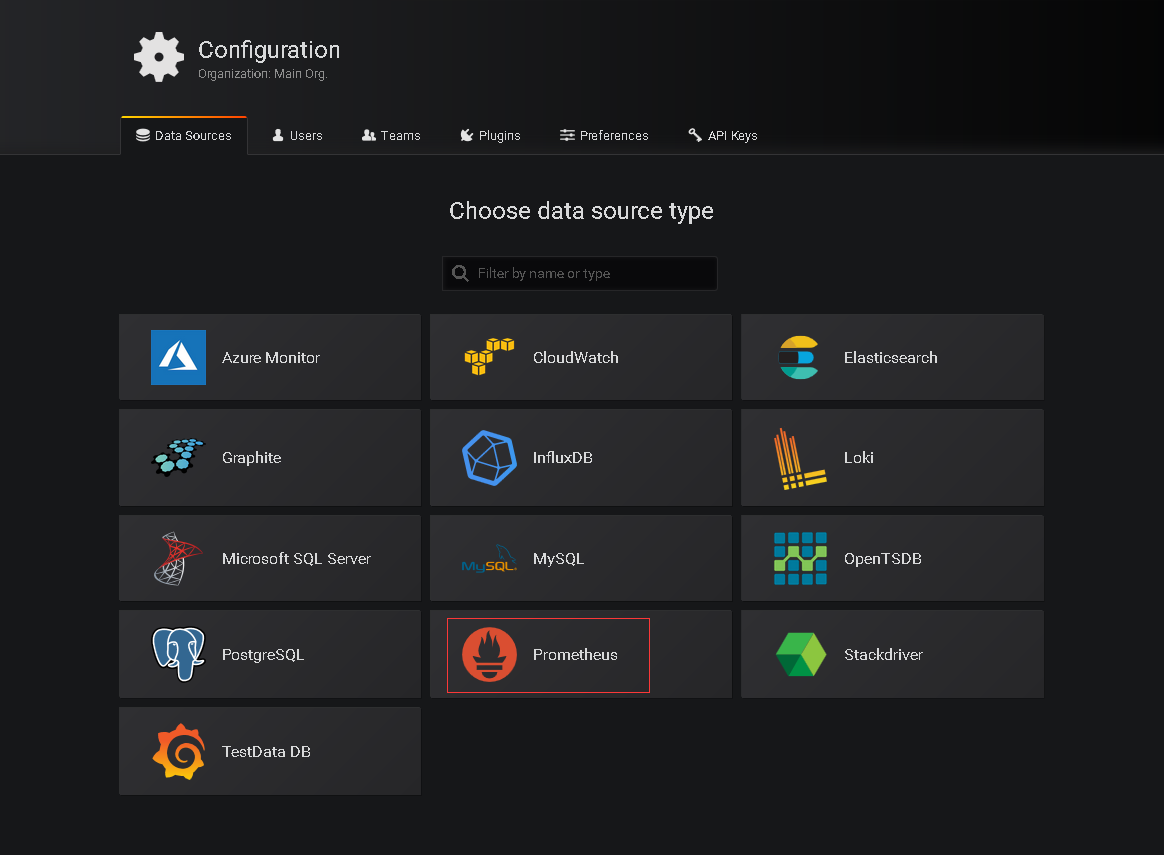
如果之前在grafana上没有配置过数据源 登录后会提示创建
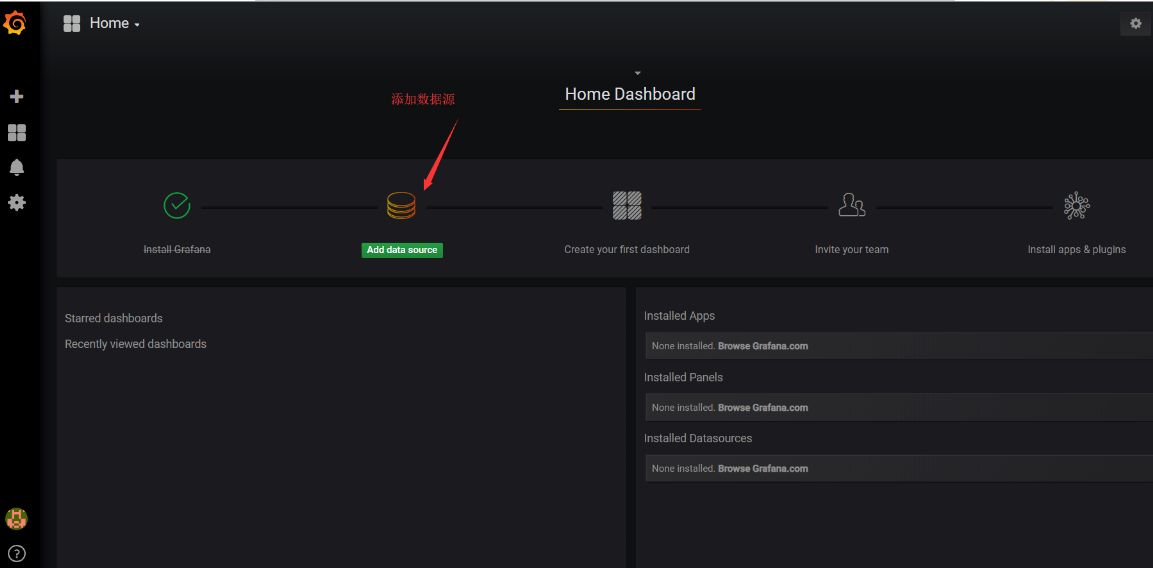
选择prometheus
配置prometheus地址
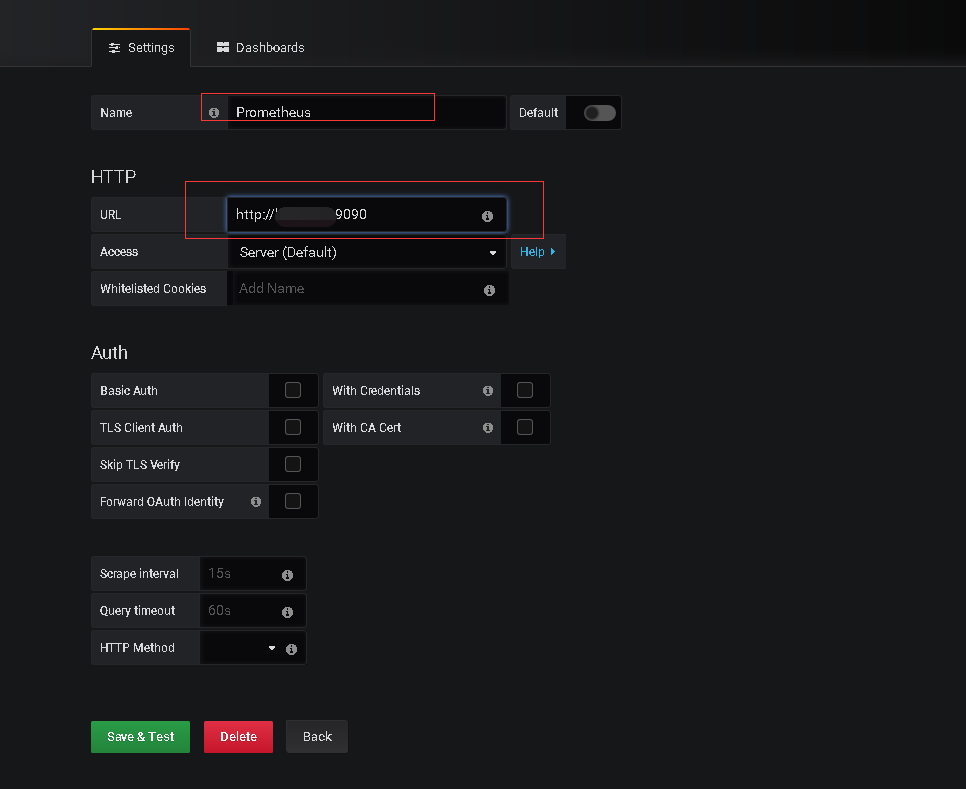
最终save & Test即可
5.3 导入仪表盘
将5.1中下载的模板导入
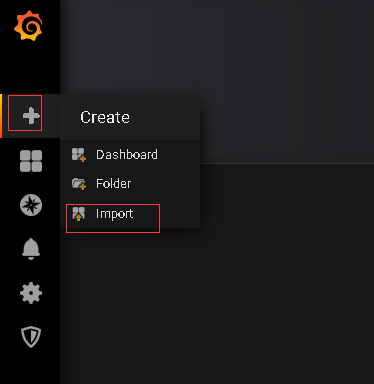
导入
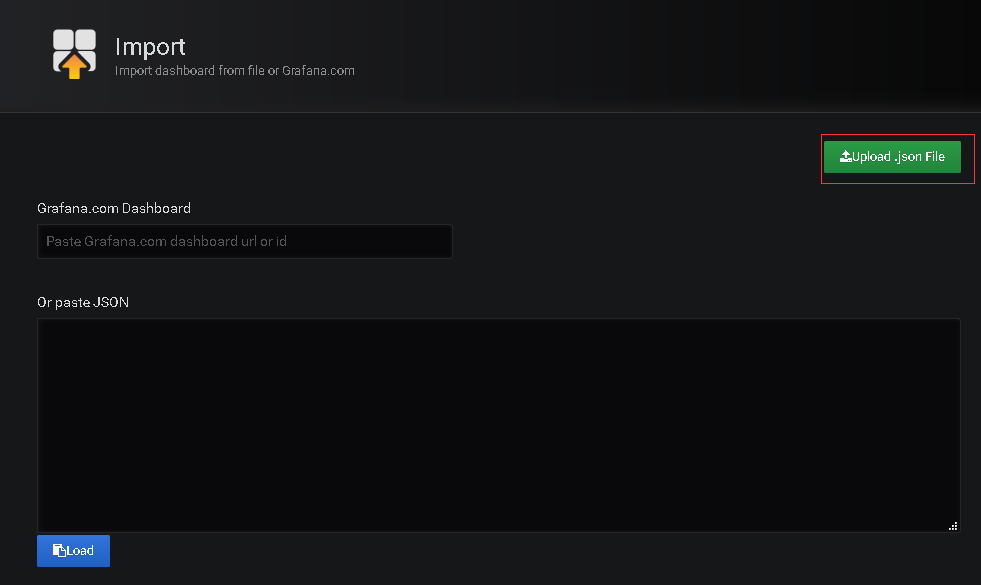
修改名称及数据源

import即可
5.4 配置完成后即可查看各监控情况
主机监控如下

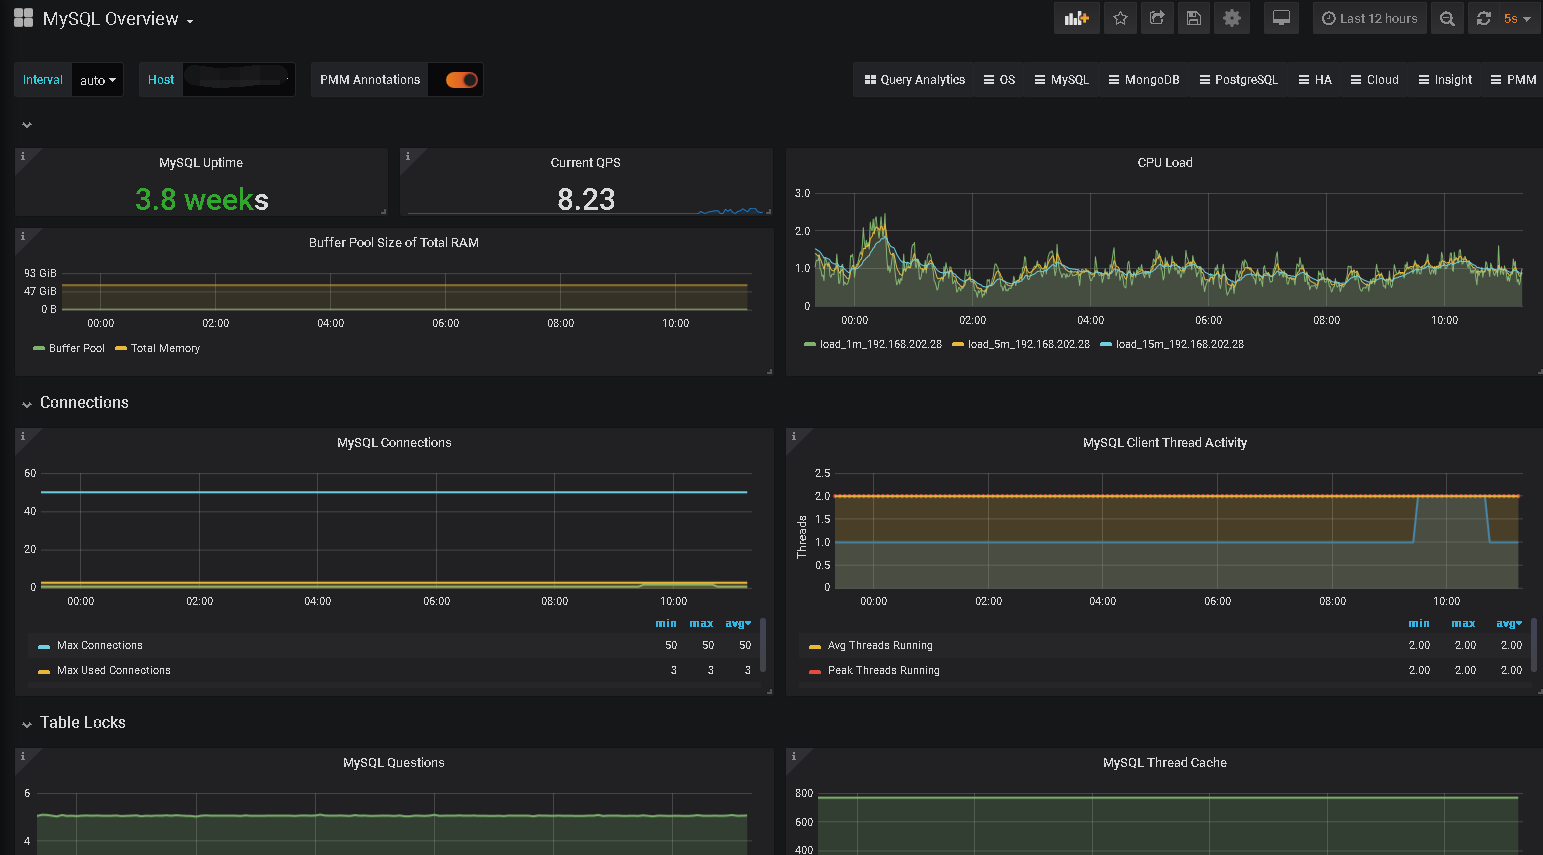
MySQL
Redis

其他如果需要其他监控项也可以自定义添加
Prometheus+Grafana监控MySQL、Redis数据库的更多相关文章
- [转帖]安装prometheus+grafana监控mysql redis kubernetes等
安装prometheus+grafana监控mysql redis kubernetes等 https://www.cnblogs.com/sfnz/p/6566951.html plug 的模式进行 ...
- 安装prometheus+grafana监控mysql redis kubernetes等
1.prometheus安装 wget https://github.com/prometheus/prometheus/releases/download/v1.5.2/prometheus-1.5 ...
- prometheus+grafana监控mysql
prometheus+grafana监控mysql 1.安装配置MySQL官方的 Yum Repository(有mysql只需设置监控账号即可) [root@localhost ~]# wget - ...
- Prometheus + Grafana 监控(mysql 和redis)
1.监控MySQL(mysqld-exporter) https://github.com/prometheus/mysqld_exporter/releases/download/v0.11.0/m ...
- 使用Prometheus+Grafana监控MySQL实践
一.介绍Prometheus Prometheus(普罗米修斯)是一套开源的监控&报警&时间序列数据库的组合,起始是由SoundCloud公司开发的.随着发展,越来越多公司和组织接受采 ...
- prometheus+grafana监控mysql最佳实践
导航 前言 环境准备 安装Docker 安装prometheus 安装mysqld_exporter prometheus采集数据 安装grafana grafana配置数据源 感谢您的阅读,预计阅读 ...
- 技术分享 | Prometheus+Grafana监控MySQL浅析
GreatSQL社区原创内容未经授权不得随意使用,转载请联系小编并注明来源. 简介 Prometheus 一套开源的监控&报警&时间序列数据库的组合,通常 Kubernetes 中都会 ...
- prometheus+grafana监控redis
prometheus+grafana监控redis redis安装配置 https://www.cnblogs.com/autohome7390/p/6433956.html redis_export ...
- Prometheus + Grafana 监控系统搭
本文主要介绍基于Prometheus + Grafana 监控Linux服务器. 一.Prometheus 概述(略) 与其他监控系统对比 1 Prometheus vs. Zabbix Zabbix ...
随机推荐
- 默认VS 下machine.config的位置
- pip 查看软件包 可用版本并安装; pip 查看 numpy 可用版本并安装
最近需要安装 numpy 的旧版本,发现不知道如何查看可以安装旧版本,解决方法在此进行记录: 然后找到你对应的版本进行安装就可以了: 保持更新,更多精彩内容,请关注 cnblogs.com/xuyao ...
- 面向对象程序设计(JAVA) 第15周学习指导及要求
2019面向对象程序设计(Java) 第15周学习指导及要求(2019.12.6-2019.12.13) 学习目标 (1) 掌握菜单组件用途及常用API: (2) 掌握对话框组件用途及常用API: ...
- luoguP3649 [APIO2014]回文串
题意 关于回文自动机的讲解见这里 由于回文串个数是\(O(n)\)的,直接回文自动机上统计并比较即可. code: #include<bits/stdc++.h> using namesp ...
- flex.css声明式布局
flex.css能完美的运行在移动端的各种浏览器,甚至能运行在ie10+的各种PC端浏览器中 flex和data-flex flex.css 有两个版本,一个是flex.css一个是data-flex ...
- <Array> 309 (高)334
309. Best Time to Buy and Sell Stock with Cooldown class Solution { public int maxProfit(int[] price ...
- 【WPF on .NET Core 3.0】 Stylet演示项目 - 简易图书管理系统(2) - 单元测试
上一章中我们完成了一个简单的登录功能, 这一章主要演示如何对Stylet工程中的ViewModel进行单元测试. 回忆一下我们的登录逻辑,主要有以下4点: 当"用户名"或" ...
- JUnit & JMockit单元测试
JUnit&JMockit单元测试总结 1.JUnit简介 Java单元测试框架业内应用较多的是JUnit,它由Kent Beck和Erich Gamma建立,逐渐成为源于Kent Beck的 ...
- flag 履行我的flag
以后数组开小就不吃饭!!!!!! 上午考试不吃午饭 下午考试不吃晚饭 晚上考试不吃早饭 我以后还能吃饭吗 11.12距离csp-s还有2天,我的数组开小了,履行承诺,不吃饭了
- 大话设计模式Python实现-解释器模式
解释器模式(Interpreter Pattern):给定一个语言,定义它的文法的一种表示,并定义一个解释器,这个解释器使用该表示来解释语言中的句子. 下面是一个解释器模式的demo: #!/usr/ ...