Prometheus + Grafana 监控(mysql 和redis)
1、监控MySQL(mysqld-exporter)
https://github.com/prometheus/mysqld_exporter/releases/download/v0.11.0/mysqld_exporter-0.11.0.linux-amd64.tar.gz
(1)被监控mysql机器安装mysqld-exporter
#tar -C /usr/local/ -xvf mysqld_exporter-0.11.0.linux-amd64.tar.gz
(2)设置配置文件,user为数据库登录用户,password为这个用户的密码
vi .my.cnf
[client]
user=root
password=123456
(3)启动mysqld-exporter
/usr/local/mysqld_exporter-0.11.0.linux-amd64/mysqld_exporter --config.my-cnf="/usr/local/mysqld_exporter-0.11.0.linux-amd64/.my.cnf" &
(4)prometheus配置文件中加入mysql监控并重启
vim /usr/local/Prometheus/prometheus.yml
默认mysqld-exporter端口为9104
- job_name: 'MySQL'
static_configs:
- targets: ['192.168.0.103:9104']
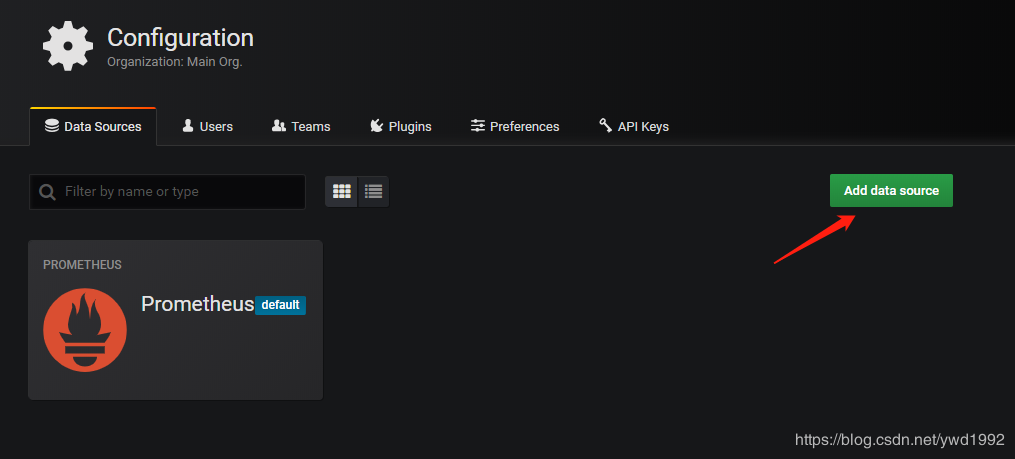
(5)设置数据源
grafana界面添加mysql数据源


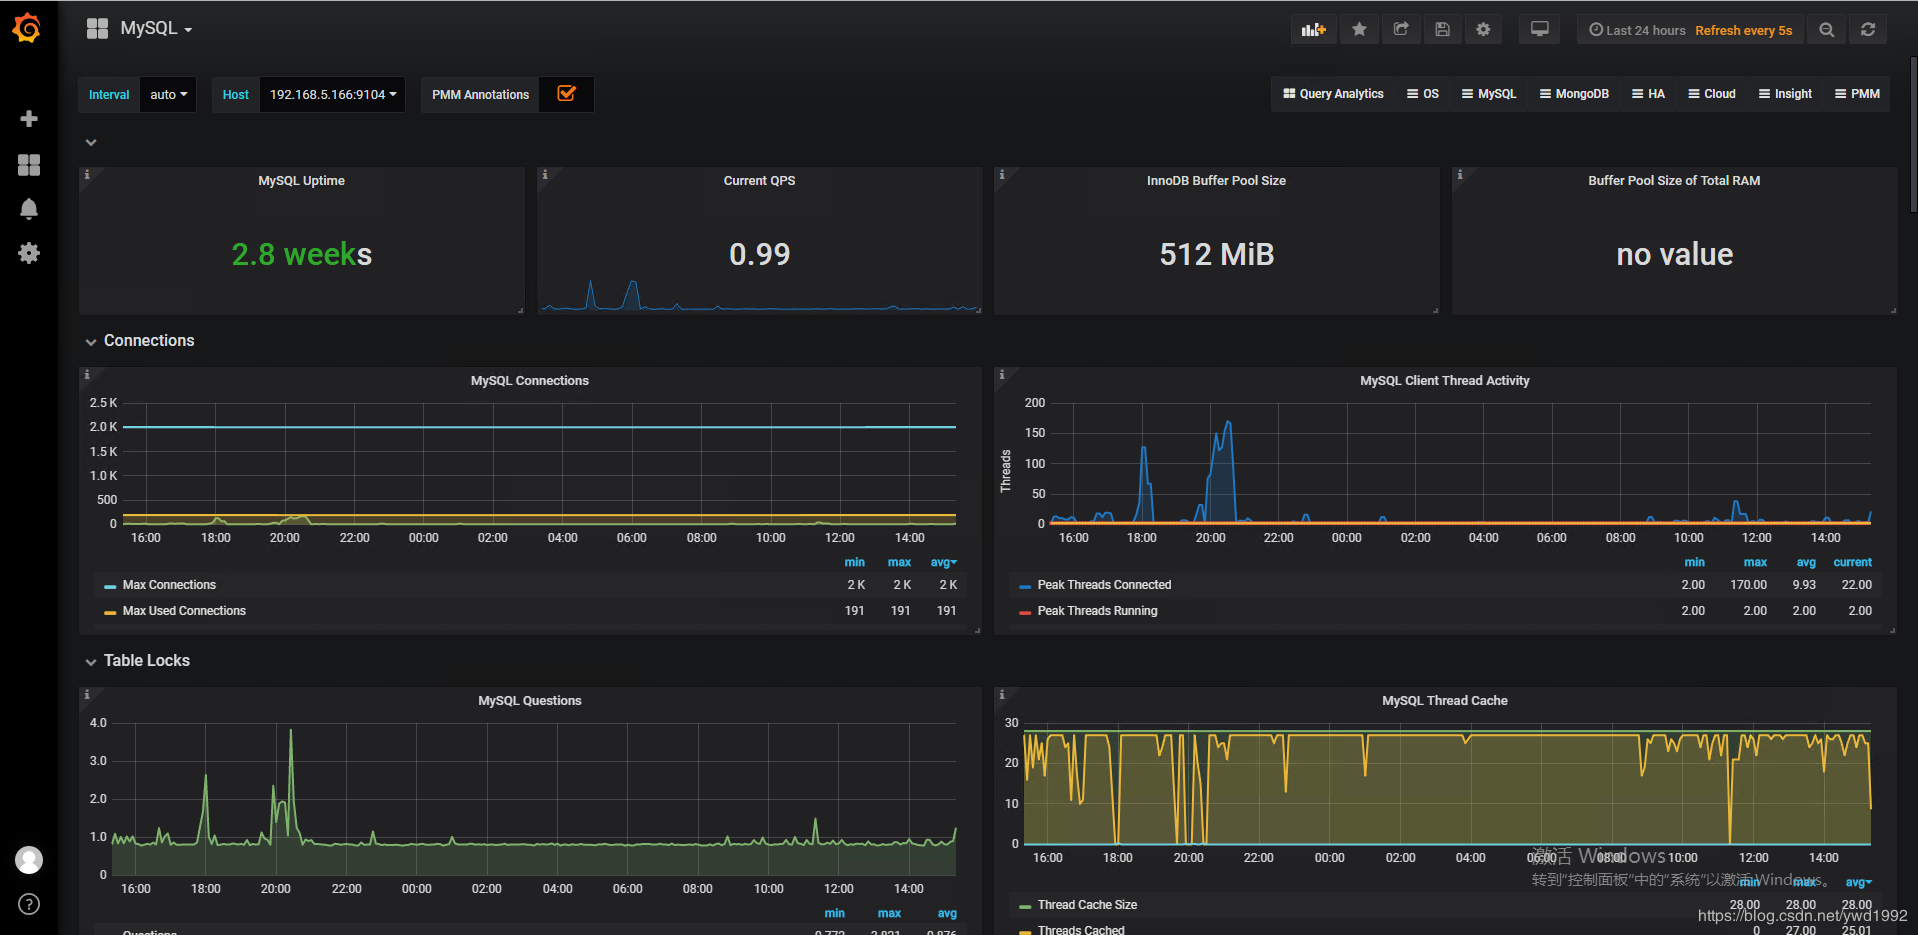
(6)导入已经画好的dashboard,数据源选择刚刚创建好的mysql数据源即可
- 链接:https://pan.baidu.com/s/1GBzogDLsYS3IvwH4WbdPLw 提取码:ef6e
2、监控Redis(redis_exporter)
链接:https://pan.baidu.com/s/12y7HxtQlBjFwr_i8ClM8Kw 提取码:13v2
(1)安装redis_exportertar -C /usr/local/ -xvf redis_exporter-v0.15.0.linux-amd64.tar.gz
(2)启动redis_exporter默认redis_exporter端口为9121
./redis_exporter redis//192.168.0.103:6379 & -web.listenaddress 192.168.0.103:9121
(3)prometheus配置文件中加入redis监控并重启vim /usr/local/Prometheus/prometheus.yml
默认redis-exporter端口为9121- job_name: 'Redis'
static_configs:
- targets: ['192.168.0.103:9121']
(4)grafana导入画好的dashboard链接:https://pan.baidu.com/s/1LIkVC0o3lyTT59JbX0mSpg 提取码:gf1d

Prometheus + Grafana 监控(mysql 和redis)的更多相关文章
- Prometheus+Grafana监控MySQL、Redis数据库
俗话说,没有监控的系统就是在裸奔,好的监控就是运维人员的第三只手,第三只眼.本文将使用prometheus及Grafana搭建一套监控系统来监控主机及数据库(MySQL.Redis). 1. 安装G ...
- [转帖]安装prometheus+grafana监控mysql redis kubernetes等
安装prometheus+grafana监控mysql redis kubernetes等 https://www.cnblogs.com/sfnz/p/6566951.html plug 的模式进行 ...
- prometheus+grafana监控mysql
prometheus+grafana监控mysql 1.安装配置MySQL官方的 Yum Repository(有mysql只需设置监控账号即可) [root@localhost ~]# wget - ...
- 使用Prometheus+Grafana监控MySQL实践
一.介绍Prometheus Prometheus(普罗米修斯)是一套开源的监控&报警&时间序列数据库的组合,起始是由SoundCloud公司开发的.随着发展,越来越多公司和组织接受采 ...
- prometheus+grafana监控mysql最佳实践
导航 前言 环境准备 安装Docker 安装prometheus 安装mysqld_exporter prometheus采集数据 安装grafana grafana配置数据源 感谢您的阅读,预计阅读 ...
- 技术分享 | Prometheus+Grafana监控MySQL浅析
GreatSQL社区原创内容未经授权不得随意使用,转载请联系小编并注明来源. 简介 Prometheus 一套开源的监控&报警&时间序列数据库的组合,通常 Kubernetes 中都会 ...
- 安装prometheus+grafana监控mysql redis kubernetes等
1.prometheus安装 wget https://github.com/prometheus/prometheus/releases/download/v1.5.2/prometheus-1.5 ...
- prometheus+grafana监控redis
prometheus+grafana监控redis redis安装配置 https://www.cnblogs.com/autohome7390/p/6433956.html redis_export ...
- Prometheus + Grafana 监控系统搭
本文主要介绍基于Prometheus + Grafana 监控Linux服务器. 一.Prometheus 概述(略) 与其他监控系统对比 1 Prometheus vs. Zabbix Zabbix ...
随机推荐
- 学习第一个python程序
打印9*9惩罚表 for i in range(1,10): for j in range(1,i+1): print(str(j)+"*"+str(i)+"=" ...
- 包子凑数(dp 0-1、完全背包)【背包问题】
包子凑数(蓝桥杯) 感谢:@ Statusrank 题目链接(点击) 题目描述 小明几乎每天早晨都会在一家包子铺吃早餐.他发现这家包子铺有N种蒸笼,其中第i种蒸笼恰好能放Ai个包子.每种蒸笼都有非常多 ...
- .Net Core微服务入门全纪录(三)——Consul-服务注册与发现(下)
前言 上一篇[.Net Core微服务入门全纪录(二)--Consul-服务注册与发现(上)]已经成功将我们的服务注册到Consul中,接下来就该客户端通过Consul去做服务发现了. 服务发现 同样 ...
- 2019-02-12 html的初步学习
前两天看了下python的爬虫,后面的抓包模拟登录实在是难弄,于是暂时放弃,来学学前端知识QAQ <!DOCTYPE html>文档类型符合HTML5标准 <html lang=&q ...
- mysql explain的type的
导语 很多情况下,有很多人用各种select语句查询到了他们想要的数据后,往往便以为工作圆满结束了.这些事情往往发生在一些学生亦或刚入职场但之前又没有很好数据库基础的小白身上,但所谓闻道有先后,只要我 ...
- python生成批量格式化字符串
在学习tensorflow管道化有关操作时,有一个操作是先生成一个文件名队列.在书上使用了这样的代码: filenames = ['test%d.txt'%i for in in range(1,4) ...
- Scanner扫描器的使用
Scanner:扫描器,可以通过Scanner类扫描用户在控制台录入的数据. 1.导包 //导包快捷键Alt+Enter 2.创建键盘录入对象 //键盘录入对象的名称为 “sc” 3.接收数据 //将 ...
- URL is not registered (Settings | Languages & Frameworks | Schemas and DTDs)
File - Settings - Schemas and DTDS时,选中报错的地址,然后Ctrl+alt+s打开设置(或者右键 -> setting)找到 把报错的地址填入就可以了,最后应用 ...
- 黎活明8天快速掌握android视频教程--27_网络通信之通过GET和POST方式提交参数给web应用
1该项目主要实现Android客户端以get的方式或者post的方式向java web服务器提交参数 Android客户端通过get方式或者post方式将参数提交给后台服务器,后台服务器对收到的参数进 ...
- 在MFC下绘制直线,使用橡皮筋技术,可以使直线效果跟随鼠标移
void CGraphic1View::OnMouseMove(UINT nFlags, CPoint point) { if(MK_LBUTTON == nFlags) { ...