
1. 使用 fluent-bit 采集文件
1. 使用 fluent-bit 采集文件

简介
Fluent Bit是一款快速、灵活的日志处理器,旨在收集、解析、过滤日志,并将日志发送到远程数据库,以便执行数据分析。
数据分析通常发生在数据存储和数据库索引之后,但对于实时和复杂的分析需求,在日志处理器中处理仍在运行的数据会带来很多好处,这种方法被称为边缘流处理(Stream Processing on the Edge)。
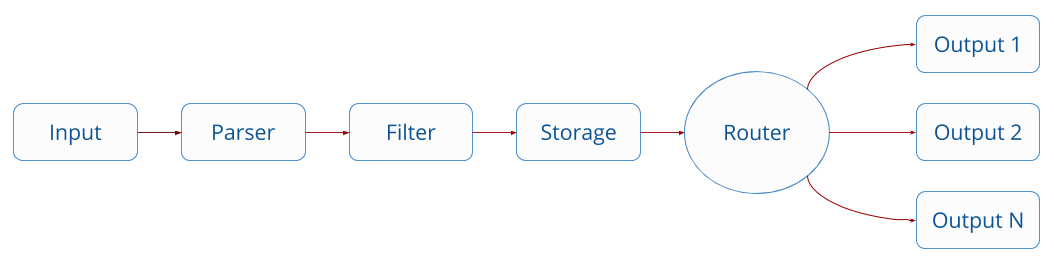
流式处理引擎架构
fluent-bit之所以这么说,其实是因为其架构设计了一个流式的处理引擎:
默认实现组件
fluent-bit实现了不少默认的组件:
INPUT
collectd, cpu-metrics, disk-io-metrics, docker-events, docker-metrics, dummy, exec, fluentbit-metrics, forward, head, health, http, kernel-logs, memory-metrics, mqtt, network-io-metrics, nginx, node-exporter-metrics, process, random, serial-interface, standard-input, statsd, syslog, systemd, tail, tcp, thermal, windows-event-log, windows-event-log-winevtlog, windows-exporter-metrics,OUTPUT
new-relic, forward, prometheus-remote-write, treasure-data, opensearch, skywalking, prometheus-exporter, azure, azure_blob, postgresql, bigquery, loki, elasticsearch, counter, null, cloudwatch, standard-output, syslog, websocket, flowcounter, logdna, firehose, influxdb, tcp-and-tls, kinesis, stackdriver, kafka-rest-proxy, opentelemetry, stackdriver_special_fields, slack, gelf, s3, datadog, splunk, file, http, kafka, natsFILTERS
grep, aws-metadata, nightfall, lua, parser, type-converter, nest, record-modifier, standard-output, throttle, multiline-stacktrace, expect, tensorflow, geoip2-filter, modify, checklist, kubernetes, rewrite-tagPARSERS
ltsv, configuring-parser, regular-expression, decoders, json, logfmt
该系列文章将介绍如何使用
Fluent Bit,进行数据采集、处理、分发的过程。
本节将以采集文本文件入手,并结合监控方法来逐步为您展开介绍;
编译部署
前置条件
fluent-bit 采用c语言编写,可以通过容器或者二进制进行部署安装;其占用较少的CPU和内存资源,目前能够兼容绝大部分基于x86、x86_64、arm32v7和arm64v8的系统平台;
为了能够进行在本地进行测试编译,你需要如下依赖环境:
- GCC or Clang
- CMake
- Flex & Bison: 仅当你需要流处理和记录访问器特性(这两种功能默认也是开启的)
编译
# clone 代码

git clone https://github.com/fluent/fluent-bit.git

# 切换到当前最新的一个发布分支

git checkout -b v1.9.1 v.9.1

# 编译

cd build

cmake ..

make

# 安装

# sudo make install 先不着急安装,我们来测试一下
测试
1. 先来创建一个测试路径:
mkdir ~/iSoft/fluent-bit -p

mkdir ~/isoft/fluent-bit/bin

mkdir ~/isoft/fluent-bit/conf

mkdir ~/isoft/fluent-bit/db

mkdir ~/isoft/fluent-bit/data

mkdir ~/isoft/fluent-bit/tmp

# 先将我们编译路径build下bin子路径内的东西全部复制过去

cp build/bin/* ~/iSoft/fluent-bit/bin/
2. 在conf目录下,创建三个配置文件:
fluent-bit.conf
[SERVICE]

    # Flush

    # =====

    # set an interval of seconds before to flush records to a destination

    flush        1

    # Daemon

    # ======

    # instruct Fluent Bit to run in foreground or background mode.

    daemon       Off

    # Log_Level

    # =========

    # Set the verbosity level of the service, values can be:

    #

    # - error

    # - warning

    # - info

    # - debug

    # - trace

    #

    # by default 'info' is set, that means it includes 'error' and 'warning'.

    log_level    info

    # Parsers File

    # ============

    # specify an optional 'Parsers' configuration file

    parsers_file parsers.conf

    # Plugins File

    # ============

    # specify an optional 'Plugins' configuration file to load external plugins.

    # plugins_file plugins.conf

    # HTTP Server

    # ===========

    # Enable/Disable the built-in HTTP Server for metrics

    http_server  On

    http_listen  0.0.0.0

    http_port    2020

    # Storage

    # =======

    # Fluent Bit can use memory and filesystem buffering based mechanisms

    #

    # - https://docs.fluentbit.io/manual/administration/buffering-and-storage

    #

    # storage metrics

    # ---------------

    # publish storage pipeline metrics in '/api/v1/storage'. The metrics are

    # exported only if the 'http_server' option is enabled.

    #

    #storage.metrics on

    # storage.path

    # ------------

    # absolute file system path to store filesystem data buffers (chunks).

    #

    # storage.path /tmp/storage

    # storage.sync

    # ------------

    # configure the synchronization mode used to store the data into the

    # filesystem. It can take the values normal or full.

    #

    # storage.sync normal

    # storage.checksum

    # ----------------

    # enable the data integrity check when writing and reading data from the

    # filesystem. The storage layer uses the CRC32 algorithm.

    #

    # storage.checksum off

    # storage.backlog.mem_limit

    # -------------------------

    # if storage.path is set, Fluent Bit will look for data chunks that were

    # not delivered and are still in the storage layer, these are called

    # backlog data. This option configure a hint of maximum value of memory

    # to use when processing these records.

    #

    # storage.backlog.mem_limit 5M

[INPUT]

    Name   tail

    Path   /home/etl/iSoft/fluent-bit/data/*.txt

    DB     /home/etl/iSoft/fluent-bit/db/tail.db

[OUTPUT]

    Name  stdout

    Match *
parser.conf
[PARSER]

    Name   json

    Format json

    Time_Key time

    Time_Format %d/%b/%Y:%H:%M:%S %z%
plugins.conf
这个文件其实暂时还用不上,是为我们自定义扩展插件的配置文件
[PLUGINS]

    # Path /path/to/out_gstdout.so
3. 启动fluent-bit
先进入到我们自己创建的tmp目录, 创建一些测试数据
cd ~/iSoft/fluent-bit/tmp

cat <<EOF > test-data.txt

{"log":"Done","stream":"stdout","time":"2018-02-19T23:25:29.1845622Z"}

{"log":"Done","stream":"stdout","time":"2018-02-19T23:25:29.1845622Z"}

{"log":"Done","stream":"stdout","time":"2018-02-19T23:25:29.1845622Z"}

{"log":"Done","stream":"stdout","time":"2018-02-19T23:25:29.1845622Z"}

{"log":"Done","stream":"stdout","time":"2018-02-19T23:25:29.1845622Z"}

{"log":"Done","stream":"stdout","time":"2018-02-19T23:25:29.1845622Z"}

{"log":"Done","stream":"stdout","time":"2018-02-19T23:25:29.1845622Z"}

{"log":"Done","stream":"stdout","time":"2018-02-19T23:25:29.1845622Z"}

{"log":"Done","stream":"stdout","time":"2018-02-19T23:25:29.1845622Z"}

{"log":"Done","stream":"stdout","time":"2018-02-19T23:25:29.1845622Z"}

EOF
根据上面fluent-bit.conf配置文件当中的INPUT/OUTPUT可以看出,我们利用了tail组件来监听data目录中的txt文件,并将结果输出到标准输出上来;
所以,启动程序
./fluent-bit -c ../conf/fluent-bit.conf

Fluent Bit v1.9.1

* Git commit: 619277847c6343dea9e4215deacd36cf61caf0a3

* Copyright (C) 2015-2021 The Fluent Bit Authors

* Fluent Bit is a CNCF sub-project under the umbrella of Fluentd

* https://fluentbit.io

[2022/03/20 15:23:43] [ info] [engine] started (pid=15543)

[2022/03/20 15:23:43] [ info] [storage] version=1.1.6, initializing...

[2022/03/20 15:23:43] [ info] [storage] in-memory

[2022/03/20 15:23:43] [ info] [storage] normal synchronization mode, checksum disabled, max_chunks_up=128

[2022/03/20 15:23:43] [ info] [cmetrics] version=0.3.0

[2022/03/20 15:23:43] [ info] [output:stdout:stdout.0] worker #0 started

[2022/03/20 15:23:43] [ info] [http_server] listen iface=0.0.0.0 tcp_port=2020

[2022/03/20 15:23:43] [ info] [sp] stream processor started
ok, fluent-bit已经阻塞开始监听了
4. 开始测试
重新开启一个终端创口,进入到创建好的tmp目录,将测试数据手动批量的输出到data目录下:
cd ~/iSoft/fluent-bit/tmp

cat test-data.txt >> ../data/test.txt

cat test-data.txt >> ../data/test.txt

cat test-data.txt >> ../data/test.txt

cat test-data.txt >> ../data/test.txt

cat test-data.txt >> ../data/test.txt

cat test-data.txt >> ../data/test.txt

cat test-data.txt >> ../data/test.txt
这时可以看到fluent-bit阻塞的窗口已经在一直输出了
Fluent Bit v1.9.1

* Git commit: 619277847c6343dea9e4215deacd36cf61caf0a3

* Copyright (C) 2015-2021 The Fluent Bit Authors

* Fluent Bit is a CNCF sub-project under the umbrella of Fluentd

* https://fluentbit.io

[2022/03/20 15:23:43] [ info] [engine] started (pid=15543)

[2022/03/20 15:23:43] [ info] [storage] version=1.1.6, initializing...

[2022/03/20 15:23:43] [ info] [storage] in-memory

[2022/03/20 15:23:43] [ info] [storage] normal synchronization mode, checksum disabled, max_chunks_up=128

[2022/03/20 15:23:43] [ info] [cmetrics] version=0.3.0

[2022/03/20 15:23:43] [ info] [output:stdout:stdout.0] worker #0 started

[2022/03/20 15:23:43] [ info] [http_server] listen iface=0.0.0.0 tcp_port=2020

[2022/03/20 15:23:43] [ info] [sp] stream processor started

[2022/03/20 15:23:43] [ info] [input:tail:tail.0] inotify_fs_add(): inode=11409520 watch_fd=1 name=/home/etl/iSoft/fluent-bit/data/test.txt

[0] tail.0: [1647761052.113552720, {"log"=>"{"log":"Done","stream":"stdout","time":"2018-02-19T23:25:29.1845622Z"}"}]

[0] tail.0: [1647763863.114999757, {"log"=>"{"log":"Done","stream":"stdout","time":"2018-02-19T23:25:29.1845622Z"}"}]

[1] tail.0: [1647763863.403883305, {"log"=>"{"log":"Done","stream":"stdout","time":"2018-02-19T23:25:29.1845622Z"}"}]

[0] tail.0: [1647763893.545292283, {"log"=>"{"log":"Done","stream":"stdout","time":"2018-02-19T23:25:29.1845622Z"}"}]

[0] tail.0: [1647763954.515264556, {"log"=>"{"log":"Done","stream":"stdout","time":"2018-02-19T23:25:29.1845622Z"}"}]

[1] tail.0: [1647763954.515268143, {"log"=>"{"log":"Done","stream":"stdout","time":"2018-02-19T23:25:29.1845622Z"}"}]

[2] tail.0: [1647763954.515268725, {"log"=>"{"log":"Done","stream":"stdout","time":"2018-02-19T23:25:29.1845622Z"}"}]

[3] tail.0: [1647763954.515269171, {"log"=>"{"log":"Done","stream":"stdout","time":"2018-02-19T23:25:29.1845622Z"}"}]

[4] tail.0: [1647763954.515269621, {"log"=>"{"log":"Done","stream":"stdout","time":"2018-02-19T23:25:29.1845622Z"}"}]

[5] tail.0: [1647763954.515270065, {"log"=>"{"log":"Done","stream":"stdout","time":"2018-02-19T23:25:29.1845622Z"}"}]

[6] tail.0: [1647763954.515270512, {"log"=>"{"log":"Done","stream":"stdout","time":"2018-02-19T23:25:29.1845622Z"}"}]

[7] tail.0: [1647763954.515270965, {"log"=>"{"log":"Done","stream":"stdout","time":"2018-02-19T23:25:29.1845622Z"}"}]

[8] tail.0: [1647763954.515271452, {"log"=>"{"log":"Done","stream":"stdout","time":"2018-02-19T23:25:29.1845622Z"}"}]

[9] tail.0: [1647763954.515276040, {"log"=>"{"log":"Done","stream":"stdout","time":"2018-02-19T23:25:29.1845622Z"}"}]
小结
通过上面的配置文件fluent-bit.conf看到,我们为INPUT tail组件,还配置了一个DB参数,那是因为tail组件采用了嵌入式的sqlite3的数据库来记录监听文件的偏移量,我们可以去查看一下:
cd ~/iSoft/fluent-bit/db

sqlite3 tail.db

sqlite> .schema

CREATE TABLE in_tail_files (  id      INTEGER PRIMARY KEY,  name    TEXT NOT NULL,  offset  INTEGER,  inode   INTEGER,  created INTEGER,  rotated INTEGER DEFAULT 0);

sqlite>

sqlite> select * from in_tail_files ;

1|/home/etl/iSoft/fluent-bit/data/test.txt|77520|11409520|1647761023|0

sqlite>
通过字段名称可以看出来,分别是文件全路径名称、读取到的文件偏移量(字节数)、文件inode、文件创建时间、文件滚动标记
监控
根据fluent-bit官网的介绍,我们在上面的配置文档中,将fluent-bit进程的http_server设置为On,并且暴露在2020端口上,那么我们可以使用如下两个接口来查看其输出情况:
curl -s http://127.0.0.1:2020/api/v1/uptime | jq

{

  "uptime_sec": 391,

  "uptime_hr": "Fluent Bit has been running:  0 day, 0 hour, 6 minutes and 31 seconds"

}

curl -s http://127.0.0.1:2020/api/v1/metrics | jq

{

  "input": {

    "tail.0": {

      "records": 1,

      "bytes": 88,

      "files_opened": 1,

      "files_closed": 0,

      "files_rotated": 0

    }

  },

  "filter": {},

  "output": {

    "stdout.0": {

      "proc_records": 1,

      "proc_bytes": 88,

      "errors": 0,

      "retries": 0,

      "retries_failed": 0,

      "dropped_records": 0,

      "retried_records": 0

    }

  }

}
拉取promethues grafana镜像
fluent-bit为promethues提供了监控接口,那么我们来尝试一下:
在本地拉取promethues和grafana的镜像(这里就简单的将这两位泡在容器里)
docker pull prom/prometheus

docker pull grafana/grafana
配置promethues
mkdir ~/isoft/prometheus

vim ~/isoft/prometheus/fluent-bit-prom.yaml
这里为prometheus增加了一个job,因为是运行在docker里面,所以选择了另外一个宿主机IP, 以能否访问运行在宿主机上的fluent-bit
# my global config

global:

  scrape_interval: 15s # Set the scrape interval to every 15 seconds. Default is every 1 minute.

  evaluation_interval: 15s # Evaluate rules every 15 seconds. The default is every 1 minute.

  # scrape_timeout is set to the global default (10s).

# Alertmanager configuration

alerting:

  alertmanagers:

    - static_configs:

        - targets:

          # - alertmanager:9093

# Load rules once and periodically evaluate them according to the global 'evaluation_interval'.

rule_files:

  # - "first_rules.yml"

  # - "second_rules.yml"

# A scrape configuration containing exactly one endpoint to scrape:

# Here it's Prometheus itself.

scrape_configs:

  # The job name is added as a label `job=<job_name>` to any timeseries scraped from this config.

  - job_name: "prometheus"

    # metrics_path defaults to '/metrics'

    # scheme defaults to 'http'.

    static_configs:

      - targets: ["localhost:9090"]

  - job_name: "fluent-bit"

    metrics_path: '/api/v1/metrics/prometheus' # metrics_path defaults to '/metrics'

    # scheme defaults to 'http'.

    static_configs:

      # 宿主机IP

      - targets: ["192.168.241.1:2020"]
启动
docker run -d -p 9090:9090 --name prom -v /home/etl/iSoft/prometheus/fluent-bit-prom.yaml:/etc/prometheus/prometheus.yml prom/prometheus
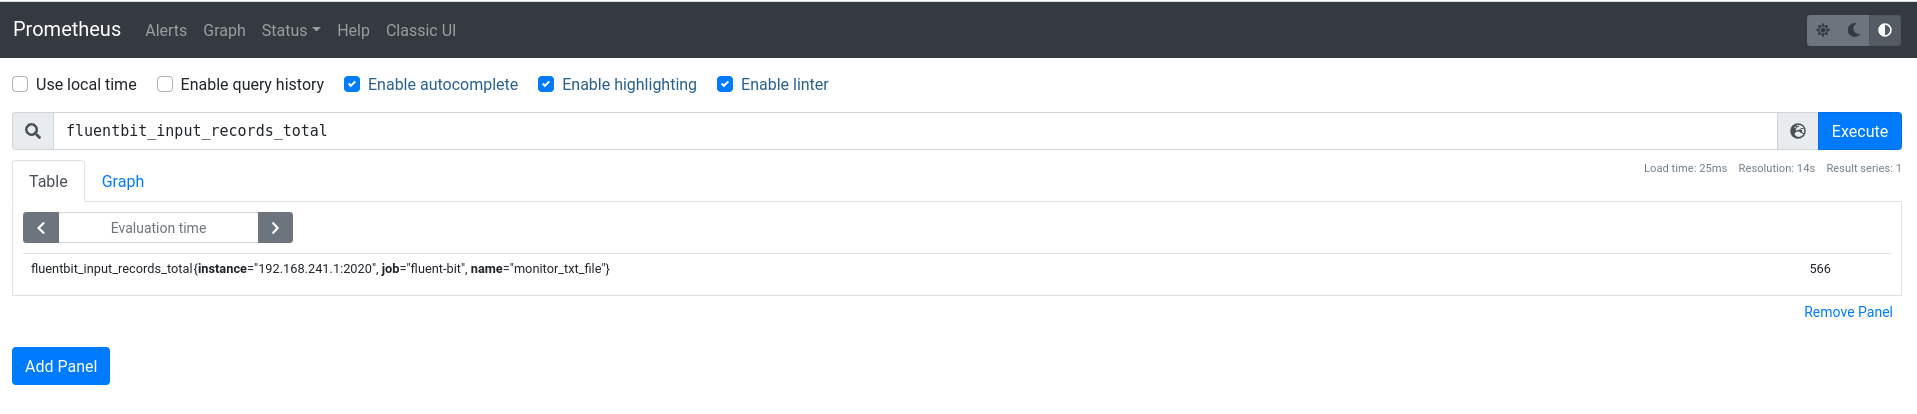
通过浏览器访问 http://localhost:9090/
配置grafana
mkdir ~/isoft/grafana/storage -p

chmod 777 ~/isoft/grafana/storage
启动
docker run -d -p 3000:3000 --name grafana -v /home/etl/iSoft/grafana/storage:/var/lib/grafana grafana/grafana
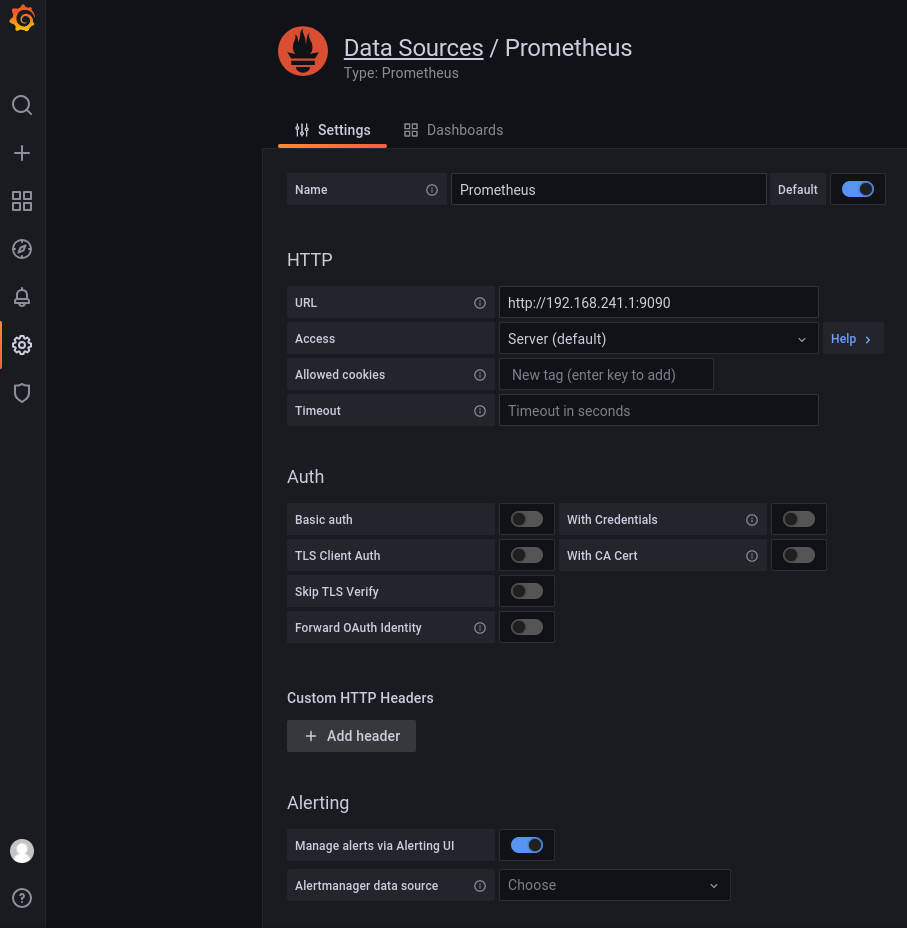
添加promethues数据源
导入fluent-bit提供的默认dashboard
fluent-bit-dashboard.json
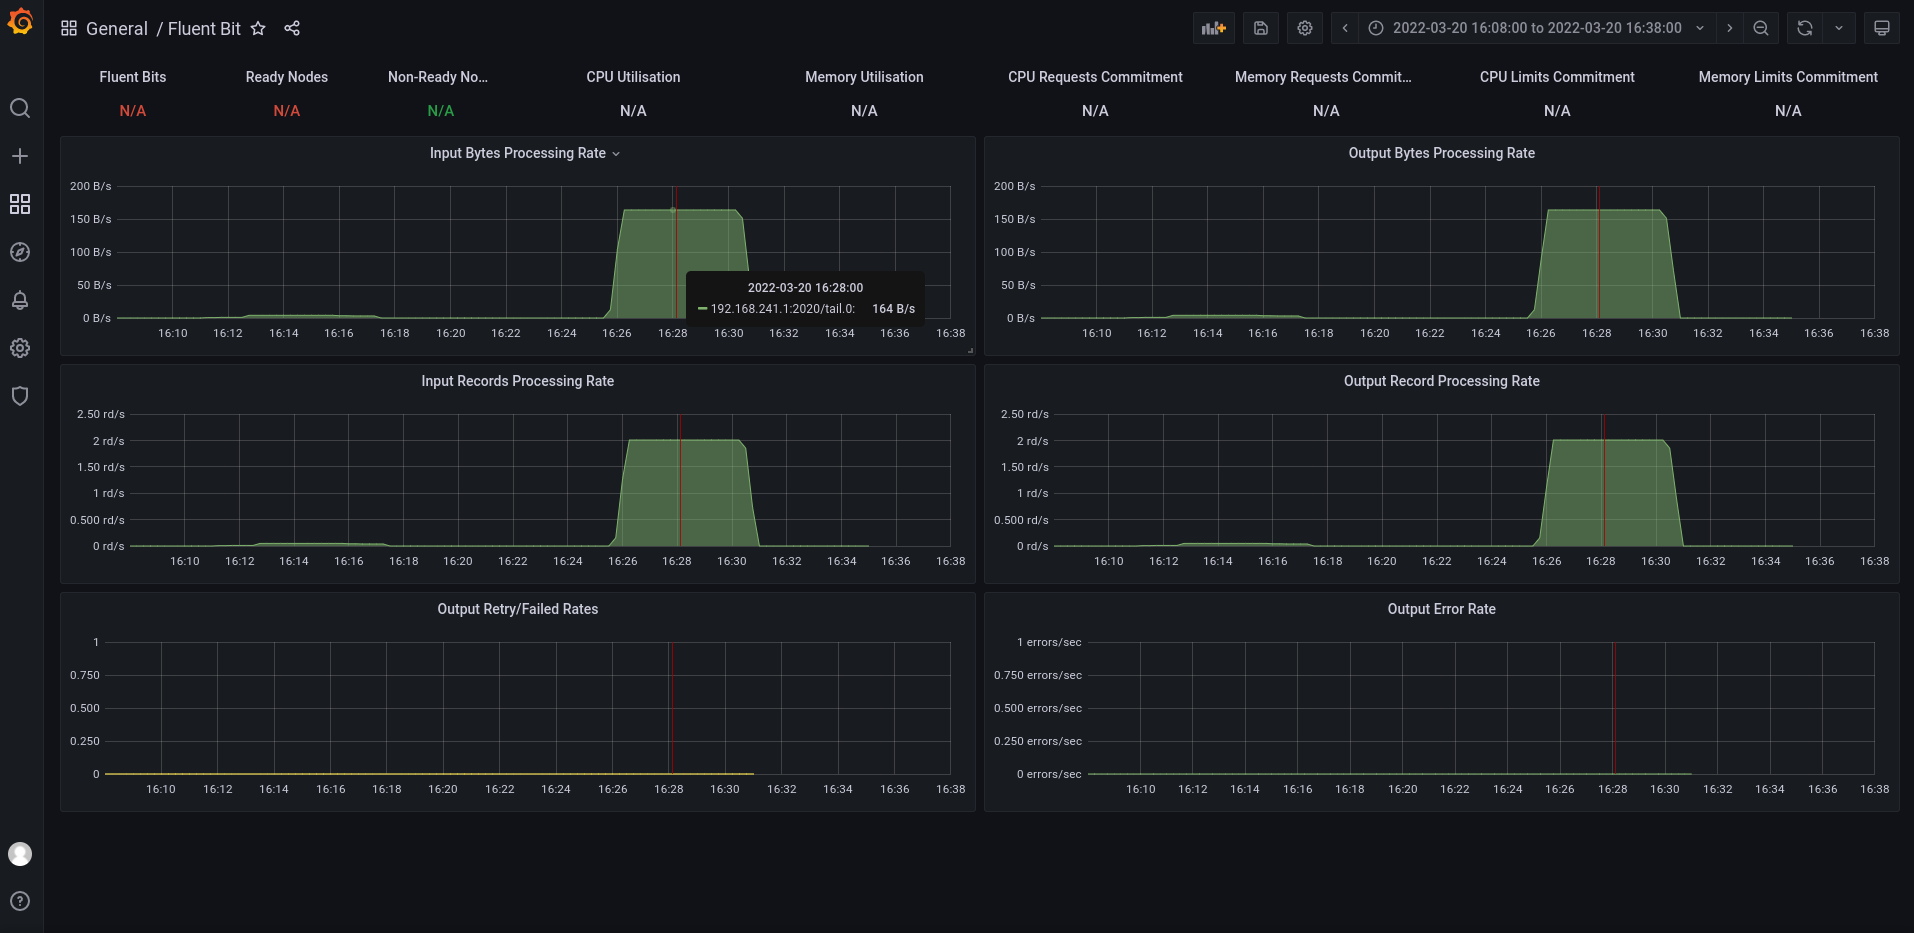
查看监控界面
输入项
输出项
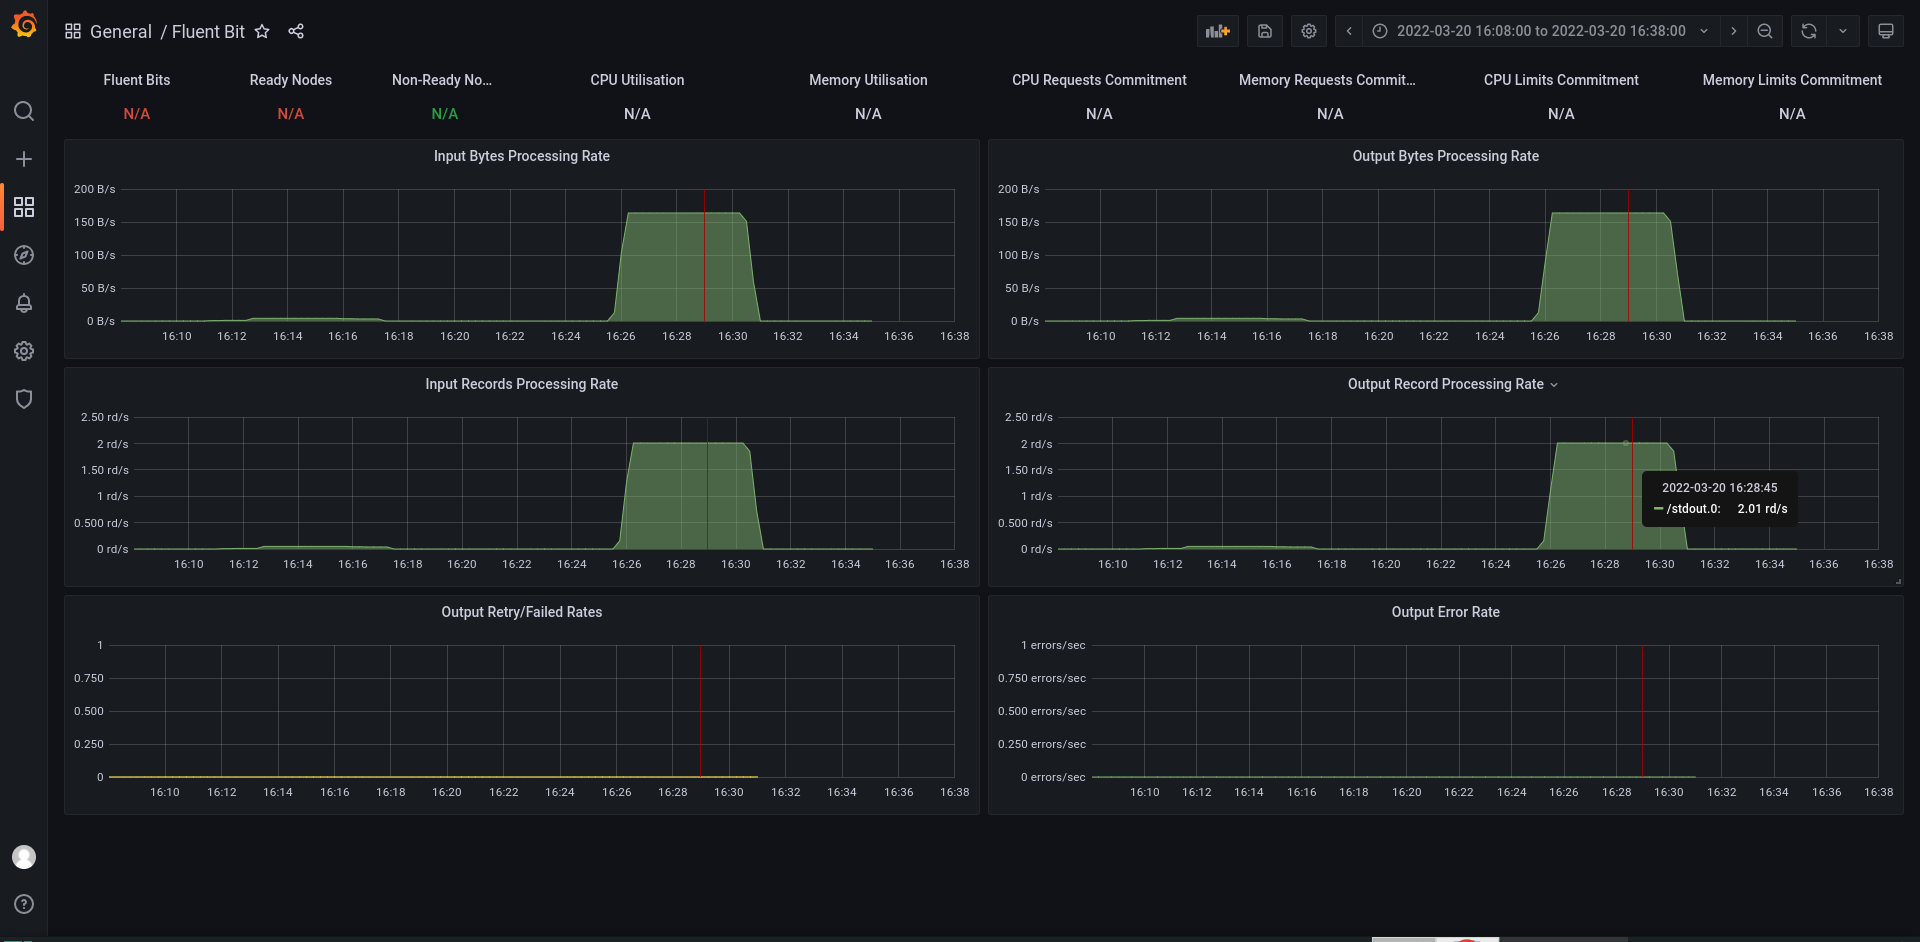
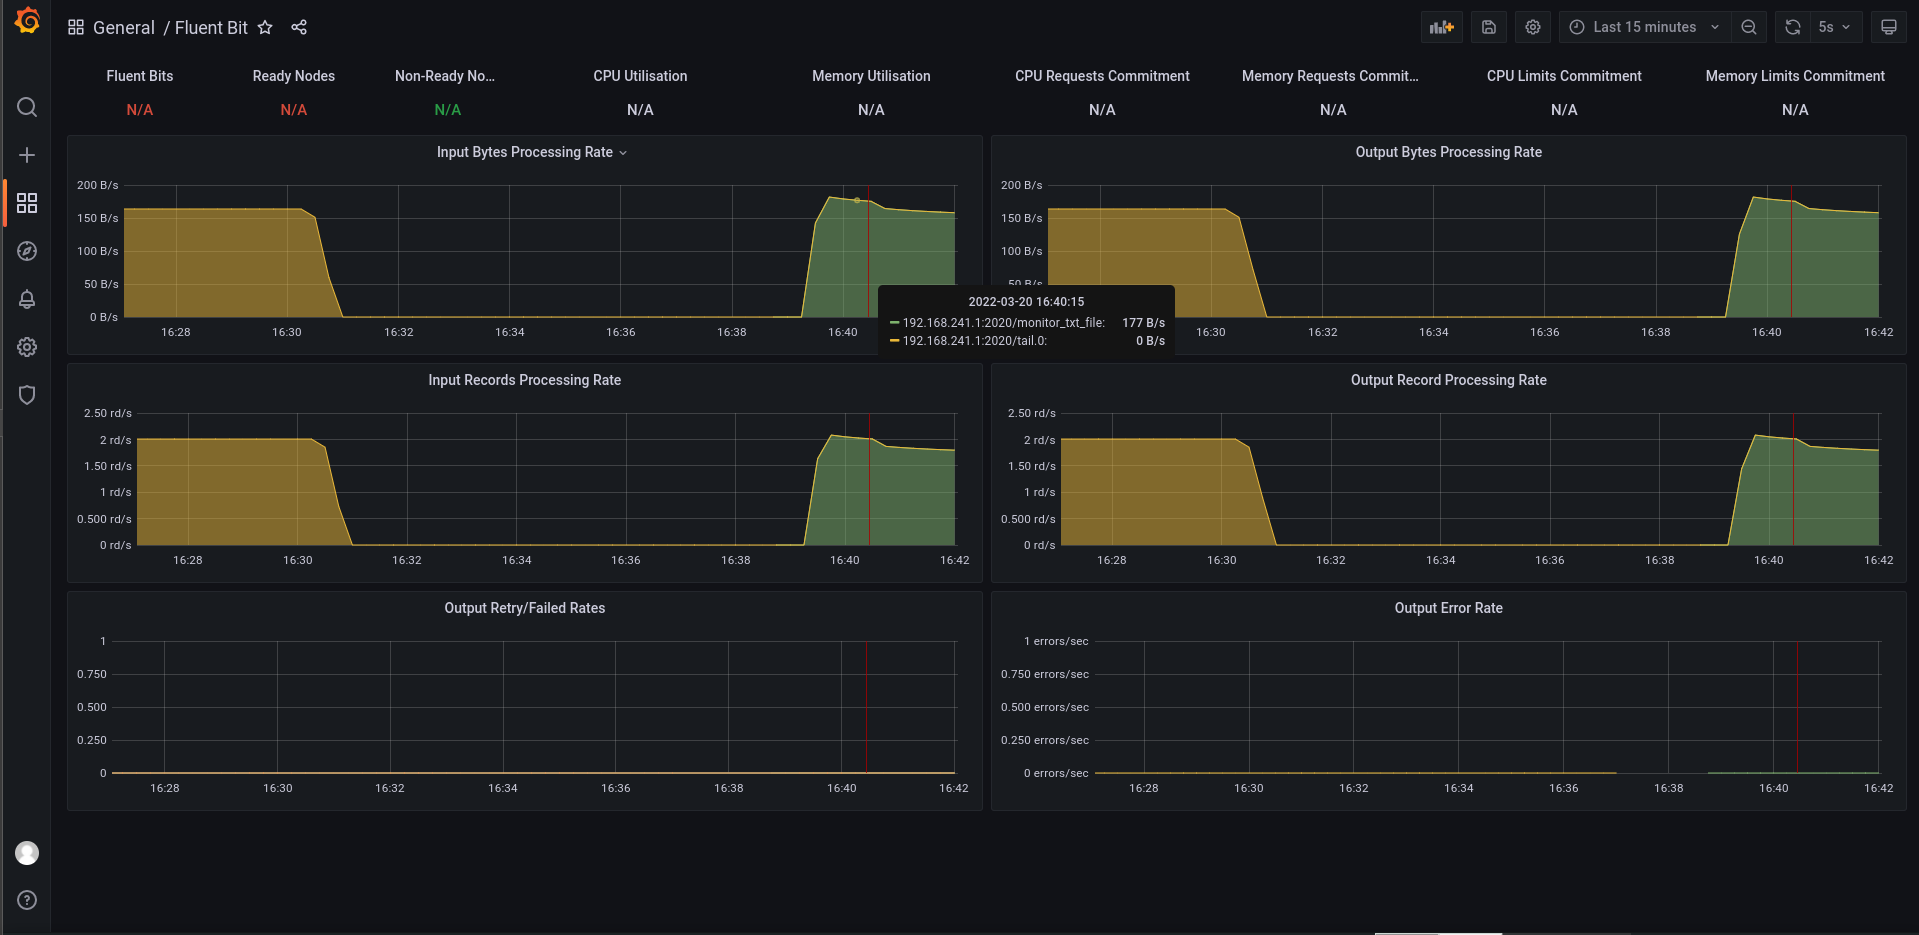
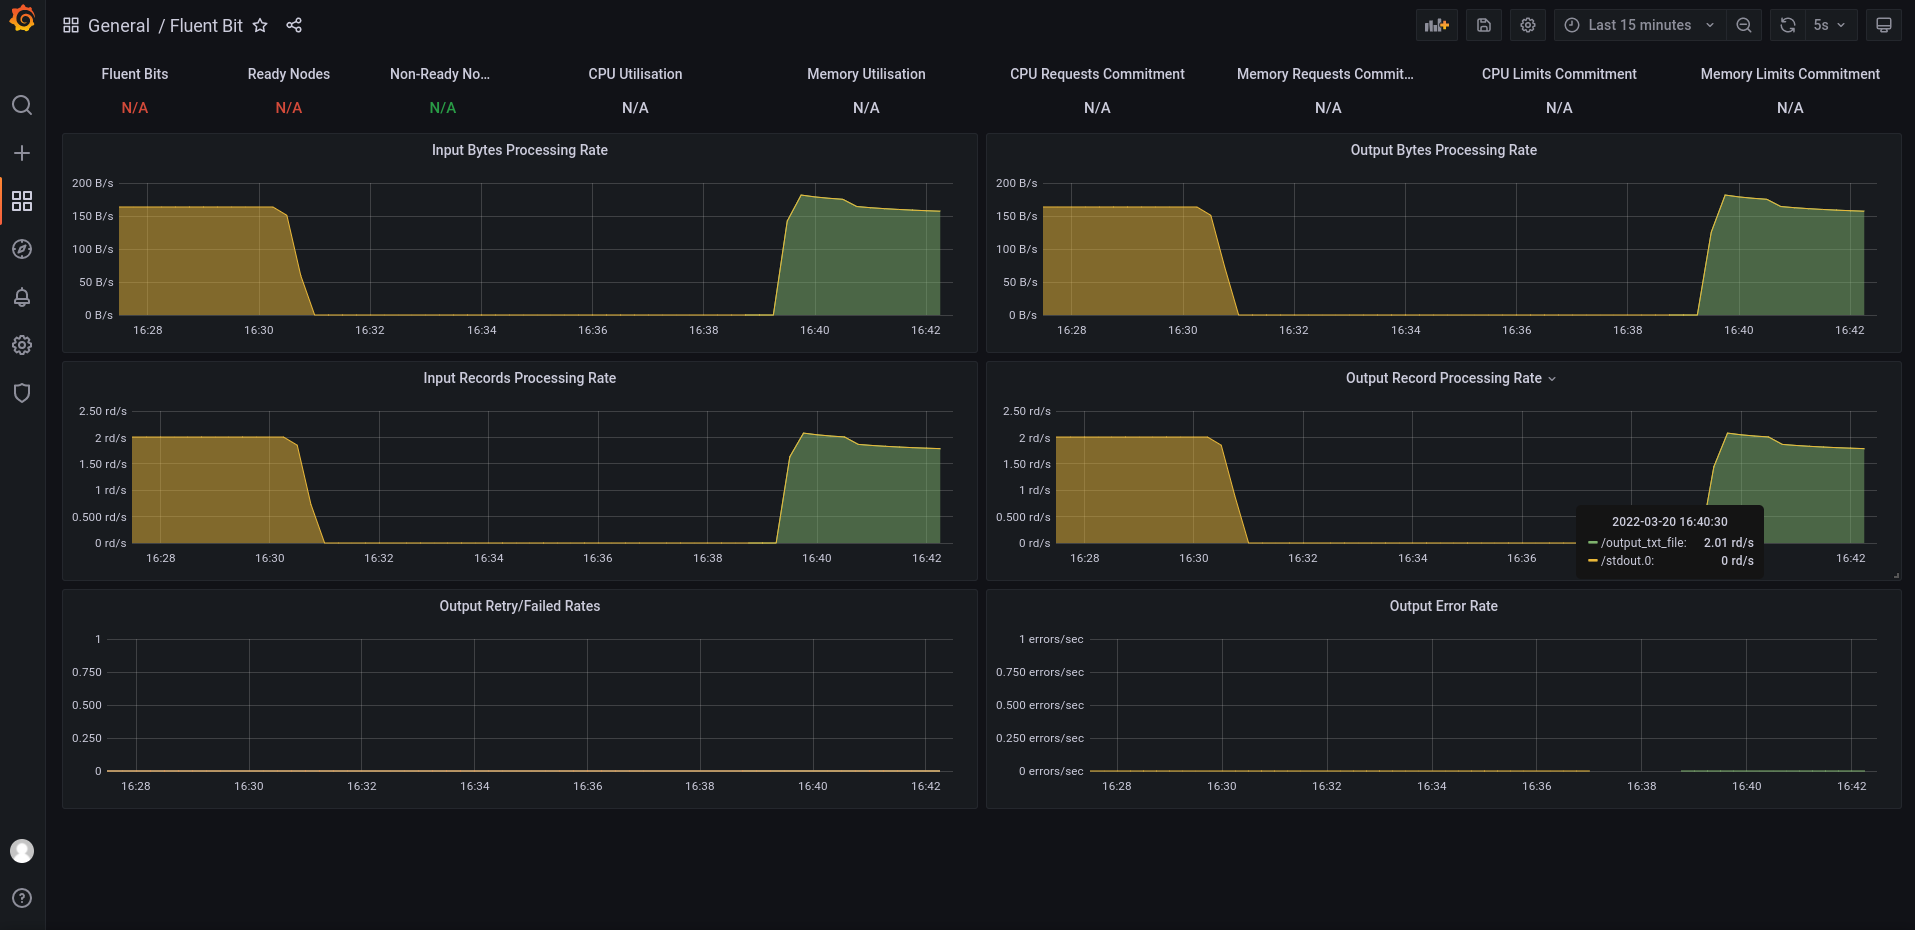
发现资源都叫 tail.0,所以根据文档,将配置文件INPUT/OUTPUT处增加两个别名,以区分可能监控到的多个配置
[INPUT]

   Name   tail

   Path   /home/etl/iSoft/fluent-bit/data/*.txt

   DB     /home/etl/iSoft/fluent-bit/db/tail.db

   Alias  monitor_txt_file

[OUTPUT]

   Name  stdout

   Match *

   Alias output_txt_file
再次查看监控界面
输入项
输出项
总结
至此,先完成初步测试,感兴趣的同学可以持续关注,后续会逐个介绍异构数据处理和发送(尽量多介绍相关组件和场景的使用)、如何使用pipline streaming的窗口SQL统计、为fluent-bit开发扩展组件等功能;
至于windows环境编译较为复杂(需要微软编译环境,我已测试过),感兴趣的同学,可以直接从github下载对应的win版本来进行测试;(我测试是OK的)
1. 使用 fluent-bit 采集文件的更多相关文章
- 大数据学习——采集文件到HDFS
采集需求:比如业务系统使用log4j生成的日志,日志内容不断增加,需要把追加到日志文件中的数据实时采集到hdfs 根据需求,首先定义以下3大要素 l 采集源,即source——监控文件内容更新 : ...
- 04_ Flume采集文件到HDFS案例
采集需求:比如业务系统使用log4j生成的日志,日志内容不断增加,需要把追加到日志文件中的数据实时采集到hdfs 根据需求,首先定义以下3大要素 采集源,即source——监控文件内容更新 : ex ...
- Flume采集目录及文件到HDFS案例
采集目录到HDFS 使用flume采集目录需要启动hdfs集群 vi spool-hdfs.conf # Name the components on this agent a1.sources = ...
- 第1节 flume:8、flume采集某个文件内容到hdfs上
2. 采集文件内容到HDFS 需求分析: 采集需求:比如业务系统使用log4j生成的日志,日志内容不断增加,需要把追加到日志文件中的数据实时采集到hdfs. 同一个日志文件的内容不断增 ...
- fluent批量处理——模型参数的设置
对于常见的工程应用来说,计算的工况很多,尤其优化工作,少则几百,多则上千,面对如此之多的case文件要写,假如按照一个一个的读写的话,相信你一定会为这么机械的工作烦躁,甚至影响今后好几天的心情,那么有 ...
- flume日志采集
1. Log4j Appender 1.1. 使用说明 1.1.2. Client端Log4j配置文件 (黄色文字为需要配置的内容) log4j.rootLogger=INFO,A1,R # C ...
- 日志采集框架Flume以及Flume的安装部署(一个分布式、可靠、和高可用的海量日志采集、聚合和传输的系统)
Flume支持众多的source和sink类型,详细手册可参考官方文档,更多source和sink组件 http://flume.apache.org/FlumeUserGuide.html Flum ...
- gambit软件license文件
最近自己的gambit软件license文件已经到期,后面采用fluent的license文件后,可以使用,但不能导入文件.不过通过努力,终于找到了可以实现导入文件的代码,并且可以实现无限期的使用fl ...
- PHP cURL实现模拟登录与采集使用方法详解教程
来源:http://www.zjmainstay.cn/php-curl 本文将通过案例,整合浏览器工具与PHP程序,教你如何让数据 唾手可得 . 对于做过数据采集的人来说,cURL一定不会陌生.虽然 ...
- 【转】iOS 自动化性能采集
前言 对于iOS总体生态是比较封闭的,相比Android没有像adb这种可以查看内存.cpu的命令.在日常做性能测试,需要借助xcode中instruments查看内存.cpu等数据. 但是借助i ...
随机推荐
- Jquery中Trigger()方法
1. $(selector).trigger(event,[param1,param2,...]) 方法触发被选元素标签的指定事件类型 为元素边赋值为true,并触发元素标签的change方法 $(' ...
- 现在入行Java真的还有出路吗?
现在入行Java还来的及吗?未来该如何抉择? 最近有点迷茫了,互联网好像一夜之间进入了寒冬一样,到处都是就业难的样子,当然,不可否认的是,那些努力的大佬依旧是斩获多个offer,但是,窝就一个小镇做题 ...
- Ubuntu安装Docker及镜像加速器
一.安装Docker sudo apt-get update && sudo apt-get install -y apt-transport-https ca-certificate ...
- Java函数式编程:三、流与函数式编程
本文是Java函数式编程的最后一篇,承接上文: Java函数式编程:一.函数式接口,lambda表达式和方法引用 Java函数式编程:二.高阶函数,闭包,函数组合以及柯里化 前面都是概念和铺垫,主要讲 ...
- The Google File System 翻译和理解
The Google File System 摘要 GFS 是一个可扩展的分布式文件系统,用于大型分布式数据密集型应用上.它可以运行在便宜的普通硬件上,提供了高性能和一定的容错性. 1. 分布式文件系 ...
- Oracle pfile与spfile文件参数(转载)
一.pfile与spfile Oracle中的参数文件是一个包含一系列参数以及参数对应值的操作系统文件.它们是在数据库实例启动时候加载的,决定了数据库的物理 结构.内存.数据库的限制及系统大量的默认值 ...
- CH58X/CH57X/V208 Observer(观察者)例程讨论讲解
使用的是沁恒的CH582M的Observer例程与官方的demo板. 本例程的功能是主机扫描到从机的MAC地址并打印出来. 先对宏定义进行理解讨论. 最大响应扫描数为8,在串口调试助手那里可以看到打印 ...
- python学习——查找计算机中的文件
# import os # # path = 'C:/Users/admin/Desktop/images' # files = os.listdir(path) # # for f in files ...
- 前端面试HTML和CSS总结,这一篇就够了!
一,面试基础 HTML和CSS ps:这俩面试答不上来的,基本就可以回去了,以下是HTML题,一般来说这地方不会出太多题,面试官也不愿意花太多时间在这上面. 1,HTML语义化,如何理解语义化? 让人 ...
- 关于deepin-wine或wine更换字体方法
前言 首先要知道,deepin-wine打包的QQ和你自己用 deepin-wine跑的windows软件,他们所在不是同一个容器 deepin打包QQ所在的容器,在你的 ~/.deepinwine ...