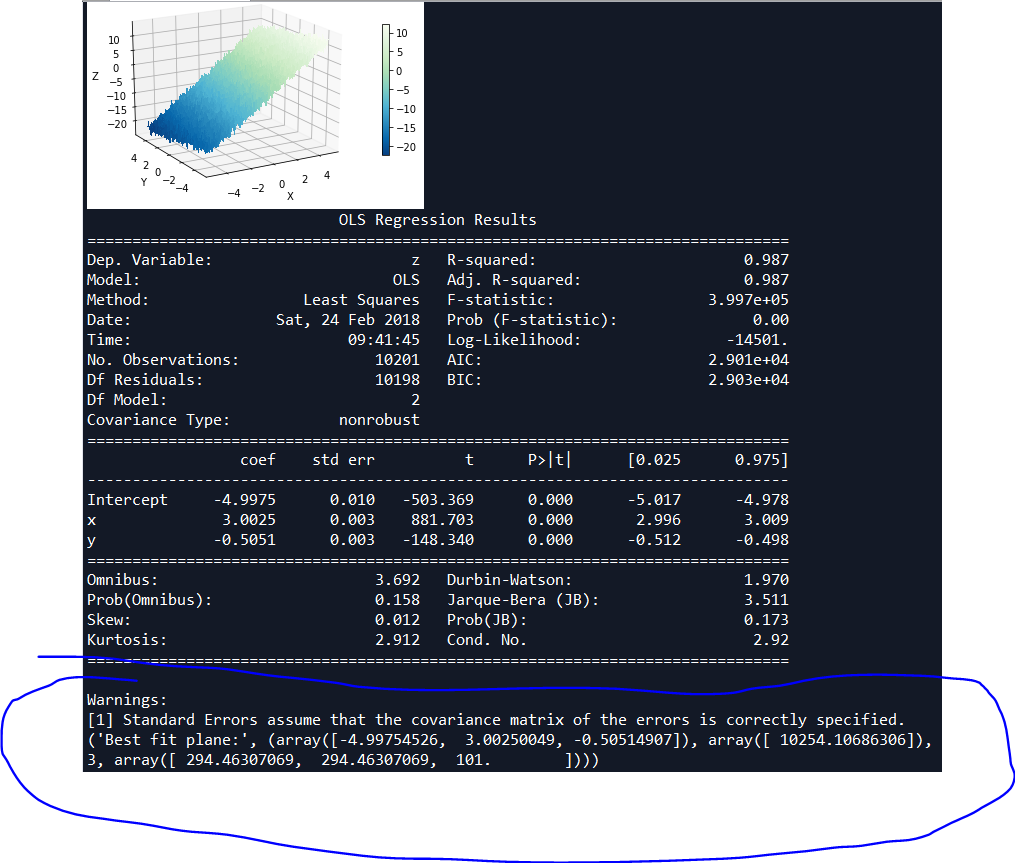
how to calculate the best fit to a plane in 3D, and how to find the corresponding statistical parameters
sklearn实战-乳腺癌细胞数据挖掘(博客主亲自录制视频教程)
https://study.163.com/course/introduction.htm?courseId=1005269003&utm_campaign=commission&utm_source=cp-400000000398149&utm_medium=share

# -*- coding: utf-8 -*-

'''

python入门/爬虫/人工智能/机器学习/自然语言/数据统计分析视频教程网址

https://pythoner.taobao.com/

https://github.com/thomas-haslwanter/statsintro_python/tree/master/ISP/Code_Quantlets/12_Multivariate/multipleRegression

Multiple Regression

- Shows how to calculate the best fit to a plane in 3D, and how to find the

  corresponding statistical parameters.

- Demonstrates how to make a 3d plot.

- Example of multiscatterplot, for visualizing correlations in three- to

  six-dimensional datasets.

'''

# Import standard packages

import numpy as np

import matplotlib.pyplot as plt

import pandas as pd

import seaborn as sns

# additional packages

import sys

import os

sys.path.append(os.path.join('..', '..', 'Utilities'))

try:

# Import formatting commands if directory "Utilities" is available

    from ISP_mystyle import showData

except ImportError:

# Ensure correct performance otherwise

    def showData(*options):

        plt.show()

        return

# additional packages ...

# ... for the 3d plot ...

from mpl_toolkits.mplot3d import Axes3D

from matplotlib import cm

# ... and for the statistic

from statsmodels.formula.api import ols

def generateData():

    ''' Generate and show the data: a plane in 3D '''

    #随机产生101个数据,取值范围从(-5到5)

    x = np.linspace(-5,5,101)

    (X,Y) = np.meshgrid(x,x)

    # To get reproducable values, I provide a seed value

    np.random.seed(987654321)

    #np.random.randn产生随机的正太分布数,np.shape(X)表示X的size(101,101)

    #np.random.randn(np.shape(X)[0], np.shape(X)[1])表示产生(101,101)个随机数

    Z = -5 + 3*X-0.5*Y+np.random.randn(np.shape(X)[0], np.shape(X)[1])

    # 绘图

    #Set the color

    myCmap = cm.GnBu_r

    # If you want a colormap from seaborn use:

    #from matplotlib.colors import ListedColormap

    #myCmap = ListedColormap(sns.color_palette("Blues", 20))

    # Plot the figure

    fig = plt.figure()

    ax = fig.gca(projection='3d')

    surf = ax.plot_surface(X,Y,Z, cmap=myCmap, rstride=2, cstride=2,

        linewidth=0, antialiased=False)

    ax.view_init(20,-120)

    ax.set_xlabel('X')

    ax.set_ylabel('Y')

    ax.set_zlabel('Z')

    fig.colorbar(surf, shrink=0.6)

    outFile = '3dSurface.png'

    showData(outFile)

    #X.flatten()把多维数据展开,弄成一维数据

    return (X.flatten(),Y.flatten(),Z.flatten())

def regressionModel(X,Y,Z):

    '''Multilinear regression model, calculating fit, P-values, confidence intervals etc.'''

    # Convert the data into a Pandas DataFrame

    df = pd.DataFrame({'x':X, 'y':Y, 'z':Z})

    # --- >>> START stats <<< ---

    # Fit the model

    model = ols("z ~ x + y", df).fit()

    # Print the summary

    print((model.summary()))

    # --- >>> STOP stats <<< ---

    return model._results.params  # should be array([-4.99754526,  3.00250049, -0.50514907])

#用numpy的线性回归模型,和上面regressionModel函数计算结果一致

def linearModel(X,Y,Z):

    '''Just fit the plane, using the tools from numpy'''

    # --- >>> START stats <<< ---

    M = np.vstack((np.ones(len(X)), X, Y)).T

    bestfit = np.linalg.lstsq(M,Z)

    # --- >>> STOP stats <<< ---

    print(('Best fit plane:', bestfit))

    return bestfit

if __name__ == '__main__':

    (X,Y,Z) = generateData()

    regressionModel(X,Y,Z)

    linearModel(X,Y,Z)
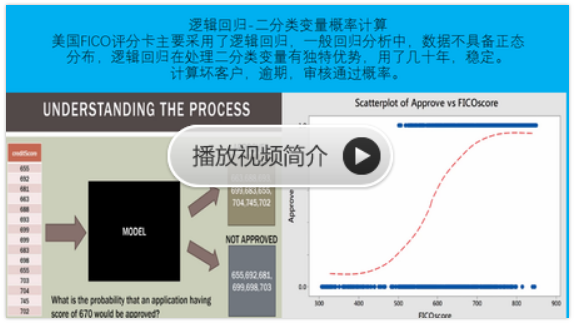
python风控评分卡建模和风控常识(博客主亲自录制视频教程)
how to calculate the best fit to a plane in 3D, and how to find the corresponding statistical parameters的更多相关文章
- (转)Markov Chain Monte Carlo
Nice R Code Punning code better since 2013 RSS Blog Archives Guides Modules About Markov Chain Monte ...
- What is an eigenvector of a covariance matrix?
What is an eigenvector of a covariance matrix? One of the most intuitive explanations of eigenvector ...
- kaggle入门项目:Titanic存亡预测(四)模型拟合
原kaggle比赛地址:https://www.kaggle.com/c/titanic 原kernel地址:A Data Science Framework: To Achieve 99% Accu ...
- Course Machine Learning Note
Machine Learning Note Introduction Introduction What is Machine Learning? Two definitions of Machine ...
- [C2P3] Andrew Ng - Machine Learning
##Advice for Applying Machine Learning Applying machine learning in practice is not always straightf ...
- AI-IBM-cognitive class --Liner Regression
Liner Regression import matplotlib.pyplot as plt import pandas as pd import pylab as pl import numpy ...
- OpenCASCADE PCurve of Topological Face
OpenCASCADE PCurve of Topological Face eryar@163.com Abstract. OpenCASCADE provides a class BRepBuil ...
- The Model Complexity Myth
The Model Complexity Myth (or, Yes You Can Fit Models With More Parameters Than Data Points) An oft- ...
- 中国澳门sinox很多平台CAD制图、PCB电路板、IC我知道了、HDL硬件描述语言叙述、电路仿真和设计软件,元素分析表
中国澳门sinox很多平台CAD制图.PCB电路板.IC我知道了.HDL硬件描述语言叙述.电路仿真和设计软件,元素分析表,可打开眼世界. 最近的研究sinox执行windows版protel,powe ...
随机推荐
- SQL语句及5.7.2 mysql 用户管理
一.用户的定义 1.1 用户名+主机域 此处为5.7.2版本的mysql当中password字段已改为authentication_string mysql> select user,host, ...
- logback基本入门
1. logback的定义 Logback是由log4j创始人设计的另一个开源日志组件,官方网站: http://logback.qos.ch.它当前分为下面下个模块: logback-core:其它 ...
- docker网络调试过程
#1: 添加永久网桥 vi /etc/sysconfig/network-scripts/ifcfg-br0 DEVICE=br0 TYPE=Bridge BOOTROTO=static IPADDR ...
- 数组操作方法(包括es5)
//push(); 定义:可以可向数组的末尾添加一个或更多元素,并返回新的长度. 方法:push(); 语法:数组.push(新元素1,新元素2,....,新元素x) 返回值:把指定的值添加到数组后的 ...
- [转帖]Asp.Net MVC EF各版本区别
Asp.Net MVC EF各版本区别 https://www.cnblogs.com/liangxiaofeng/p/5840754.html 2009年發行ASP.NET MVC 1.0版 201 ...
- python2.7.x的字符串编码到底什么鬼?(中文和英文的处理)
一直以来我其实一直对python的编码弄得非常晕,能正常编码,也能处理一些情况.但是始终不明白有些问题究竟为何出,原因是什么,为什么要这样用. 今天晚上正好好好研究了一番解答了自己心中的困惑. Q:p ...
- python代码格式检查工具部署pre_commit
如何使用pre_commit?1. 合并该分支 2. 在git根目录下使用pre-commit install即可3. 如果没有装pre-commit 安装一下pip install pre-comm ...
- Python中print/format字符串格式化实例
Python 字符串格式化使用 "字符 %格式1 %格式2 字符"%(变量1,变量2),%格式表示接受变量的类型.简单的使用例子如下 # 例:字符串格式化Name = '17jo' ...
- Mysql 悲观锁
转载:http://chenzhou123520.iteye.com/blog/1860954 悲观锁介绍: 悲观锁,正如其名,它指的是对数据被外界(包括本系统当前的其他事务,以及来自外部系统的事务处 ...
- 【转】Caffe的solver文件配置
http://blog.csdn.net/czp0322/article/details/52161759 solver.prototxt 今天在做FCN实验的时候,发现solver.prototxt ...