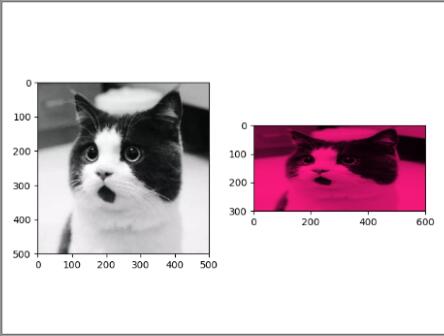
matplotlib 显示两张图片,折线图 和 scipy
显示两张图片的代码:
import numpy as np

from scipy.misc import imread, imsave, imresize

import matplotlib.pyplot as plt

img = imread('cat.jpg')

print(img.dtype, img.shape)  # uint8 (500, 500, 3)

img_tinted = img * [1, 0.1, 0.5]  # RGB

img_tinted = imresize(img_tinted, (300, 600))

imsave('cat_tinted.jpg', img_tinted)

plt.subplot(1, 2, 1)

plt.imshow(img)

plt.subplot(1, 2, 2)

plt.imshow(img_tinted)

plt.show()
显示结果:
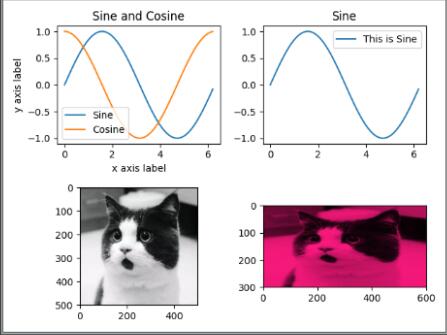
显示四张图片的代码:
x = np.arange(0, 2 * np.pi, 0.1)

y_sin = np.sin(x)

y_cos = np.cos(x)

plt.subplot(2, 2, 1)

plt.plot(x, y_sin)

plt.plot(x, y_cos)

plt.xlabel('x axis label')

plt.ylabel('y axis label')

plt.title('Sine and Cosine')

plt.legend(['Sine', 'Cosine'])

plt.subplot(2, 2, 2)

plt.plot(x, y_sin)

plt.title('Sine')

plt.legend(['This is Sine'])

# img = imread('cat.jpg')

plt.subplot(2, 2, 3)

plt.imshow(img)

plt.subplot(2, 2, 4)

plt.imshow(np.uint8(img_tinted))

plt.show()
显示结果:
计算任意两点间的欧氏距离
from scipy.spatial.distance import pdist, squareform

x= np.array([[0, 1], [1, 0], [2, 0]])

d= squareform(pdist(x, 'euclidean'))

print(d)
[[0. 1.41421356 2.23606798]
[1.41421356 0. 1. ]
[2.23606798 1. 0. ]]
matplotlib 显示两张图片,折线图 和 scipy的更多相关文章
- 3-Highcharts曲线图之显示点值折线图
直接上代码 根据代码注释讲解 <!DOCTYPE> <html lang='en'> <head> <title>3-Highcharts曲线图之显示 ...
- Matplotlib基本图形之折线图
Matplotlib基本图形之折线图折线图特点 折线图是用折线将各数据连起来组成的图形常用来观察数据随时间变化的趋势例如:股票价格,温度变化,等等 示例代码: import os import tim ...
- 【学习总结】GirlsInAI ML-diary day-21-初识 Numpy, Matplotlib, Seanborn [柱状图、折线图、箱图]
[学习总结]GirlsInAI ML-diary 总 原博github链接-day21 初识 Numpy, Matplotlib, Seanborn [柱状图.折线图.箱图] 一.Titanic练习赛 ...
- python中matplotlib绘图封装类之折线图、条状图、圆饼图
DrawHelper.py封装类源码: import matplotlib import matplotlib.pyplot as plt import numpy as np class DrawH ...
- echarts在数据改变后,折线图并没有全部刷新
在做一个BI项目的时候,图表需要区分国内和国外显示.当前用户所属企业具备国内外权限的时候,展示两条图表,当查看其他企业需要根据选中的企业所具备的权限改变图表.即刚开始显示两条折线图,更改选择条件并重新 ...
- react-echarts之折线图的显示
react中想要实现折线图和饼图的功能,需要引入react-echarts包,然后再实现折线图的功能.我这里引用的版本是:0.1.1.其他的写法参echarts官网即可.下面详细讲解的是我在react ...
- ECharts折线图多个折线每次只显示一条
echart 两条折线图如何默认只显示一条,另一条隐藏呢 只需要在legend后加上, selectedMode: 'single', selectedMode [ default: true ] 图 ...
- Python_散点图与折线图绘制
在数据分析的过程中,经常需要将数据可视化,目前常使用的:散点图 折线图 需要import的外部包 一个是绘图 一个是字体导入 import matplotlib.pyplot as plt fro ...
- IOS使用Core-Plot画折线图
关于Core-Plot的配置.大家能够參考我的上一篇博客:http://1.wildcat.sinaapp.com/?p=99 版权全部.转载请注明原文转自:http://blog.csdn.net/ ...
随机推荐
- [Cypress] Wait for XHR Responses in a Cypress Test
When testing interactions that require asynchronous calls, we’ll need to wait on responses to make s ...
- android制作闪动的红心
先上一张效果图吧: 说说这个东西的来源吧.今天突然想到笛卡尔心形图,想去看看能不能画个心出来,可是看到一篇不错的文章,那篇文章罗列了非常多关于心形的函数方程,这可把我高兴坏了,于是我选取了一个比較好看 ...
- Memcache 和 Radis 比较
Memcache 和 Radis 比较 2014-03-28 11:00 2447人阅读 评论(0) 收藏 举报 分类: memcache(6) Redis(7) 版权声明:本文为博主原创文章, ...
- LeetCode 5_Longest Palindromic Substring
LeetCode 5_Longest Palindromic Substring 题目描写叙述: Given a string S, find the longest palindromic sub ...
- 一个站点的诞生02--用Scrapy抓取数据
假设想抓数据,就须要有爬虫程序,业内叫crawler或者spider. 有各种语言版本号的开源爬虫.c++, Java, php,在github上搜一下,以"spider c++" ...
- YII用户注冊和用户登录(三)之模型中规则制定和分析
3 模型中规则制定和分析 YII模型主要分为两类,一个数据模型,处理和数据库相关的增删改查.继承CActiveRecord.还有一个是表单模型,继承CFormModel.不与数据库进行交互.操作与数据 ...
- luogu3799 妖梦拼木棒
题目大意 有n根木棒,现在从中选4根,想要组成一个正三角形,问有几种选法?木棒长度都<=5000. 题解 根据容斥原理,三角形两条边分别由长度相等的单根木棒组成,另一条边由两条小于该边长的木棒构 ...
- luogu2014 选课 背包类树形DP
题目大意:有N门功课,每门课有个学分,每门课有一门或没有直接先修课(若课程a是课程b的先修课即只有学完了课程a,才能学习课程b).一个学生要从这些课程里选择M门课程学习,问他能获得的最大学分是多少? ...
- bzoj2819: Nim(博弈+树剖)
2819: Nim 题目:传送门 题解: 很久之前学博弈的时候看过的一道水题,其实算不上博弈吧... 直接套上一个裸的树剖啊,把路径上的点值全都xor(xor满足结合率所以就不管那么多随便搞啦) do ...
- 让git for windows记住密码
store 执行这个命令git config --global credential.helper store 检查命令是否成功 $ git config -l | grep credentialcr ...