
ELK学习实验019:ELK使用redis缓存
1 安装一个redis服务
[root@node4 ~]# yum -y install redis
直接启动
[root@node4 ~]# systemctl restart redis
[root@node4 ~]# systemctl status redis

[root@node4 ~]# redis-cli -h 127.0.0.1

2 配置filebeat,把数据传给redis
[root@node4 ~]# vim /etc/filebeat/filebeat.yml
filebeat.inputs:

#####################################################

## Nginx log

#####################################################

- type: log

  enabled: true

  paths:

    - /usr/local/nginx/logs/access.log

  json.key_under_root: true

  json.overwrite_keys: true

  tags: ["access"]

#- type: log

#  enabled: true

#  paths:

#    - /usr/local/nginx/logs/error.log

#  tags: ["error"]

#####################################################

## tomcat  log

#####################################################

- type: log

  enabled: true

  paths:

    - /var/log/tomcat/localhost_access_log.*.txt

  json.key_under_root: true

  json.overwrite_keys: true

  tags: ["tomcat"]

#####################################################

## java  log

#####################################################

- type: log

  enabled: true

  paths:

    - /usr/local/elasticsearch/logs/my-elktest-cluster.log

  tags: ["es-java"]

multiline.pattern: '^\['

  multiline.negate: true

  multiline.match: "after"

#####################################################

## docker  log

#####################################################

- type: docker

  containers.ids:

    - '*'

  json.key_under_root: true

  json.overwrite_keys: true

  tags: ["docker"]

#####################################################

## outout redis

#####################################################

output.redis:

  hosts: ["127.0.0.1"]

  key: "filebeat"

  db: 0

  timeout: 5
[root@node4 ~]# systemctl restart filebeat
访问产生日志
3 查看redis
127.0.0.1:6379> keys *

1) "filebeat"

127.0.0.1:6379>

127.0.0.1:6379> keys *

1) "filebeat"

127.0.0.1:6379> type filebeat         #查看类型

list

127.0.0.1:6379> llen filebeat         #查看长度

(integer) 22

127.0.0.1:6379> LRANGE filebeat 1 22

 1) "{\"@timestamp\":\"2020-01-20T14:22:15.291Z\",\"@metadata\":{\"beat\":\"filebeat\",\"type\":\"_doc\",\"version\":\"7.4.2\"},\"agent\":{\"hostname\":\"node4\",\"id\":\"bb3818f9-66e2-4eb2-8f0c-3f35b543e025\",\"version\":\"7.4.2\",\"type\":\"filebeat\",\"ephemeral_id\":\"663027a7-1bdc-4a9f-b9d3-1297ef06c0b0\"},\"log\":{\"offset\":21185,\"file\":{\"path\":\"/usr/local/nginx/logs/error.log\"}},\"message\":\"2020/01/20 09:22:08 [error] 2790#0: *32 open() \\\"/usr/local/nginx/html/favicon.ico\\\" failed (2: No such file or directory), client: 192.168.132.1, server: localhost, request: \\\"GET /favicon.ico HTTP/1.1\\\", host: \\\"192.168.132.134\\\", referrer: \\\"http://192.168.132.134/\\\"\",\"tags\":[\"error\"],\"input\":{\"type\":\"log\"},\"ecs\":{\"version\":\"1.1.0\"},\"host\":{\"name\":\"node4\"}}"
使用json解析
{

    "@timestamp": "2020-01-20T14:22:15.293Z",

    "@metadata": {

        "beat": "filebeat",

        "type": "_doc",

        "version": "7.4.2"

    },

    "log": {

        "offset": 21460,

        "file": {

            "path": "/usr/local/nginx/logs/access.log"

        }

    },

    "json": {

        "size": 612,

        "xff": "-",

        "upstreamhost": "-",

        "url": "/index.html",

        "domain": "192.168.132.134",

        "upstreamtime": "-",

        "@timestamp": "2020-01-20T09:22:08-05:00",

        "clientip": "192.168.132.1",

        "host": "192.168.132.134",

        "status": "200",

        "http_host": "192.168.132.134",

        "Agent": "Mozilla/5.0 (Windows NT 10.0; Win64; x64) AppleWebKit/537.36 (KHTML, like Gecko) Chrome/79.0.3945.117 Safari/537.36",

        "responsetime": 0,

        "referer": "-"

    },

    "tags": ["access"],

    "input": {

        "type": "log"

    },

    "ecs": {

        "version": "1.1.0"

    },

    "host": {

        "name": "node4"

    },

    "agent": {

        "id": "bb3818f9-66e2-4eb2-8f0c-3f35b543e025",

        "version": "7.4.2",

        "type": "filebeat",

        "ephemeral_id": "663027a7-1bdc-4a9f-b9d3-1297ef06c0b0",

        "hostname": "node4"

    }

}
4 使用logstash收集消费resdis的数据
再node4节点安装logstash
[root@node4 ~]# wget https://artifacts.elastic.co/downloads/logstash/logstash-7.5.1.rpm
[root@node4 ~]# rpm -ivh logstash-7.5.1.rpm
[root@node4 ~]# vim /etc/logstash/conf.d/logsatsh.conf
input {

  redis {

    host => "127.0.0.1"

    port => "6379"

    db => "0"

    key => "filebeat"

    data_type => "list"

  }

}

filter{

  mutate {

    convert => ["upstream_time","float"]

    convert => ["request_time","float"]

  }

}

output{

  stdout {}

    elasticsearch {

      hosts => "192.168.132.131:9200"

      manage_template => false

      index => "nginx_access-%{+yyyy.MM.dd}"

  }

}
[root@node4 ~]# /usr/share/logstash/bin/logstash -f /etc/logstash/conf.d/logsatsh.conf
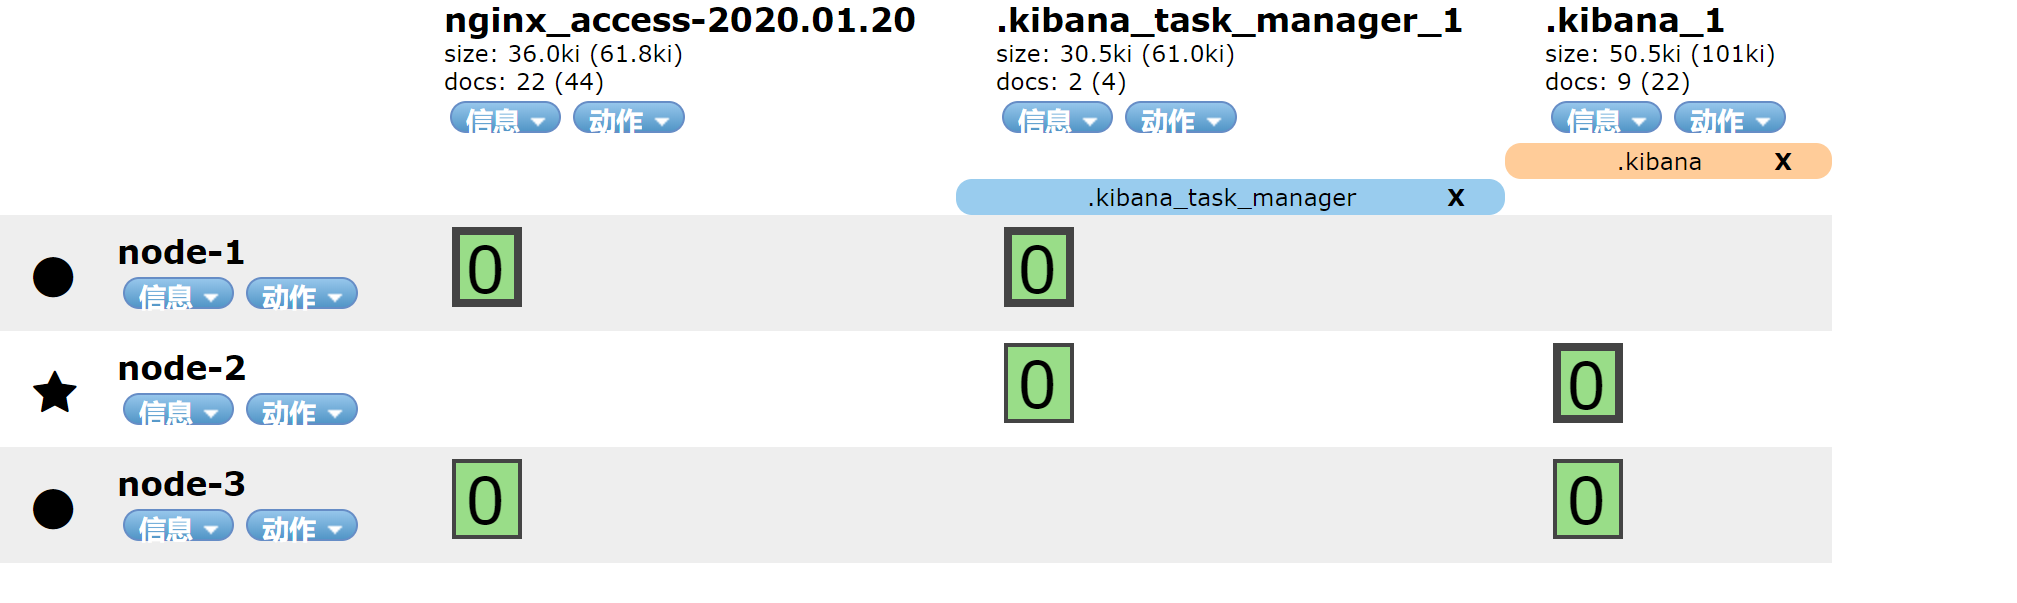
已经有索引
访问
[root@node5 ~]# ab -n 20000 -c 20 http://192.168.132.134
查看redis
127.0.0.1:6379> keys *

(empty list or set)

127.0.0.1:6379> keys *

1) "filebeat"

127.0.0.1:6379> LLEN filebeat

(integer) 16875

127.0.0.1:6379> LLEN filebeat

(integer) 16000

127.0.0.1:6379> LLEN filebeat

(integer) 15125

127.0.0.1:6379> LLEN filebeat

(integer) 14375

127.0.0.1:6379> LLEN filebeat

(integer) 13625

127.0.0.1:6379> LLEN filebeat

(integer) 13000

127.0.0.1:6379> LLEN filebeat

(integer) 12375
使用kibana查看
{

  "_index": "nginx_access-2020.01.20",

  "_type": "_doc",

  "_id": "A1J-w28BOF7DoSFdyQr8",

  "_version": 1,

  "_score": null,

  "_source": {

    "host": {

      "name": "node4"

    },

    "tags": [

      "access"

    ],

    "input": {

      "type": "log"

    },

    "ecs": {

      "version": "1.1.0"

    },

    "log": {

      "file": {

        "path": "/usr/local/nginx/logs/access.log"

      },

      "offset": 12386215

    },

    "json": {

      "host": "192.168.132.134",

      "upstreamtime": "-",

      "xff": "-",

      "status": "200",

      "referer": "-",

      "http_host": "192.168.132.134",

      "Agent": "ApacheBench/2.3",

      "url": "/index.html",

      "responsetime": 0,

      "domain": "192.168.132.134",

      "size": 612,

      "clientip": "192.168.132.135",

      "upstreamhost": "-",

      "@timestamp": "2020-01-20T10:07:11-05:00"

    },

    "agent": {

      "hostname": "node4",

      "id": "bb3818f9-66e2-4eb2-8f0c-3f35b543e025",

      "type": "filebeat",

      "ephemeral_id": "efddca40-1d19-4036-9724-410b1b6d4c8b",

      "version": "7.4.2"

    },

    "@version": "1",

    "@timestamp": "2020-01-20T15:07:16.439Z"

  },

  "fields": {

    "json.@timestamp": [

      "2020-01-20T15:07:11.000Z"

    ],

    "@timestamp": [

      "2020-01-20T15:07:16.439Z"

    ]

  },

  "sort": [

    1579532836439

  ]

}
5 filebeat添加错误日志
- type: log

  enabled: true

  paths:

    - /usr/local/nginx/logs/error.log

  tags: ["error"]

output.redis:

hosts: ["127.0.0.1"]

keys:

- key: "nginx_access"

when.contains:

tags: "access"

- key: "nginx_error"

when.contains:

tags: "error"
访问的错误日志
[root@node5 ~]# ab -n 20000 -c 200 http://192.168.132.134/hehe
127.0.0.1:6379> keys *

1) "nginx_error"

2) "nginx_access"
6 有两个key,配置logstash
[root@node4 ~]# cat /etc/logstash/conf.d/logsatsh.conf
input {

  redis {

    host => "127.0.0.1"

    port => "6379"

    db => "0"

    key => "nginx_access"

    data_type => "list"

  }

  redis {

    host => "127.0.0.1"

    port => "6379"

    db => "0"

    key => "nginx_error"

    data_type => "list"

  }

}

filter{

  mutate {

    convert => ["upstream_time","float"]

    convert => ["request_time","float"]

  }

}

output{

  stdout {}

  if "access" in [tags]{

    elasticsearch {

      hosts => "192.168.132.131:9200"

      manage_template => false

      index => "nginx_access-%{+yyyy.MM.dd}"

    }

  }

  if "error" in [tags]{

    elasticsearch {

      hosts => "192.168.132.131:9200"

      manage_template => false

      index => "nginx_error-%{+yyyy.MM.dd}"

    }

  }
}
[root@node4 ~]# /usr/share/logstash/bin/logstash -f /etc/logstash/conf.d/logsatsh.conf
7 启动后,redis被消费
127.0.0.1:6379> keys *

1) "nginx_error"

2) "nginx_access"

127.0.0.1:6379> LLEN nginx_error

(integer) 20000

127.0.0.1:6379> LLEN nginx_error

(integer) 20000

127.0.0.1:6379> LLEN nginx_error

(integer) 20000

127.0.0.1:6379> LLEN nginx_error

(integer) 20000

127.0.0.1:6379> LLEN nginx_error

(integer) 16125

127.0.0.1:6379> LLEN nginx_error

(integer) 15750

127.0.0.1:6379> LLEN nginx_access

(integer) 14625

127.0.0.1:6379> LLEN nginx_access

(integer) 14375

127.0.0.1:6379> LLEN nginx_error

(integer) 14000

127.0.0.1:6379> LLEN nginx_error
查看索引
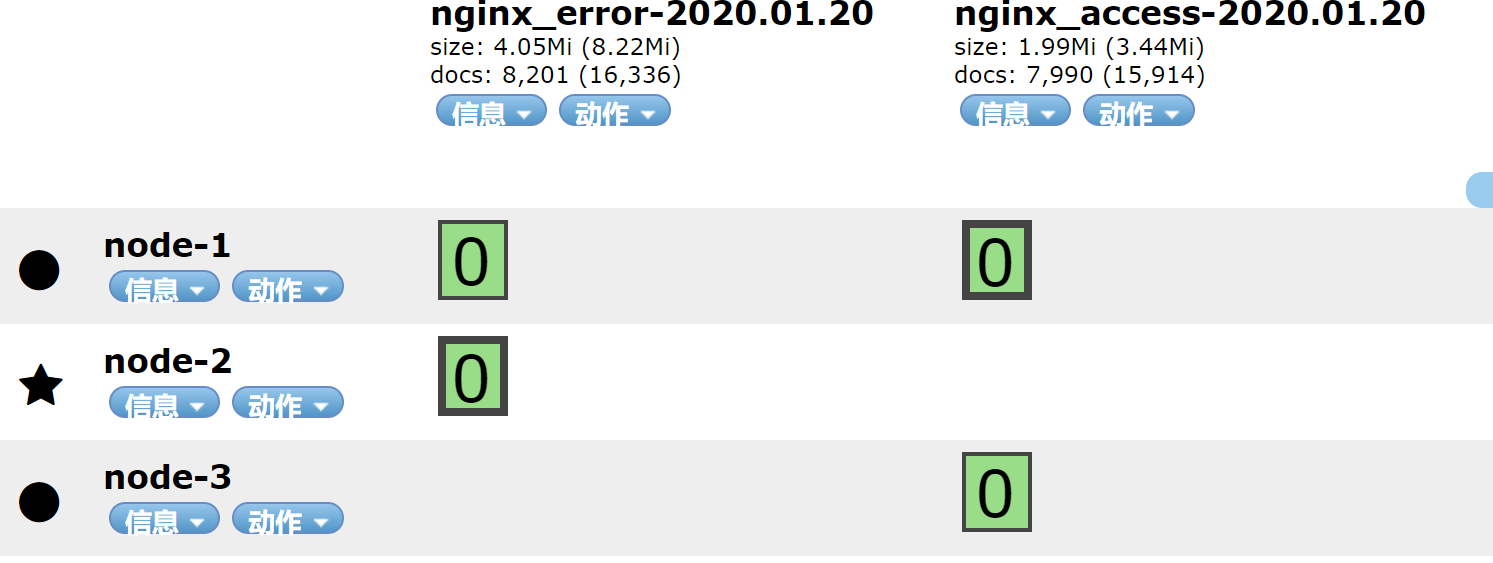
8 优化配置
通过上面的传输,logstah重视通过tags来区分日志,所以再logstash的input中可以不配置两个key,只需要配置一个key即可
[root@node4 ~]# vim /etc/logstash/conf.d/logsatsh.conf
input {

  redis {

    host => "127.0.0.1"

    port => "6379"

    db => "0"

    key => "nginx"

    data_type => "list"

  }

}

filter{

  mutate {

    convert => ["upstream_time","float"]

    convert => ["request_time","float"]

  }

}

output{

  stdout {}

  if "access" in [tags]{

    elasticsearch {

      hosts => "192.168.132.131:9200"

      manage_template => false

      index => "nginx_access-%{+yyyy.MM.dd}"

    }

  }

  if "error" in [tags]{

    elasticsearch {

      hosts => "192.168.132.131:9200"

      manage_template => false

      index => "nginx_error-%{+yyyy.MM.dd}"

    }

  }

}
filebeat配置
#####################################################

## outout redis

#####################################################

output.redis:

  hosts: ["127.0.0.1"]

  keys: "nginx"
[root@node4 ~]# systemctl restart filebeat
[root@node4 ~]# /usr/share/logstash/bin/logstash -f /etc/logstash/conf.d/logsatsh.conf
访问生成日志
[root@node5 ~]# ab -n 20000 -c 200 http://192.168.132.134/hehe
查看redis
127.0.0.1:6379> keys *

1) "nginx"

127.0.0.1:6379> LLEN nginx

(integer) 20125

127.0.0.1:6379> LLEN nginx

(integer) 19625

127.0.0.1:6379> LLEN nginx

(integer) 18250

127.0.0.1:6379> LLEN nginx

(integer) 17500

127.0.0.1:6379> LLEN nginx

(integer) 16750

127.0.0.1:6379> LLEN nginx

(integer) 0
查看索引

索引生成,实验完成
ELK学习实验019:ELK使用redis缓存的更多相关文章
- ELK学习实验014:Nginx日志JSON格式收集
1 Kibana的显示配置 https://demo.elastic.co/app/kibana#/dashboard/welcome_dashboard 环境先处理干净 安装nginx和httpd- ...
- ELK学习实验020:ELK使用kafka缓存
首先安装一个kafka集群,但是zookeeper使用单节点,可以让kafka快速跑起来,后续再研究kafka和zokkeeper的集群 1 安装Kafka集群 下面是三个节点都要做 [root@no ...
- ELK学习实验013:ELK的一个完整的配置操作
前面做了关于ELK组件的各个实验,但是并没有真正的把各个组件结合起来做一个实验,现在使用一个脚本简单的生成日志,模拟生产不断产生日志的效果 一 流程说明 使用脚本产生日志,模拟用户的操作 日志的格式 ...
- ELK学习实验002:Elasticsearch介绍及单机安装
一 简介 ElasticSearch是一个基于Luncene的搜索服务器.它提供了一个分布式多用户能力全文搜索引擎,基于RESTful web接口,ElsticSearch使用Java开发的,并作为A ...
- ELK学习实验005:beats的一些工具介绍
一 背景需求 Nginx是一个非常优秀的web服务器,往往Nginx服务会作为项目的访问入口,那么,nginx的性能保障就会变得非常重要,如果nginx的运行出现了问题就会对项目有较大的影响,所以,我 ...
- ELK学习实验001:Elastic Stack简介
1 背景介绍 在我们日常生活中,我们经常需要回顾以前发生的一些事情:或者,当出现了一些问题的时候,可以从某些地方去查找原因,寻找发生问题的痕迹.无可避免需要用到文字的.图像的等等不同形式的记录.用计算 ...
- ELK学习实验012:Logstash的安装和使用
一 logstash安装 1.1下载包 [root@node1 ~]# cd /usr/local/src/ [root@node1 src]# wget https://artifacts.elas ...
- ELK学习实验011:Logstash工作原理
Logstash事件处理管道包括三个阶段:输入→过滤器→输出.输入会生成事件,过滤器会对其进行修改,输出会将它们发送到其他地方.输入和输出支持编解码器,使您可以在数据进入或退出管道时对其进行编码或解码 ...
- ELK学习实验008:Kibana的介绍
一 简介 Kiana是一款开源的数据分析和可视化平台,它是 Elastic Stack成员之一,设计用于和 Elasticsearch协作.您可以使用 Kiana对 Elasticsearch索引中的 ...
随机推荐
- 这样介绍Ribbon,从此任何问题也难不住你
Springcloud的核心组件之Ribbon 上篇文章详细介绍了springcloud的注册中心Eureka,那么这篇文章则会介绍springcloud的另外一个组件Spring Cloud Rib ...
- 四、python学习-正则表达式
正则表达式 import re lst = re.findall(正则表达式,需要匹配的字符串) findall 把所有匹配到的字符串都搜出来,返回列表 不能把分组内容和匹配内容同时显示出来 sear ...
- ansible:playbook详解
Blog:博客园 个人 概述 playbook是由一个或者多个play组成的列表. 主要功能是将预定义的一组主机装扮成事先通过ansible中的task定义好的角色.task实际是调用ansible的 ...
- 【笔记】《Redis设计与实现》chapter19 事务
chapter19 事务 Redis通过MULTI.EXEC.WATCH等命令来实现事务功能 19.1 事务的实现 事务开始 redis> MULTI ok 通过切换客户端状态的flag属性的R ...
- java面试一日一题:java的类加载过程
问题:请讲下java的类加载机制及过程 分析:该问题主要考察对JVM加载类的机制及过程,延申出的问题是为什么使用双亲委托模型,有什么办法可以打破双亲委托吗: 回答要点: 主要从以下几点去考虑, 1.类 ...
- WinForm只运行运行一个实例(单开)
using System; using System.Diagnostics; using System.Runtime.InteropServices; using System.Windows.F ...
- 假如kubernetes不支持docker了该怎么办
假如kubernetes不支持docker了该怎么办 从官网安装文档可以看到kubernetes支持一下几种: https://kubernetes.io/docs/setup/production- ...
- LinqToObject和LinqToSql的区别
抓住五一假期尾巴和小伙伴们一起分享这两者的区别.大家在日常编码的过程当中肯定也注意过或者使用过.但是二者其实存在本质的区别 1.什么是LinqToObject呢? LINQ to Objects指直接 ...
- Java基础常用类深度解析(包含常见排序算法)
目录 一.工具类 1.1.工具类的设计 1.1.1.公共静态方法 1.2.单例模式 二.包装类 2.1.基本类型的包装类 2.1.1.Integer 2.1.1.1.Integer >> ...
- 【动态数据源切换失败】由于事务@Transactional注解导致动态数据源切换失效的问题
不多BB,直接上代码: public class DataSourceKey { /** * 用户数据源 */ public final static String USER = "user ...