单细胞分析实录(9): 展示marker基因的4种图形(二)
在上一篇中,我已经讲解了展示marker基因的前两种图形,分别是tsne/umap图、热图,感兴趣的读者可以回顾一下。这一节我们继续学习堆叠小提琴图和气泡图。
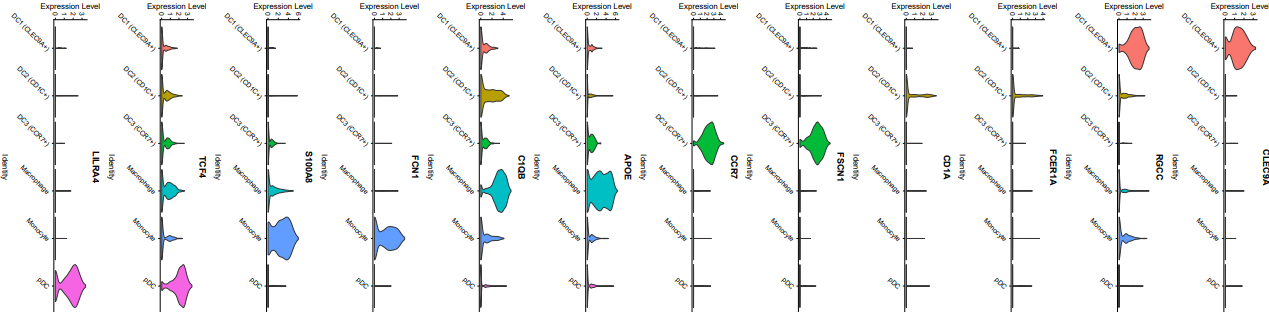
3. 堆叠小提琴图展示marker基因
相比于其他可视化形式,小提琴图可以更直观地展示某一类亚群的某一个基因的表达分布情况。我的marker基因一共选了12个,下面来画图:
Seurat内置的VlnPlot函数可以直接画,
library(xlsx)

markerdf2=read.xlsx("ref_marker2.xlsx",sheetIndex = 1)

markerdf2$gene=as.character(markerdf2$gene)

mye.seu=readRDS("mye.seu.rds")

mye.seu$celltype=factor(mye.seu$celltype,levels = sort(unique(mye.seu$celltype)))

Idents(mye.seu)="celltype"

VlnPlot(mye.seu, features = markerdf2$gene, pt.size = 0, ncol = 1)+

  scale_x_discrete("")+

  theme(

    axis.text.x.bottom = element_blank()

  )

ggsave("vln1.pdf",width = 20,height = 80,units = "cm")
其中pt.size参数表示点的大小,一个点就是一个细胞,一般可以直接设置为0,即不显示点,只画小提琴,看上去更加清楚。尽管此处我对标度和主题进行了调整,但我发现这只对单个feature有用,多个feature时就不起作用了,后续就用AI来简单编辑一下吧。
需要注意的是,图的颜色是根据亚群的类别来划分的,并不是根据基因来区分。
第二种方法,ggplot2代码如下
library(reshape2)

vln.df=as.data.frame(mye.seu[["RNA"]]@data[markerdf2$gene,])

vln.df$gene=rownames(vln.df)

vln.df=melt(vln.df,id="gene")

colnames(vln.df)[c(2,3)]=c("CB","exp")

#数据格式如下

# > head(vln.df)

# gene                     CB   exp

# 1 CLEC9A N01_AAACGGGCATTTCAGG_1 0.000

# 2   RGCC N01_AAACGGGCATTTCAGG_1 0.000

# 3 FCER1A N01_AAACGGGCATTTCAGG_1 0.000

# 4   CD1A N01_AAACGGGCATTTCAGG_1 0.000

# 5  FSCN1 N01_AAACGGGCATTTCAGG_1 1.104

# 6   CCR7 N01_AAACGGGCATTTCAGG_1 0.000

anno=mye.seu@meta.data[,c("CB","celltype")]

vln.df=inner_join(vln.df,anno,by="CB")

vln.df$gene=factor(vln.df$gene,levels = markerdf2$gene) #为了控制画图的基因顺序

vln.df%>%ggplot(aes(celltype,exp))+geom_violin(aes(fill=gene),scale = "width")+

  facet_grid(vln.df$gene~.,scales = "free_y")+

  scale_fill_brewer(palette = "Set3",direction = 1)+

  scale_x_discrete("")+scale_y_continuous("")+

  theme_bw()+

  theme(

    axis.text.x.bottom = element_text(angle = 45,hjust = 1,vjust = 1),

    panel.grid.major = element_blank(),panel.grid.minor = element_blank(),

    legend.position = "none"

  )

ggsave("vln2.pdf",width = 11,height = 22,units = "cm")
geom_violin()函数的scale参数为"width"时,所有小提琴有相同的宽度,默认是"area",有相同的面积;facet_grid()用来分面,文中用的是多行一列,scales = "free_y"表示不同行之间可以有不同范围的y值;scale_fill_brewer()使用ColorBrewer调色板。
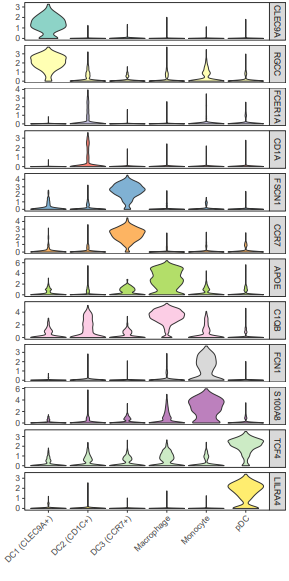
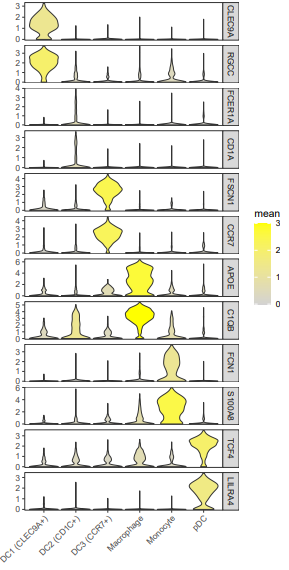
这个图的颜色根据基因来区分,有时可能还会看到小提琴图的颜色是用亚群某个基因的表达均值来映射的,比如
vln.df$celltype_gene=paste(vln.df$celltype,vln.df$gene,sep = "_")

stat.df=as.data.frame(vln.df%>%group_by(celltype,gene)%>%summarize(mean=mean(exp)))

stat.df$celltype_gene=paste(stat.df$celltype,stat.df$gene,sep = "_")

stat.df=stat.df[,c("mean","celltype_gene")]

vln.df=inner_join(vln.df,stat.df,by="celltype_gene")

vln.df$mean=ifelse(vln.df$mean > 3, 3, vln.df$mean)

#这里的阈值3要提前综合所有基因看一下

vln.df%>%ggplot(aes(celltype,exp))+geom_violin(aes(fill=mean),scale = "width")+

  facet_grid(vln.df$gene~.,scales = "free_y")+

  scale_fill_gradient(limits=c(0,3),low = "lightgrey",high = "yellow")+

  scale_x_discrete("")+scale_y_continuous("",expand = c(0.02,0))+

  theme_bw()+

  theme(

    panel.grid.major = element_blank(),panel.grid.minor = element_blank(),

    axis.text.x.bottom = element_text(angle = 45,hjust = 1,vjust = 1)

  )

ggsave("vln3.pdf",width = 11,height = 22,units = "cm")
4. 气泡图展示marker基因
Seurat的画法是这样的,
DotPlot(mye.seu, features = markerdf2$gene)+RotatedAxis()+

  scale_x_discrete("")+scale_y_discrete("")

#其余的微调同ggplot2
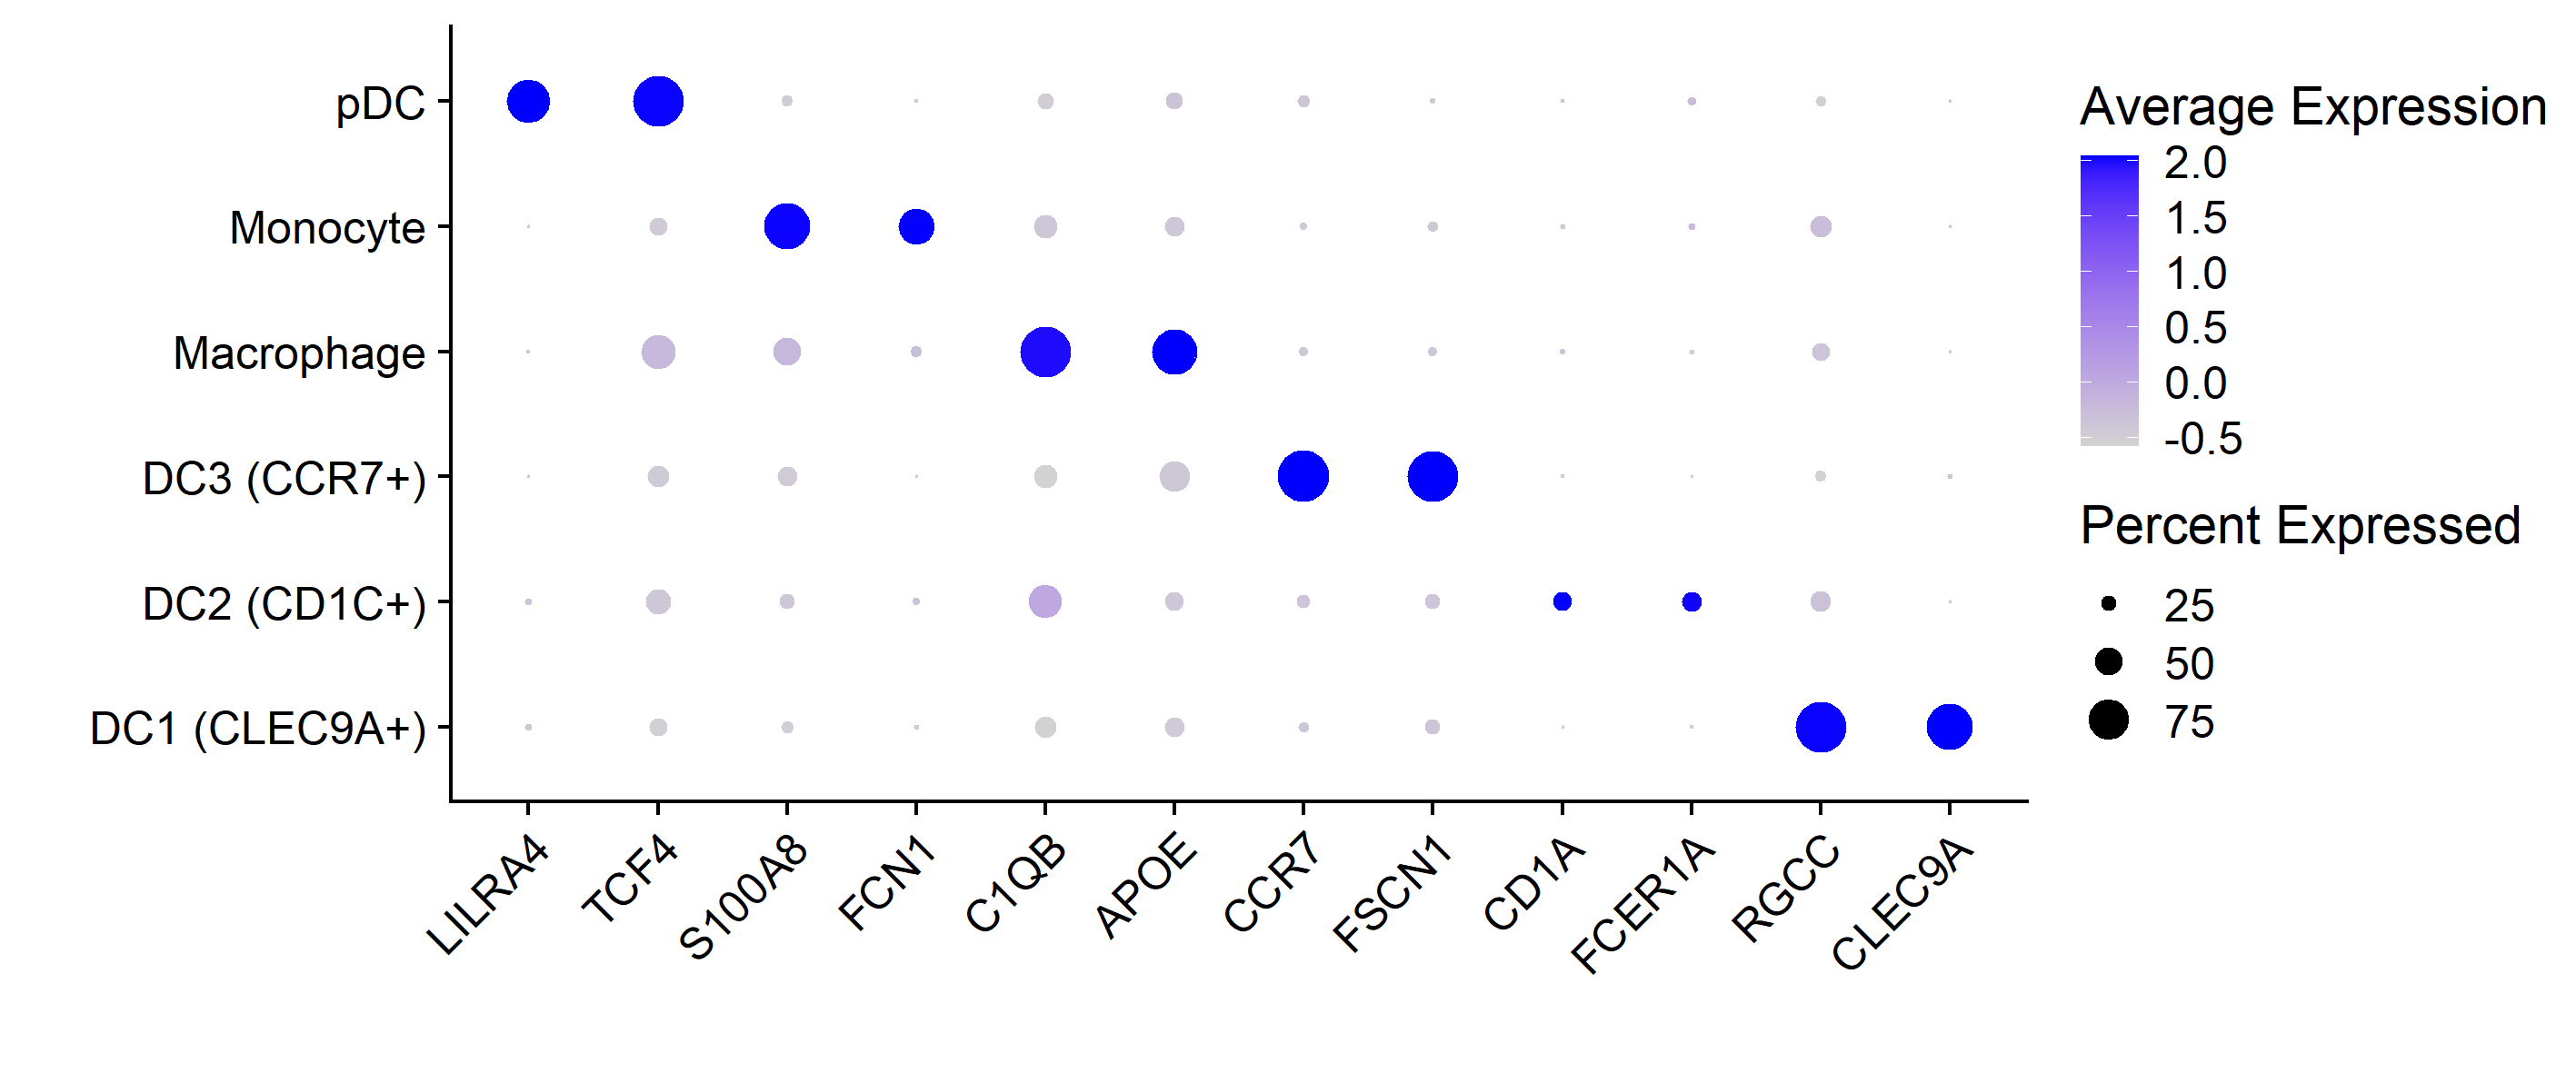
第二种方法,ggplot2代码如下
bubble.df=as.matrix(mye.seu[["RNA"]]@data[markerdf2$gene,])

bubble.df=t(bubble.df)

bubble.df=as.data.frame(scale(bubble.df))

bubble.df$CB=rownames(bubble.df)

bubble.df=merge(bubble.df,mye.seu@meta.data[,c("CB","celltype")],by = "CB")

bubble.df$CB=NULL

celltype_v=c()

gene_v=c()

mean_v=c()

ratio_v=c()

for (i in unique(bubble.df$celltype)) {

  bubble.df_small=bubble.df%>%filter(celltype==i)

  for (j in markerdf2$gene) {

    exp_mean=mean(bubble.df_small[,j])

    exp_ratio=sum(bubble.df_small[,j] > min(bubble.df_small[,j])) / length(bubble.df_small[,j])

    celltype_v=append(celltype_v,i)

    gene_v=append(gene_v,j)

    mean_v=append(mean_v,exp_mean)

    ratio_v=append(ratio_v,exp_ratio)

  }

}

plotdf=data.frame(

  celltype=celltype_v,

  gene=gene_v,

  exp=mean_v,

  ratio=ratio_v

)

plotdf$celltype=factor(plotdf$celltype,levels = sort(unique(plotdf$celltype)))

plotdf$gene=factor(plotdf$gene,levels = rev(as.character(markerdf2$gene)))

plotdf$exp=ifelse(plotdf$exp>3,3,plotdf$exp)

plotdf%>%ggplot(aes(x=celltype,y=gene,size=ratio,color=exp))+geom_point()+

  scale_x_discrete("")+scale_y_discrete("")+

  scale_color_gradientn(colours = rev(c("#FFD92F","#FEE391",brewer.pal(11, "Spectral")[7:11])))+

  scale_size_continuous(limits = c(0,1))+theme_bw()+

  theme(

    axis.text.x.bottom = element_text(hjust = 1, vjust = 1, angle = 45)

  )

ggsave(filename = "bubble2.pdf",width = 9,height = 12,units = c("cm"))
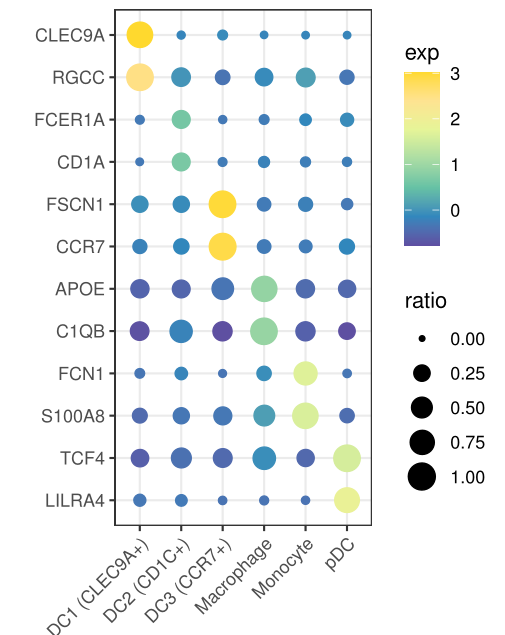
这两种方法具体函数定义略有差异,所以气泡图看上去不太一样
到这里,marker基因的可视化就结束了,基本就是这些。如果你觉得上述内容对你有用,欢迎转发,点赞!有任何疑问可以在公众号后台提出,我都会回复的。
因水平有限,有错误的地方,欢迎批评指正!
单细胞分析实录(9): 展示marker基因的4种图形(二)的更多相关文章
- 单细胞分析实录(8): 展示marker基因的4种图形(一)
今天的内容讲讲单细胞文章中经常出现的展示细胞marker的图:tsne/umap图.热图.堆叠小提琴图.气泡图,每个图我都会用两种方法绘制. 使用的数据来自文献:Single-cell transcr ...
- 【代码更新】单细胞分析实录(20): 将多个样本的CNV定位到染色体臂,并画热图
之前写过三篇和CNV相关的帖子,如果你做肿瘤单细胞转录组,大概率看过: 单细胞分析实录(11): inferCNV的基本用法 单细胞分析实录(12): 如何推断肿瘤细胞 单细胞分析实录(13): in ...
- 【代码更新】单细胞分析实录(21): 非负矩阵分解(NMF)的R代码实现,只需两步,啥图都有
1. 起因 之前的代码(单细胞分析实录(17): 非负矩阵分解(NMF)代码演示)没有涉及到python语法,只有4个python命令行,就跟Linux下面的ls grep一样的.然鹅,有几个小伙伴不 ...
- 单细胞分析实录(5): Seurat标准流程
前面我们已经学习了单细胞转录组分析的:使用Cell Ranger得到表达矩阵和doublet检测,今天我们开始Seurat标准流程的学习.这一部分的内容,网上有很多帖子,基本上都是把Seurat官网P ...
- 单细胞分析实录(4): doublet检测
最近Cell Systems杂志发表了一篇针对现有几种检测单细胞测序doublet的工具的评估文章,系统比较了常见的例如Scrublet.DoubletFinder等工具在检测准确性.计算效率等方面的 ...
- 单细胞分析实录(3): Cell Hashing数据拆分
在之前的文章里,我主要讲了如下两个内容:(1) 认识Cell Hashing:(2): 使用Cell Ranger得到表达矩阵.相信大家已经知道了cell hashing与普通10X转录组的差异,以及 ...
- 单细胞分析实录(18): 基于CellPhoneDB的细胞通讯分析及可视化 (上篇)
细胞通讯分析可以给我们一些细胞类群之间相互调控/交流的信息,这种细胞之间的调控主要是通过受配体结合,传递信号来实现的.不同的分化.疾病过程,可能存在特异的细胞通讯关系,因此阐明这些通讯关系至关重要. ...
- 单细胞分析实录(19): 基于CellPhoneDB的细胞通讯分析及可视化 (下篇)
在上一篇帖子中,我介绍了CellPhoneDB的原理.实际操作,以及一些值得注意的地方.这一篇继续细胞通讯分析的可视化. 公众号后台回复20210723获取本次演示的测试数据,以及主要的可视化代码. ...
- 单细胞分析实录(2): 使用Cell Ranger得到表达矩阵
Cell Ranger是一个"傻瓜"软件,你只需提供原始的fastq文件,它就会返回feature-barcode表达矩阵.为啥不说是gene-cell,举个例子,cell has ...
随机推荐
- 回溯法、子集树、排列树、满m叉树
显示图: 明确给出了图中的各顶点及边 隐式图: 仅给出初始节点.目标节点及产生子节点的条件(一般有问题提议隐含给出)的情况下,构造一个图. 回溯法: 从初始状态出发,在隐式图中以深度优先的方式搜索问题 ...
- POJ - 1226 Substrings (后缀数组)
传送门:POJ - 1226 这个题跟POJ - 3294 和POJ - 3450 都是一样的思路,一种题型. POJ - 3294的题解可以见:https://www.cnblogs.com/li ...
- python对csv文件读写的两种方式 和 读写文件编码问题处理
''' 如果文件读取数据出错,可以考虑加一个encoding属性,取值可以是:utf-8,gbk,gb18030 或者加一个属性error,取值为ignore,例如 open(path, encodi ...
- Light Bulb ZOJ - 3203 三分
三分: 和二分非常类似的一个算法,与二分不同的是 二分是单调的,而三分是一个先增后减或者先减后增 三分可以求出峰值. 注意三分一定是严格单调的,不能有相等的情况. 讲个例题: 题目 题意: 一个人发现 ...
- linux环境下使用jmeter进行分布式测试
1.前言 熟练使用jmeter进行性能测试的工程师都知道,jmeter的客户端性能是有点差的.这会导致一个问题,其客户端的性能损耗会干扰到性能测试的结果,而且当线程数/并发大到一定程度时,客户端性能会 ...
- BIM轻量化——浏览器展示
此篇博客仅为记录,记录钻研过程的零碎思路. 之前考虑过很多可能性,对rvt文件转换格式:.obj.JSON..gltf等等.这些可能性前人一般都尝试过,而且也都做出来了东西. ...
- 给你的SpringBoot项目定制一个牛年专属banner吧
新春快乐,牛年大吉! 新的一年是牛年,在SpringBoot项目里自定义了一个牛年相关的banner,看起来可真不错. 上面是自己制作的一个banner,相关的ASCII字符在文末. SpringBo ...
- Vmware 15.5 ubuntu 12.04.5-desktop-i386.iso insmod后死机
就是makefile没有问题,在其他同学的相同环境下也没有问题,但是在我的虚拟机里就会死机,复制了其他同学的虚拟机过来也会死机,所以猜想是VMware的问题. 于是下载了Virtual box,然后安 ...
- Linux 驱动框架---驱动中的中断
在单片机开发中中断就是执行过程中发生了一些事件需要及时处理,所以需要停止当前正在运行的处理的事情转而去执行中断服务函数,已完成必要的事件的处理.在Linux中断一样是如此使用但是基于常见的中断控制器的 ...
- when I was installing github for windows ,some errors occurred !
1: 2: 3: 4: install.log error messages: