【DB宝36】使用Docker分分钟搭建漂亮的prometheus+grafana监控
一、部署Prometheus+grafana环境
1.1、下载Prometheus+grafana镜像
[root@docker36 ~]# docker pull registry.cn-hangzhou.aliyuncs.com/lhrbest/lhrprometheus:1.0

1.0: Pulling from lhrbest/lhrprometheus

c1e1cb5fc6d2: Already exists

d7889870c229: Pull complete

Digest: sha256:6d2aea56026f4fdb17554b5ad0842766cb8e99a492382b6553ab330d0eb19c4b

Status: Downloaded newer image for registry.cn-hangzhou.aliyuncs.com/lhrbest/lhrprometheus:1.0

registry.cn-hangzhou.aliyuncs.com/lhrbest/lhrprometheus:1.0

[root@docker36 ~]# docker tag registry.cn-hangzhou.aliyuncs.com/lhrbest/lhrprometheus:1.0 lhrbest/lhrprometheus:1.0
1.2、创建镜像
[root@docker36 ~]# ip addr | grep 66

    inet 192.168.66.36/24 brd 192.168.66.255 scope global edge0

[root@docker36 ~]# docker run -d --name lhrprometheus01 -h lhrprometheus01 \

>   -p 2222:22 -p 23389:3389 -p 29090:9090 -p 29093:9093 -p 23000:3000 \

>   --privileged=true lhrbest/lhrprometheus:1.0 \

>   /usr/sbin/init

fed3d3ea7275ec337e305a76d5694473a2637be4c71d22e46e669a5ec3b39e57

[root@docker36 ~]# docker exec -it lhrprometheus01 bash

[root@lhrprometheus01 /]#
其中,9090是Prometheus的端口,3000是grafana的端口,3389是Linux远程桌面的端口。
在本文中,需要注意以下内容:
1、在该镜像中,已安装了prometheus 2.23版本,grafana 7.3.6版本,alertmanager 0.21版本,node_exporter 1.0.1版本,mysqld_exporter 0.12.1版本,oracledb_exporter 0.2.9版本
2、192.168.66.36是Prometheus和grafana的IP地址
3、程序和默认端口对应关系
端口 程序
9090 prometheus
3000 grafana
9093 alter_manager
9100 node_exporter
9104 mysqld_exporter
9121 redis_exporter
9161 oracledb_exporter
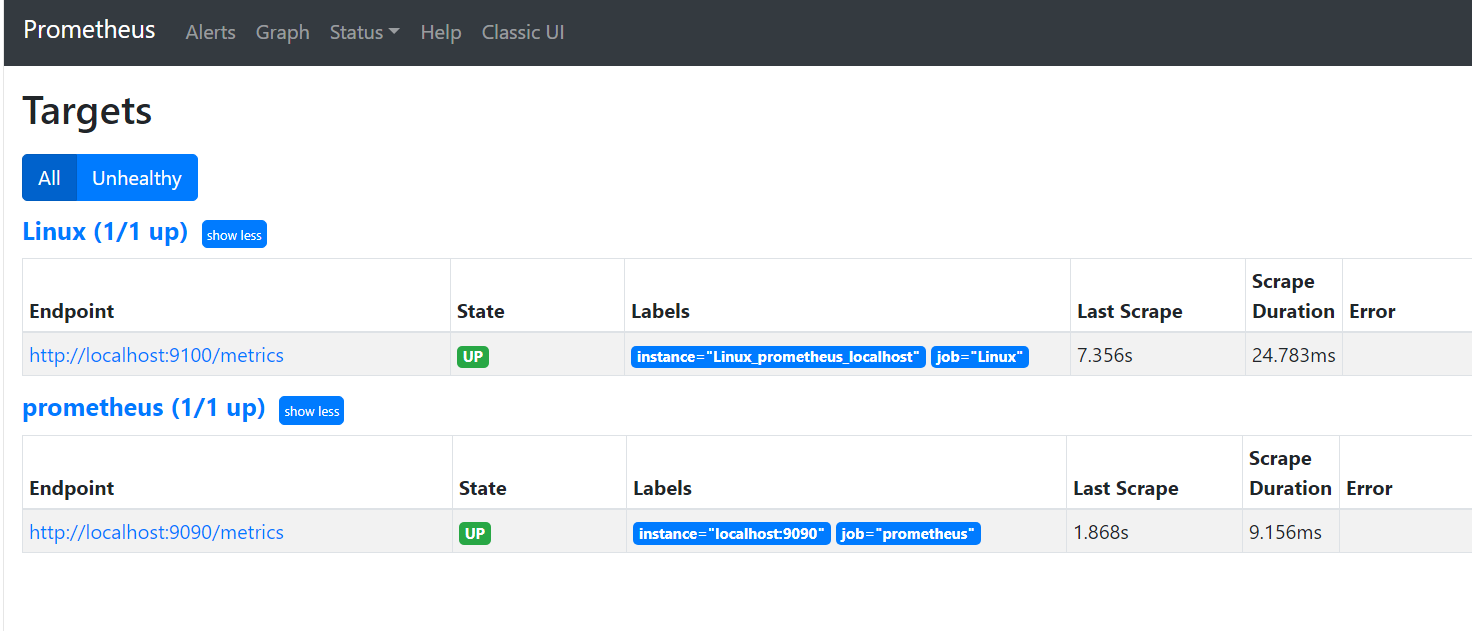
1.3、浏览器访问
访问普罗米修斯(Prometheus):http://192.168.66.36:29090/targets
访问Grafana:http://192.168.66.36:23000 用户名和密码都是admin
默认的Linux系统监控可以看到如下界面:
二、监控Linux主机
2.1、在被监控主机上部署node_exporter软件
需要在被监控的主机上安装node_exporter软件,下载地址:https://prometheus.io/download/
最新版本为:node_exporter-1.0.1.linux-amd64.tar.gz
或者直接将本机的/usr/local/bin/node_exporter文件拷贝到需要被监控的主机上也可以。
假设我这里需要被监控的主机为:121.36.8.186,那么在该主机上执行如下命令:
nohup /usr/local/bin/node_exporter &
检查,node_exporter默认端口为9100:
[root@ecs ~]# netstat -anp | grep 9100

tcp6       0      0 :::9100                 :::*                    LISTEN      24995/node_exporter

tcp6       0      0 10.0.0.134:9100         210.52.224.155:58598    ESTABLISHED 24995/node_exporter

[root@ecs ~]# lsof -i:9100

COMMAND     PID USER   FD   TYPE  DEVICE SIZE/OFF NODE NAME

node_expo 24995 root    3u  IPv6 8125597      0t0  TCP *:jetdirect (LISTEN)

node_expo 24995 root    8u  IPv6 8203663      0t0  TCP ecs:jetdirect->210.52.224.155:58598 (ESTABLISHED)
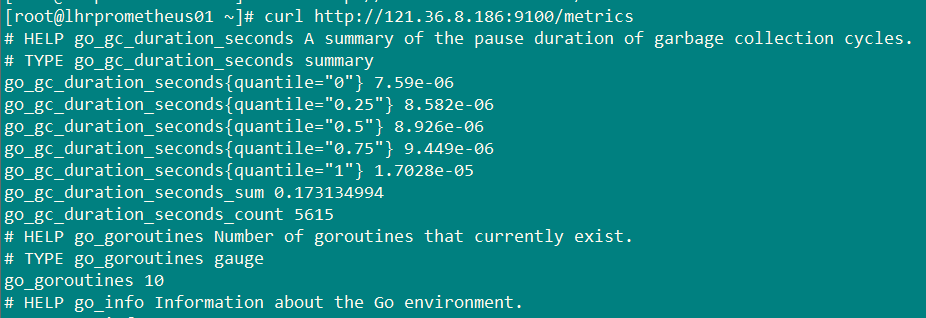
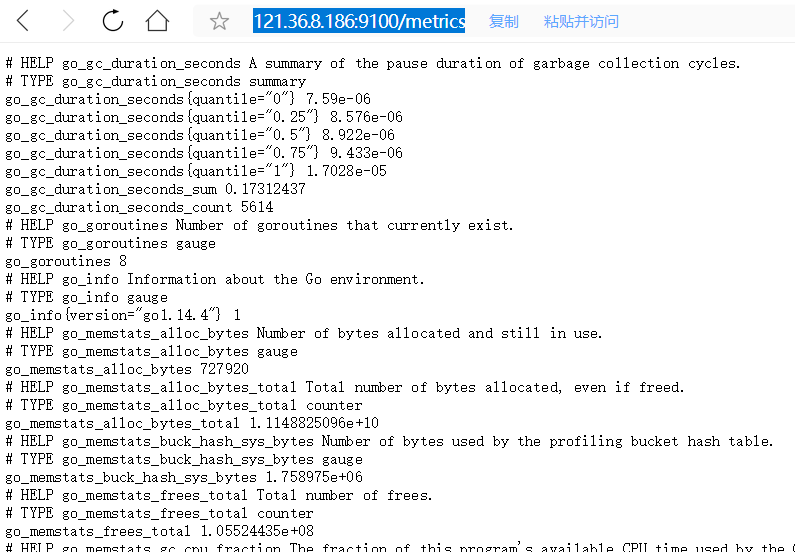
命令行直接访问:

浏览器访问http://121.36.8.186:9100/metrics ,返回:
2.2、修改prometheus的配置文件
修改prometheus的配置文件(/usr/local/prometheus/prometheus.yml),添加第6-8行:
  - job_name: 'Linux'

    static_configs:

    - targets: ['localhost:9100']

      labels:

        instance: Linux_prometheus_localhost

    - targets: ['121.36.8.186:9100']

      labels:

        instance: Linux_121.36.8.186
通过命令热加载:
curl -XPOST http://localhost:9090/-/reload
2.3、浏览器访问
此时再刷新访问:http://192.168.66.36:29090/targets
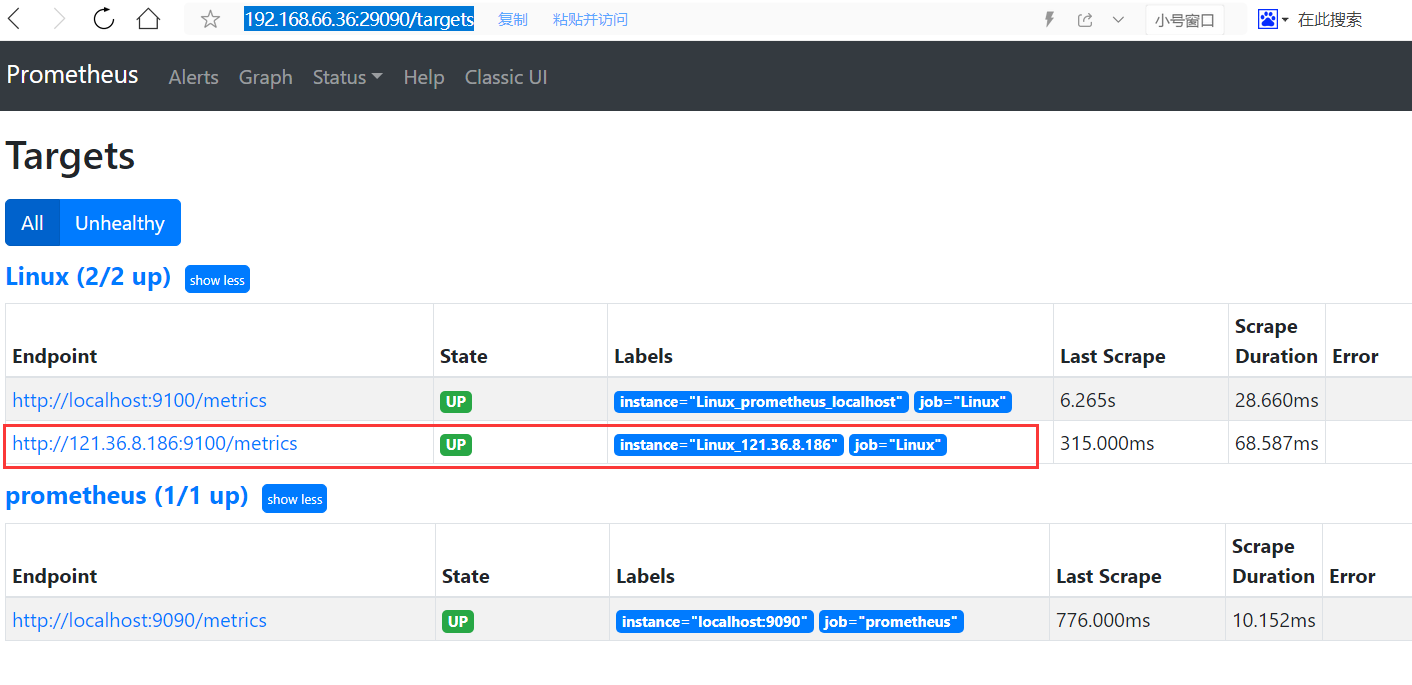
发现新主机已经被监控到了。此时再去grafana页面查询:
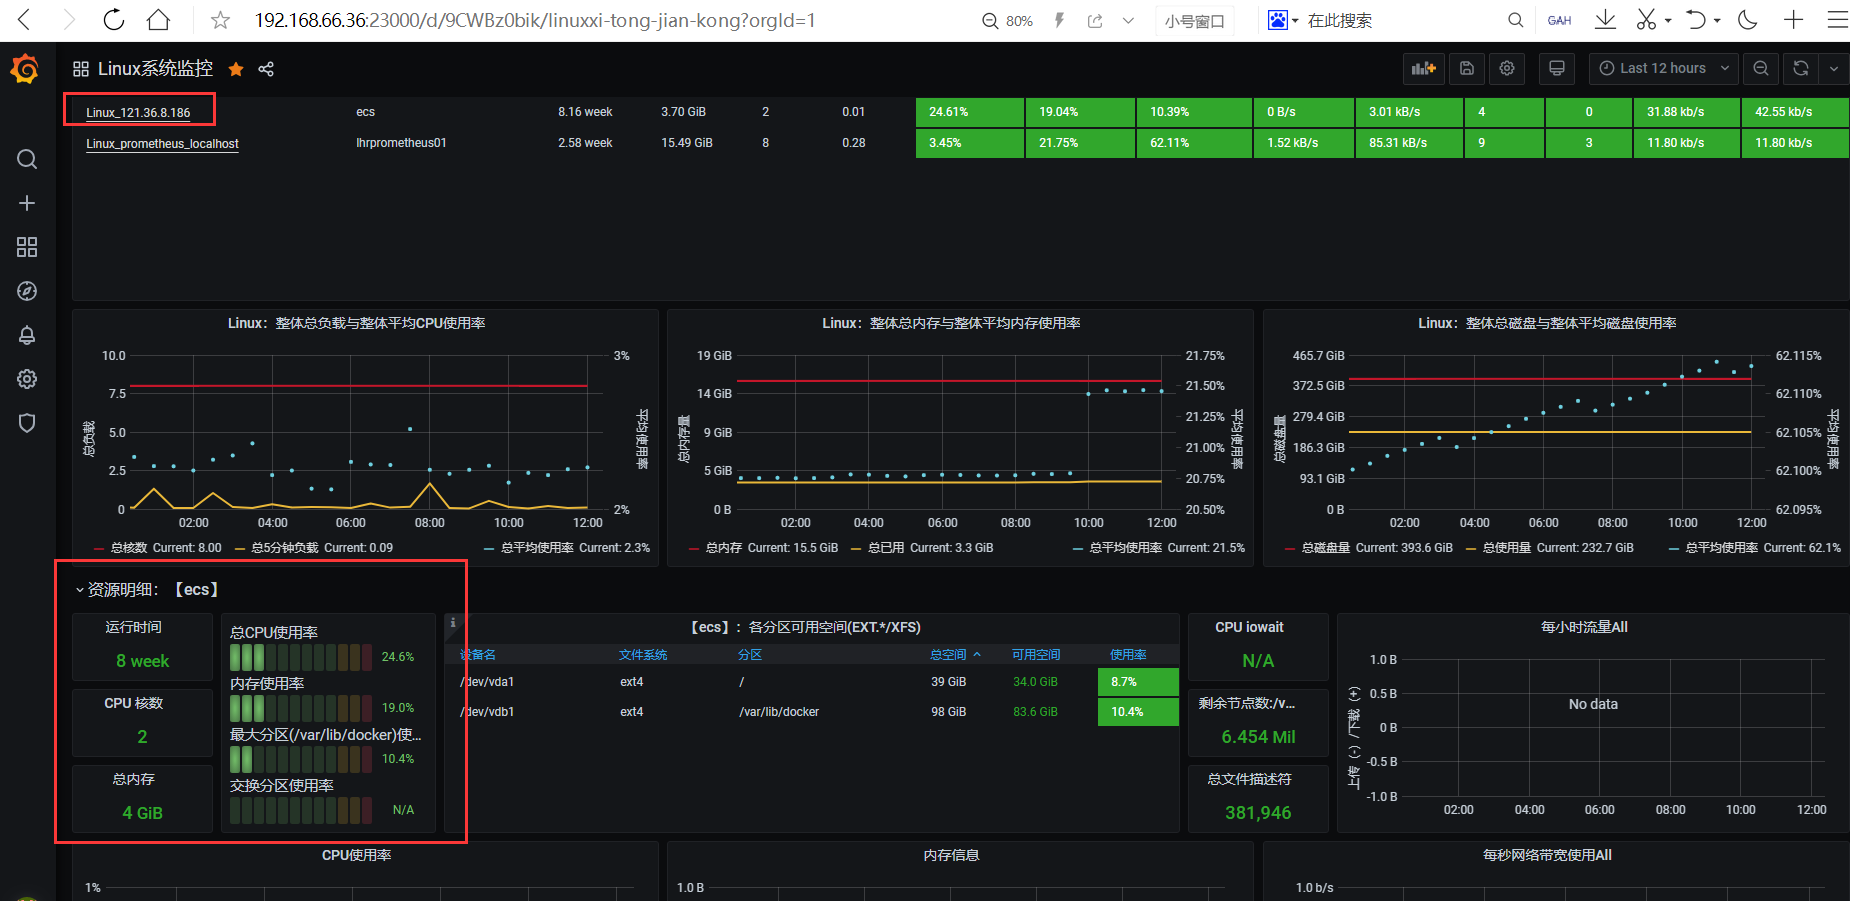
发现已经有数据了。
三、监控Windows主机
3.1、在被监控主机上部署wmi-exporter软件
在需要被监控windows机器安装wmi-exporter,下载节点监控程序并运行,默认端口9182,下载地址:https://github.com/martinlindhe/wmi_exporter
安装完成后,默认安装了service,软件安装路径为:C:\Program Files\windows_exporter\
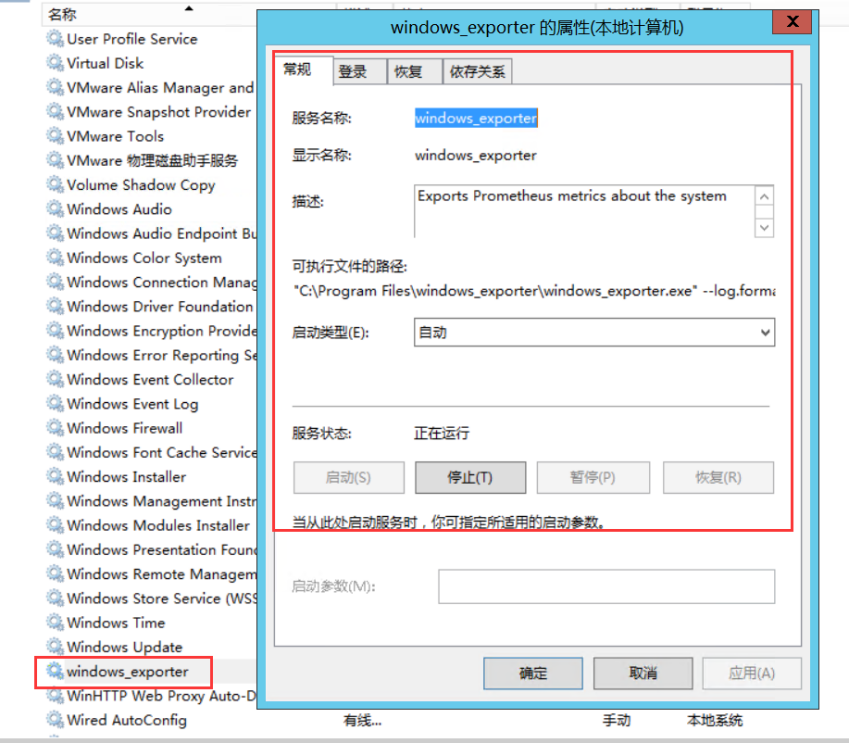
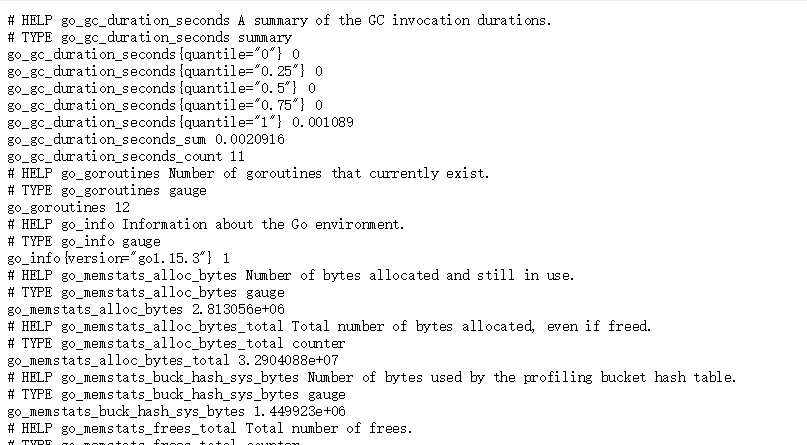
浏览器访问:http://192.168.66.236:9182/metrics,出现如下信息则,客户端节点正常
3.2、修改prometheus的配置文件
修改prometheus的配置文件(/usr/local/prometheus/prometheus.yml),添加第1-3行:
  - job_name: 'Windows'

    static_configs:

    - targets: ['192.168.66.236:9182']
通过命令热加载:
curl -XPOST http://localhost:9090/-/reload
3.3、浏览器访问
此时再刷新访问:http://192.168.66.36:29090/targets
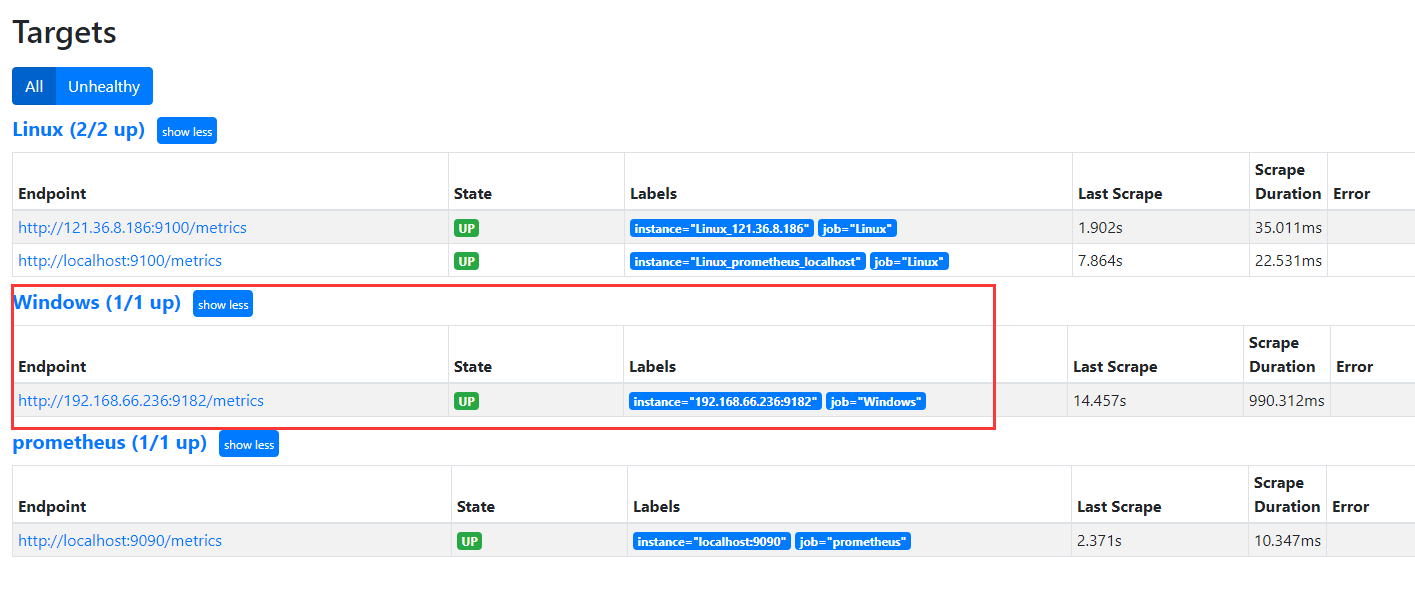
发现新主机已经被监控到了。此时再去grafana页面查询:

发现已经有数据了。
四、监控MySQL实例
4.1、配置被监控的MySQL实例
监控MySQL实例需要用到mysqld_exporter软件,下载地址:https://prometheus.io/download/
监控MySQL实例可以分为2种部署方式:
1、分离部署+环境变量
这种方式是在每个mysql服务器上跑一个exporter程序,比如10.10.20.14服务器上跑自己的mysqld_exporter,而登到10.10.20.15服务器上也启动自己的mysqld_exporter,也就是分离部署,这样的话每个mysql服务器上除了mysqld进程外还会多一个mysqld_exporter的进程。部署方式(本文不使用这种方式):
export DATA_SOURCE_NAME='root:lhr@(192.168.66.35:3317)/'

nohup mysqld_exporter 1>/dev/null 2>&1 &
2、集中部署+配置文件
如果我们想要保持mysql服务器零入侵的纯净环境,这时候就可以尝试一下集中部署+配置文件的方式。集中部署,就是说我们将所有的mysqld_exporter部署在同一台服务器上,在这台服务器上对mysqld_exporter进行统一的管理。
本文,我们采用第2种方式部署。所以,直接在容器lhrprometheus01内进行配置:
mkdir -p /etc/mysqld_exporter/

cd /etc/mysqld_exporter/

cat > mysql573317.cnf << "EOF"

[client]

user=root

password=lhr

host=192.168.66.35

port=3317

EOF

cat > mysql803318.cnf << "EOF"

[client]

user=root

password=lhr

host=192.168.66.35

port=3318

EOF

unset DATA_SOURCE_NAME

nohup mysqld_exporter --web.listen-address=localhost:9104 --config.my-cnf=/etc/mysqld_exporter/mysql573317.cnf 1>/dev/null 2>&1 &

nohup mysqld_exporter --web.listen-address=localhost:9105 --config.my-cnf=/etc/mysqld_exporter/mysql803318.cnf 1>/dev/null 2>&1 &

-- 校验是否配置成功

curl http://localhost:9104/metrics

curl http://localhost:9105/metrics
4.2、修改prometheus的配置文件
修改prometheus的配置文件(/usr/local/prometheus/prometheus.yml),添加第1-8行:
  - job_name: 'MySQL'

    static_configs:

    - targets: ['localhost:9104']

      labels:

        instance: MySQL_192.168.66.35:3317

    - targets: ['localhost:9105']

      labels:

        instance: MySQL_192.168.66.35:3318
通过命令热加载:
curl -XPOST http://localhost:9090/-/reload
4.3、浏览器访问
此时再刷新访问:http://192.168.66.36:29090/targets
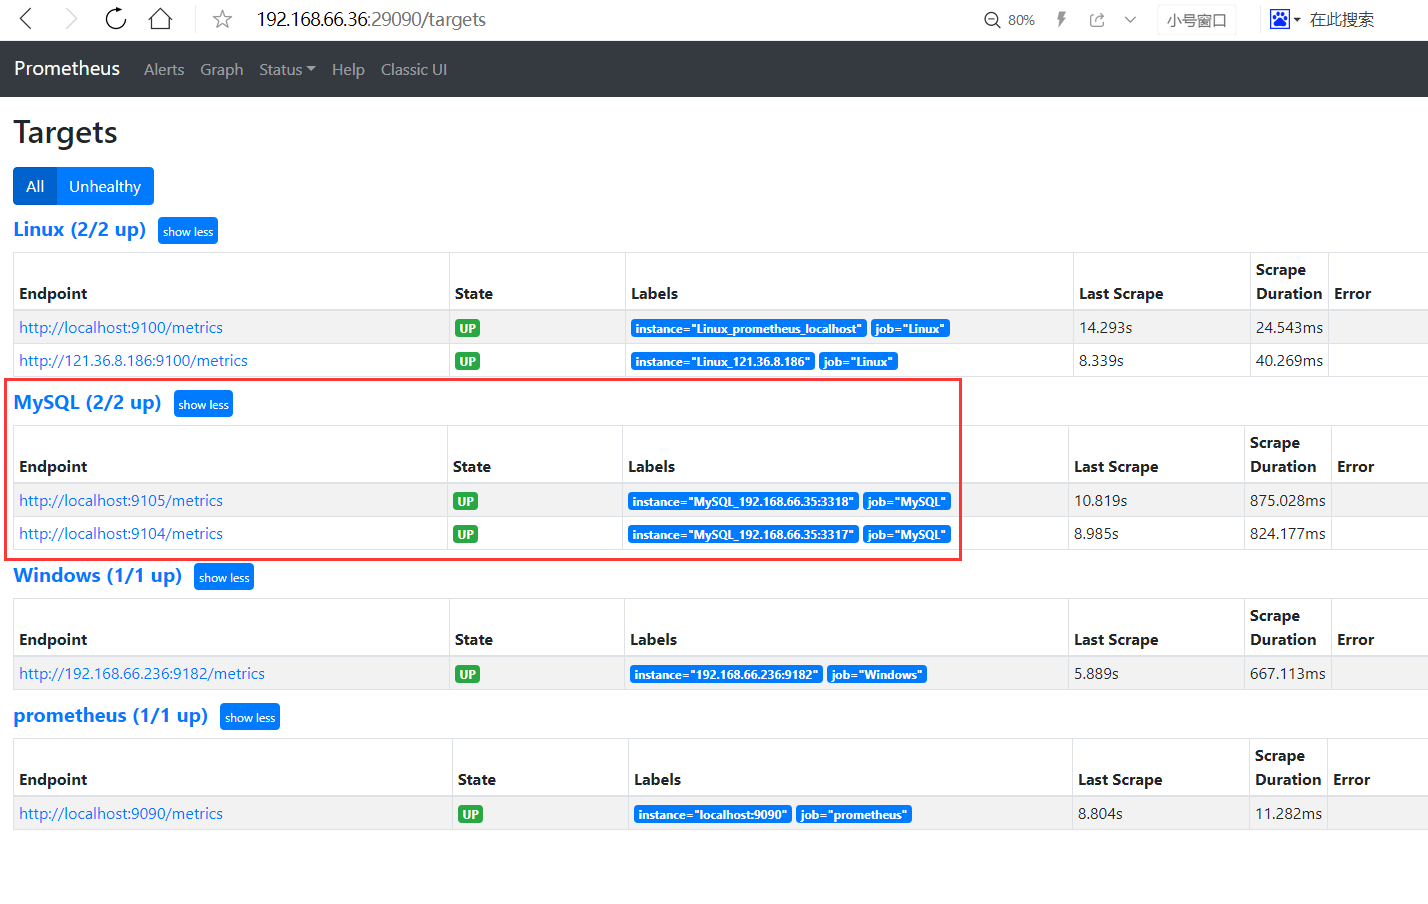
发现MySQL实例已经被监控到了。此时再去grafana页面查询:
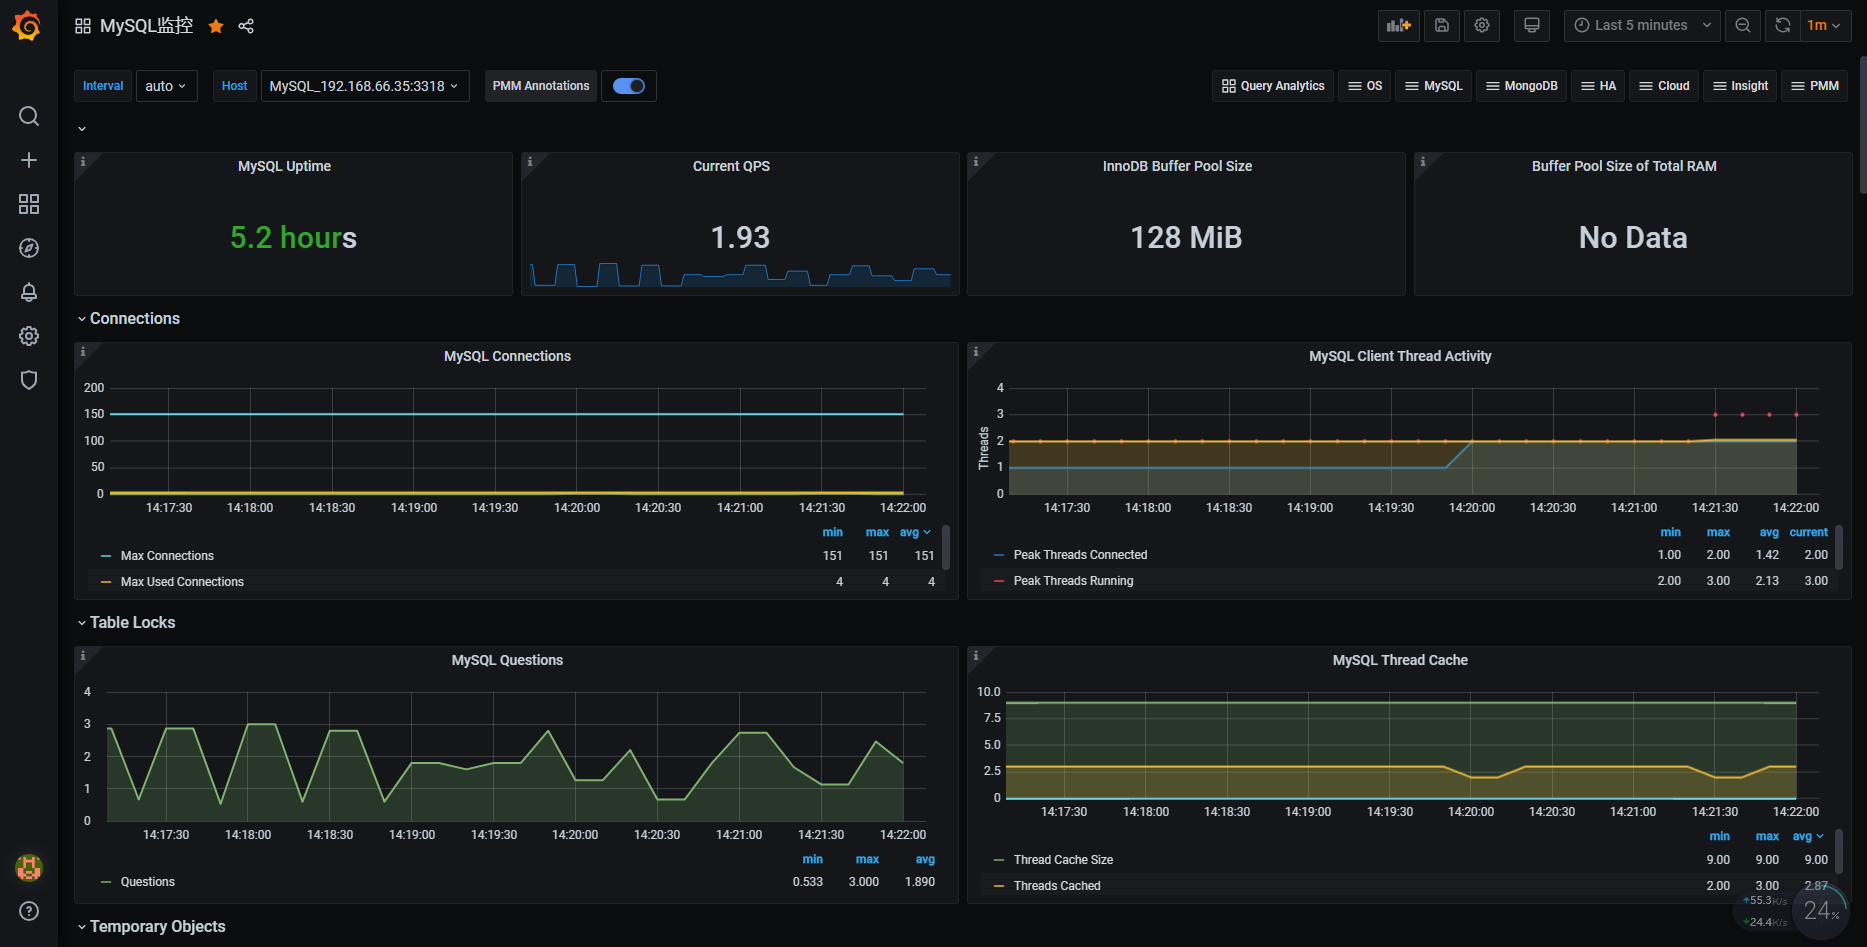
发现已经有数据了。
五、监控Oracle实例
5.1、配置被监控的Oracle实例
监控Oracle数据库,需要安装oracle exporter,下载地址:https://github.com/iamseth/oracledb_exporter/releases
监控Oracle和MySQL一样,可以对原Oracle服务器零入侵,只需在Prometheus服务器上做配置即可,执行如下命令即可:
export DATA_SOURCE_NAME='lhr/lhr@192.168.66.35:1523/LHR11G'

nohup oracledb_exporter -default.metrics /usr/local/oracledb_exporter/default-metrics.toml -web.listen-address 0.0.0.0:9161 &
注意:由于9161端口没有对外暴露,所以,需要进入Linux的远程桌面访问,打开mstsc
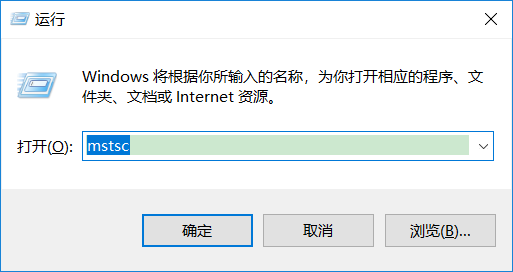
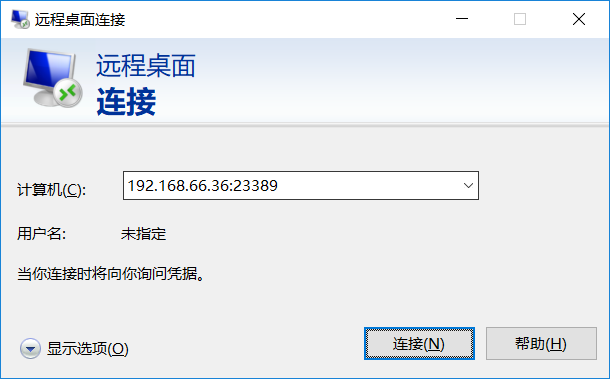
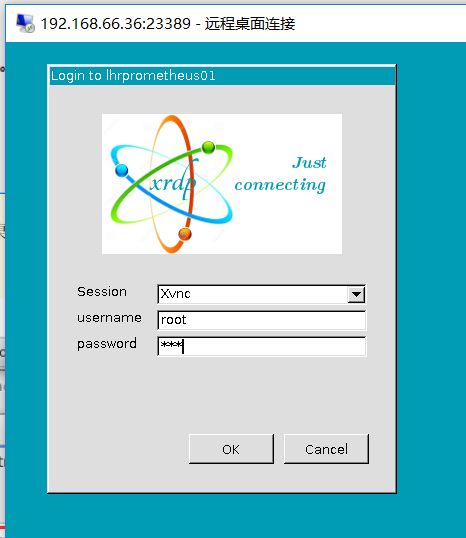
192.168.66.36是Prometheus所在的服务器,进入远程桌面,用户名为root,密码为lhr,打开firefox浏览器即可访问。浏览器访问:http://localhost:9161/metrics,若出现如下信息,则说明客户端节点正常。

5.2、修改prometheus的配置文件
修改prometheus的配置文件(/usr/local/prometheus/prometheus.yml),添加第1-5行:
  - job_name: 'Oracle'

    static_configs:

    - targets: ['localhost:9161']

      labels:

        instance: Oracle_192.168.66.35:1523
通过命令热加载:
curl -XPOST http://localhost:9090/-/reload
5.3、浏览器访问
此时再刷新访问:http://192.168.66.36:29090/targets

发现新主机已经被监控到了。此时再去grafana页面查询:
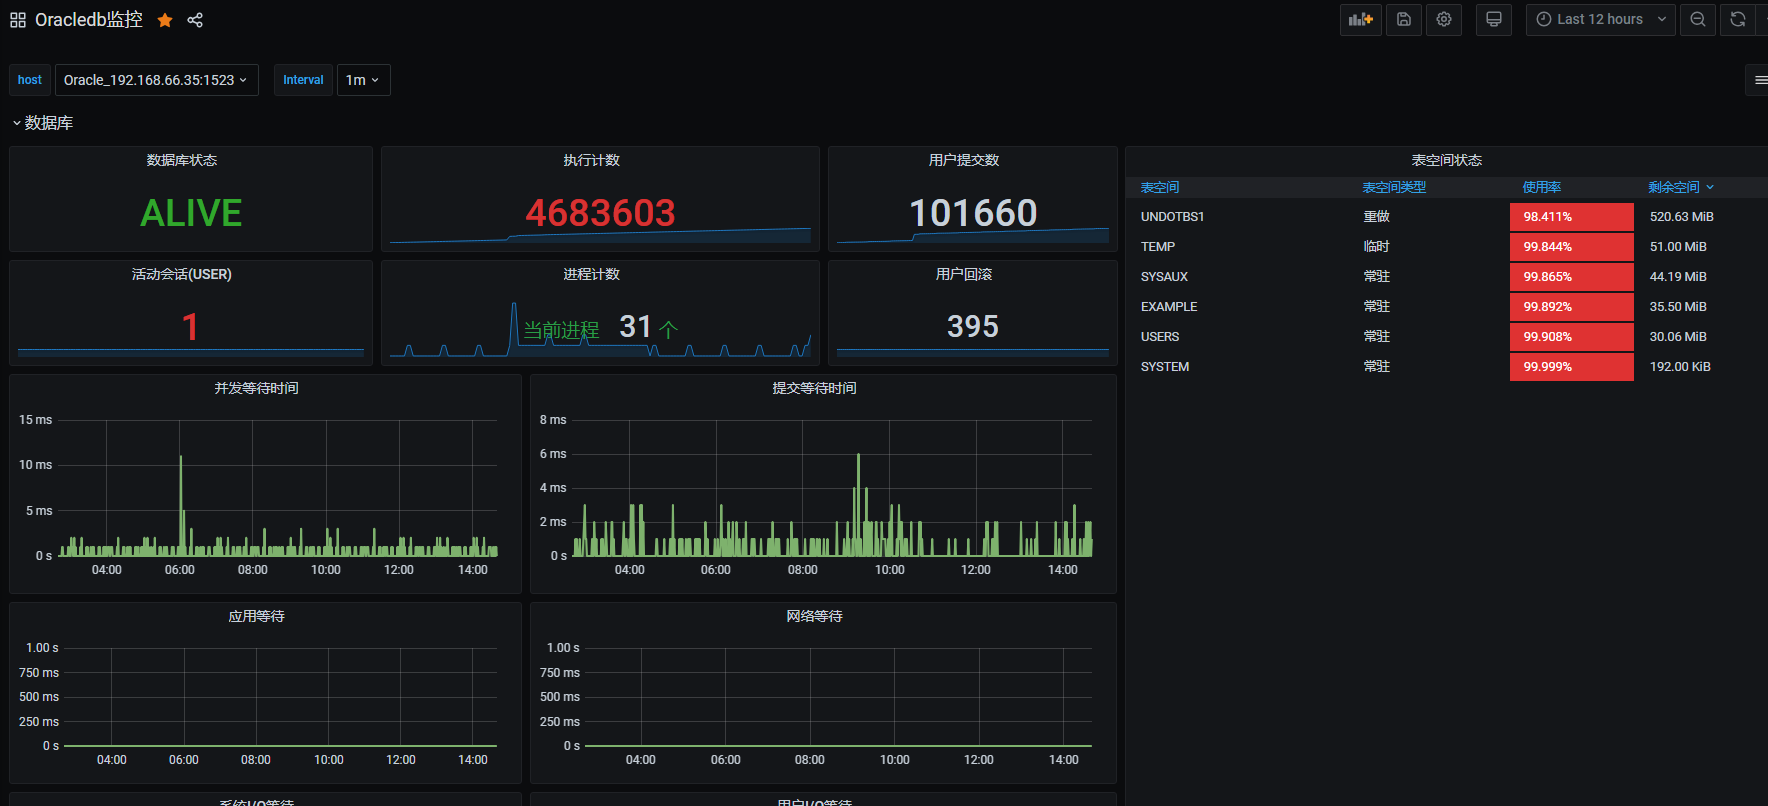
发现已经有数据了。
六、测试邮件告警功能
本镜像环境已经配置了MySQL和Linux服务器的邮件告警功能,可以登录http://192.168.66.36:29090/alerts查看,相关的规则详情可以参考:http://192.168.66.36:29090/rules
告警的默认收件人是lhrbest@qq.com,若想修改收件人地址,那么可以修改文件/usr/local/alertmanager/alertmanager.yml,将其中的lhrbest@qq.com修改成自己的邮箱即可。在修改完成后,记得重启alertmanager软件,启动命令如下:
pkill alertmanager

nohup alertmanager --config.file=/usr/local/alertmanager/alertmanager.yml &
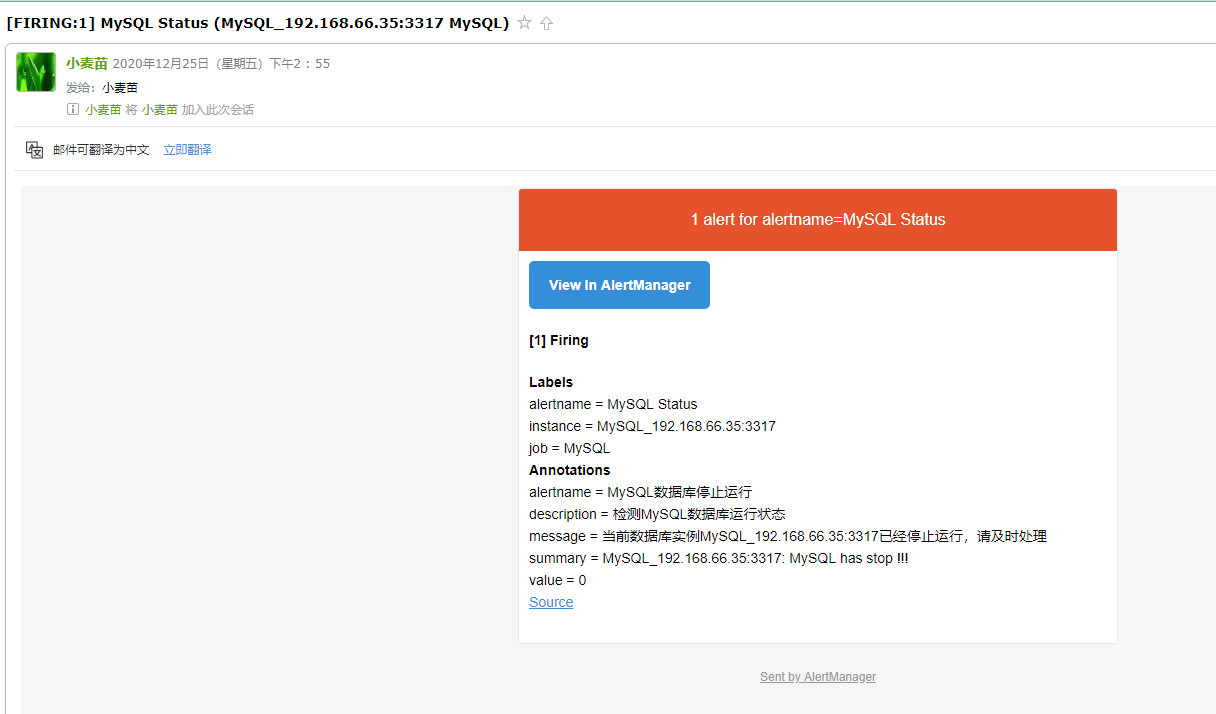
6.1、测试MySQL宕机
关闭MySQL服务器:
C:\Users\lhrxxt>mysql -uroot -plhr -h192.168.66.35 -P3317

mysql: [Warning] Using a password on the command line interface can be insecure.

Welcome to the MySQL monitor.  Commands end with ; or \g.

Your MySQL connection id is 1003

Server version: 5.7.30-log MySQL Community Server (GPL)

Copyright (c) 2000, 2020, Oracle and/or its affiliates. All rights reserved.

Oracle is a registered trademark of Oracle Corporation and/or its

affiliates. Other names may be trademarks of their respective

owners.

Type 'help;' or '\h' for help. Type '\c' to clear the current input statement.

MySQL [(none)]> shutdown ;

Query OK, 0 rows affected (0.05 sec)
收到邮件:
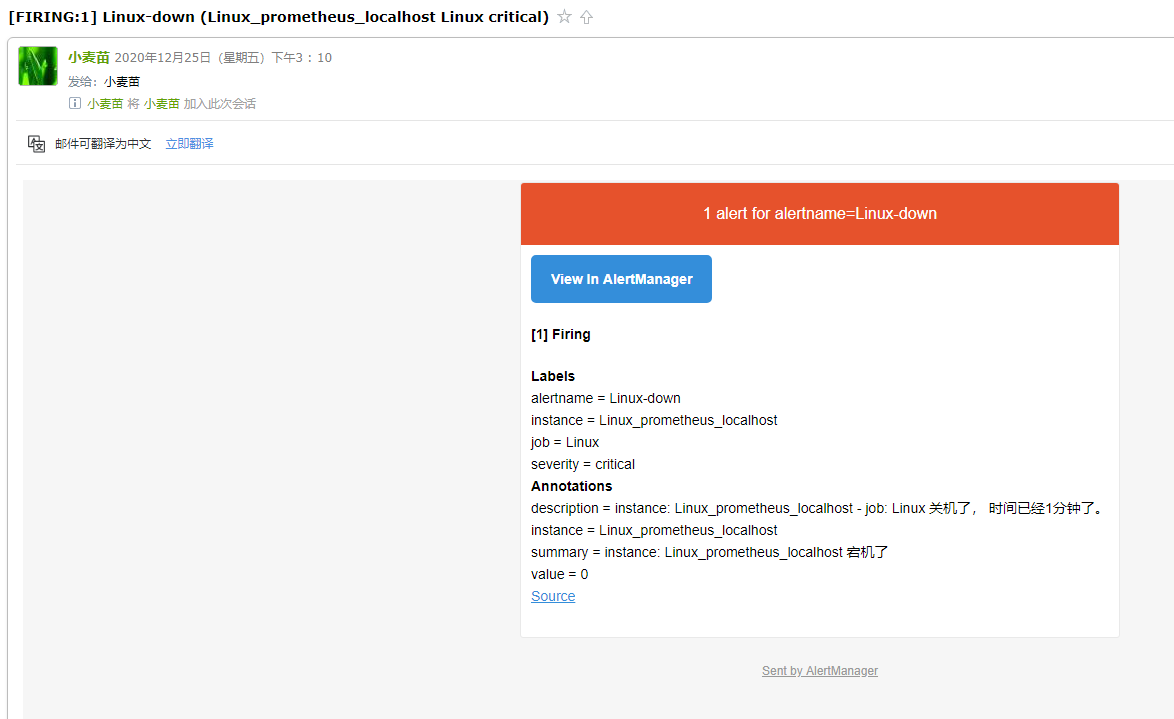
6.2、测试Linux宕机
首先关闭相关主机,等待收邮件:
七、总结
如何?一番感受下来,是不是很爽!!!
当然,Prometheus还可以监控其它很多内容,例如SQL Server、PG、Redis、MongoDB、K8s、ES等,这里不再演示,若想学习更多内容请联系麦老师。
About Me
● 本文作者:小麦苗,部分内容整理自网络,若有侵权请联系小麦苗删除
● 本文在个人微 信公众号(DB宝)上有同步更新
● QQ群号: 230161599 、618766405,微信群私聊
● 个人QQ号(646634621),微 信号(db_bao),注明添加缘由
● 于 2021年2月 在西安完成
● 最新修改时间:2021年2月
● 版权所有,欢迎分享本文,转载请保留出处
●小麦苗的微店: https://weidian.com/?userid=793741433
●小麦苗出版的数据库类丛书: http://blog.itpub.net/26736162/viewspace-2142121/
●小麦苗OCP、OCM、高可用、DBA学习班(Oracle、MySQL、NoSQL): http://blog.itpub.net/26736162/viewspace-2148098/
●数据库笔试面试题库及解答: https://mp.weixin.qq.com/s/Vm5PqNcDcITkOr9cQg6T7w
使用微信客户端扫描下面的二维码来关注小麦苗的微信公众号(DB宝)及QQ群(DBA宝典)、添加小麦苗微信, 学习最实用的数据库技术。

【DB宝36】使用Docker分分钟搭建漂亮的prometheus+grafana监控的更多相关文章
- cAdvisor+Prometheus+Grafana监控docker
cAdvisor+Prometheus+Grafana监控docker 一.cAdvisor(需要监控的主机都要安装) 官方地址:https://github.com/google/cadvisor ...
- Docker搭建Prometheus+grafana监控系统
一.Prometheus简介 1.简介 Prometheus是由SoundCloud开发的开源监控报警系统和时序列数据库(TSDB). Prometheus使用Go语言开发,是Google BorgM ...
- Prometheus+Grafana监控-基于docker-compose搭建
前言 Prometheus Prometheus 是有 SoundCloud 开发的开源监控系统和时序数据库,基于 Go 语言开发.通过基于 HTTP 的 pull 方式采集时序数据,通过服务发现或静 ...
- 初试 Prometheus + Grafana 监控系统搭建并监控 Mysql
转载自:https://cloud.tencent.com/developer/article/1433280 文章目录1.Prometheus & Grafana 介绍1.1.Prometh ...
- 基于Docker+Prometheus+Grafana监控SpringBoot健康信息
在微服务体系当中,监控是必不可少的.当系统环境超过指定的阀值以后,需要提醒指定的运维人员或开发人员进行有效的防范,从而降低系统宕机的风险.在CNCF云计算平台中,Prometheus+Grafana是 ...
- docker-compose快速搭建 Prometheus+Grafana监控系统
一.说明Prometheus负责收集数据,Grafana负责展示数据.其中采用Prometheus 中的 Exporter含:1)Node Exporter,负责收集 host 硬件和操作系统数据.它 ...
- Prometheus+Grafana 监控 Docker
cAdvisor (Container Advisor) :用于收集正在运行的容器资源使用和性能信息. https://github.com/google/cadvisor Prometheus(普罗 ...
- docker-compose 搭建 Prometheus+Grafana监控系统
有关监控选型之前有写过一篇文章: 监控系统选型,一文轻松搞定! 监控对象 Linux服务器 Docker Redis MySQL 数据采集 1).prometheus: 采集数据 2).node-ex ...
- Centos7 搭建prometheus+Grafana监控
https://baijiahao.baidu.com/s?id=1676883786156871051&wfr=spider&for=pc node scrape_configs ...
随机推荐
- SSRF之利用dict和gopher吊打Redis
SSRF之利用dict和gopher吊打Redis 写在前面 SSRF打Redis也是老生常谈的东西了,这里复现学习一下之前在xz看到某师傅写的关于SSRF利用dict和gopher打内网服务的文章, ...
- 51 张图助你彻底掌握 HTTP!
前言 如果说 TCP/IP 协议是互联网通信的根基,那么 HTTP 就是其中当之无愧的王者,小到日常生活中的游戏,新闻,大到双十一秒杀等都能看到它的身影,据 NetCraft 统计,目前全球至少有 1 ...
- informix部署安装
informix部署安装 一.环境准备 Linux版本:centos7.6 Linux主机名:localhost informix安装包:ibm.ids.14.10.FC4W1.LNX.tar inf ...
- WebApplicationContext
在Web应用中,我们会用到WebApplicationContext 用它来保存上下文信息 那么它set到ServletContext的过程是怎么样呢 1)通过WEB.XML中监听类 p.p1 { ...
- JVM参数调优总结
一.前言 要想成为一名高级Java开发具备JVM调优的能力必不可少,能够根据项目实际情况进行JVM调优的前提是理解JVM原理和常用JVM参数的含义及作用,虽然<深入理解Java虚拟机>这本 ...
- TurtleBot3 Waffle (tx2版华夫)(13)RC100遥控杆控制
13.1.遥控器说明 使用ROBOTIS RC100的设置已经在ROS的OpenCR固件中,因此不需要安装必需软件包, 安装号即可使用. 13.2.遥控器的安装 1接线口穿过后壳的过孔. 2接线口连接 ...
- YuebonCore 2021第一版发布,重构功能菜单模块
YuebonCore 2021.1.6 版本发布了,这是该软件 2021 年的首个版本更新. 对功能菜单模块进行重构,简化功能模块的新增配置,删除了原有的sys_function功能表,,优化sys_ ...
- 技术面试没过,居然是没有用pytest测试框架
1.引言 我有一个朋友是做Python自动化测试的.前几天他告诉我去参加一个大厂面试被刷了. 我问他是有没有总结被刷下来的原因.他说面试官问了一些 pytest 单元测试框架相关的知识,包括什么插件系 ...
- Elastisearch在kibana下常用命令总结
1.获取所有数据 GET /_search 2.创建一个Document PUT /ecommerce/product/1 { "name" : "gaolujie ya ...
- Sublime Text 3 习惯插件 转
原帖:https://www.cnblogs.com/hykun/p/sublimeText3.html Emmet插件 Emmet插件可以说是使用Sublime Text进行前端开发必不可少的插件 ...