Prometheus + Grafana 监控(mysql 和redis)
1、监控MySQL(mysqld-exporter)
https://github.com/prometheus/mysqld_exporter/releases/download/v0.11.0/mysqld_exporter-0.11.0.linux-amd64.tar.gz
(1)被监控mysql机器安装mysqld-exporter
#tar -C /usr/local/ -xvf mysqld_exporter-0.11.0.linux-amd64.tar.gz
(2)设置配置文件,user为数据库登录用户,password为这个用户的密码
vi .my.cnf
[client]
user=root
password=123456
(3)启动mysqld-exporter
/usr/local/mysqld_exporter-0.11.0.linux-amd64/mysqld_exporter --config.my-cnf="/usr/local/mysqld_exporter-0.11.0.linux-amd64/.my.cnf" &
(4)prometheus配置文件中加入mysql监控并重启
vim /usr/local/Prometheus/prometheus.yml
默认mysqld-exporter端口为9104
- job_name: 'MySQL'
static_configs:
- targets: ['192.168.0.103:9104']
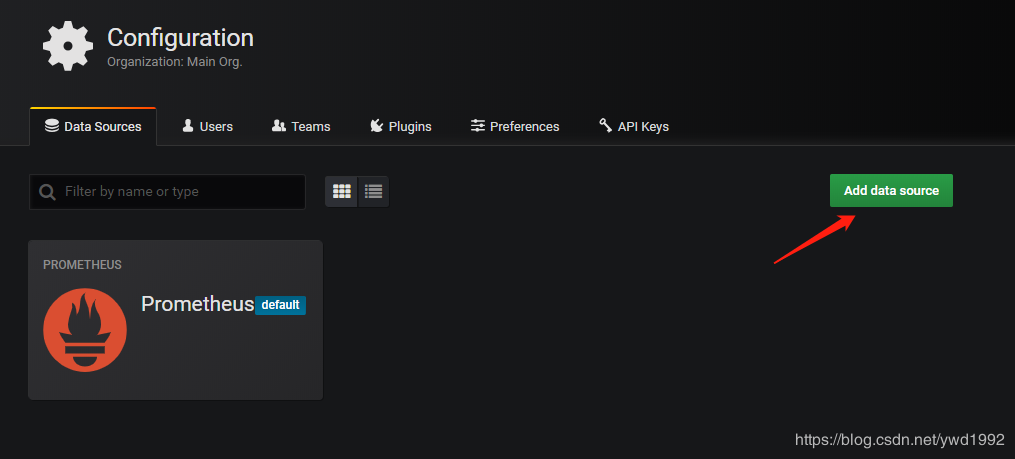
(5)设置数据源
grafana界面添加mysql数据源


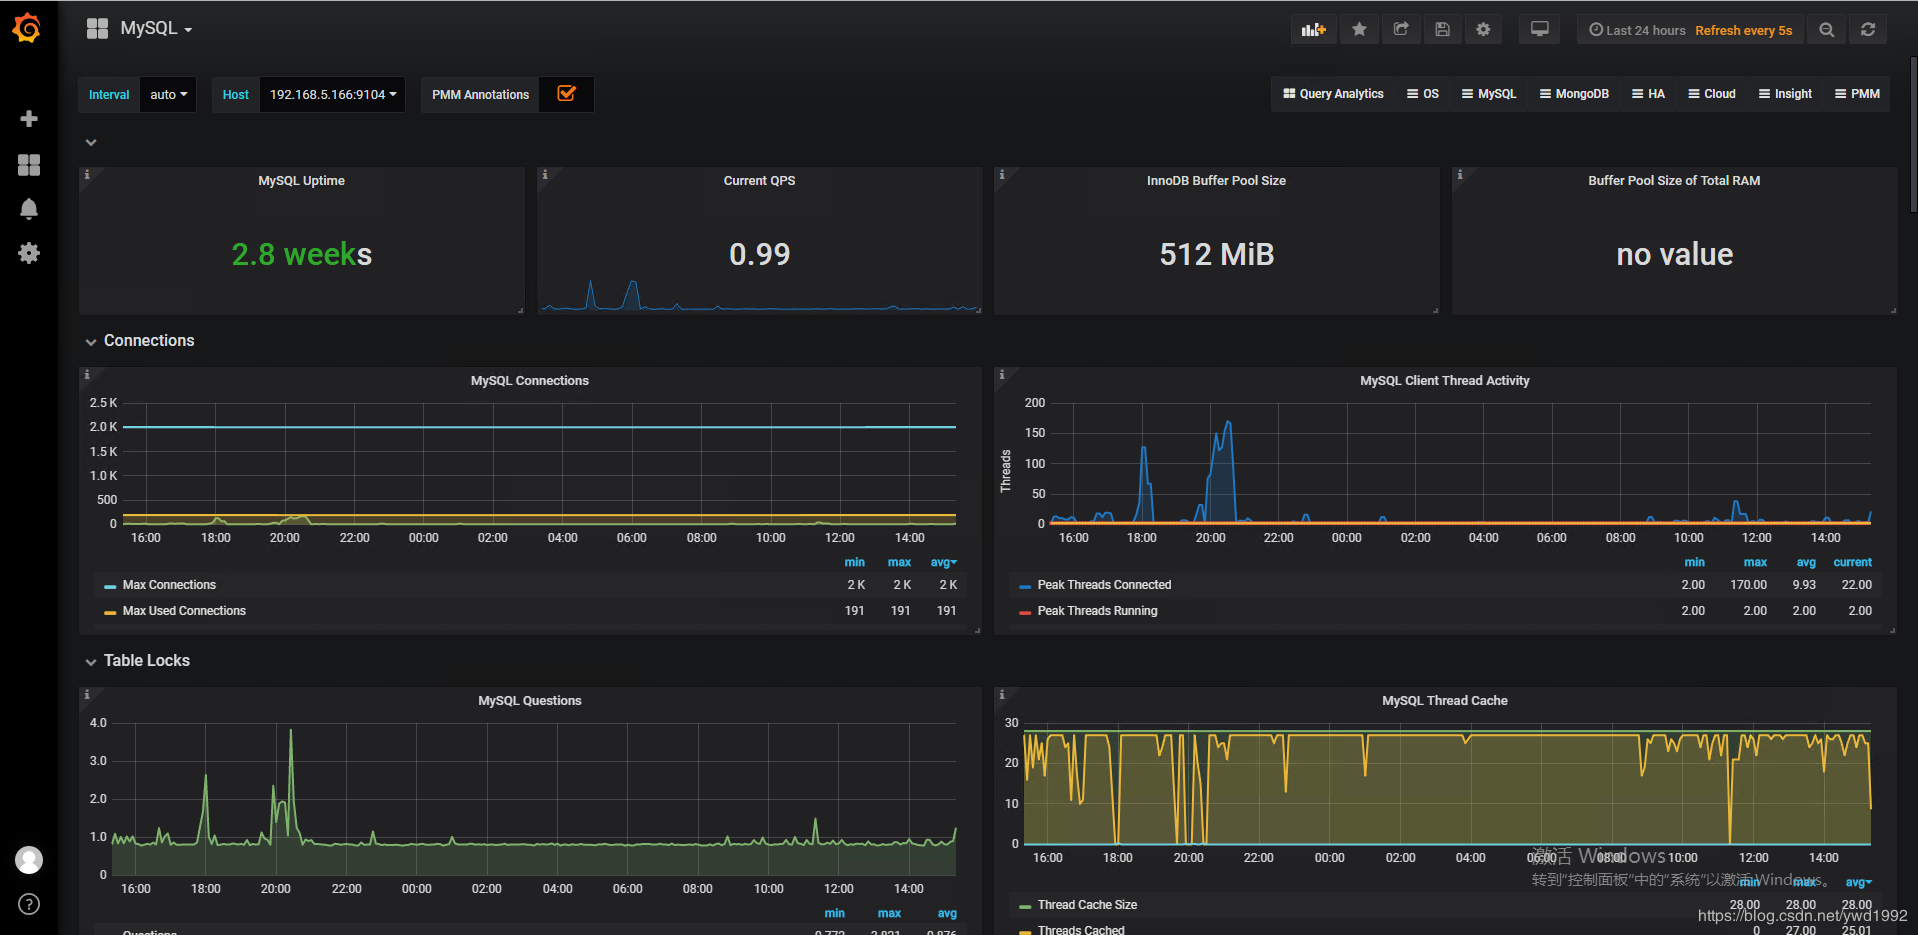
(6)导入已经画好的dashboard,数据源选择刚刚创建好的mysql数据源即可
- 链接:https://pan.baidu.com/s/1GBzogDLsYS3IvwH4WbdPLw 提取码:ef6e
2、监控Redis(redis_exporter)
链接:https://pan.baidu.com/s/12y7HxtQlBjFwr_i8ClM8Kw 提取码:13v2
(1)安装redis_exportertar -C /usr/local/ -xvf redis_exporter-v0.15.0.linux-amd64.tar.gz
(2)启动redis_exporter默认redis_exporter端口为9121
./redis_exporter redis//192.168.0.103:6379 & -web.listenaddress 192.168.0.103:9121
(3)prometheus配置文件中加入redis监控并重启vim /usr/local/Prometheus/prometheus.yml
默认redis-exporter端口为9121- job_name: 'Redis'
static_configs:
- targets: ['192.168.0.103:9121']
(4)grafana导入画好的dashboard链接:https://pan.baidu.com/s/1LIkVC0o3lyTT59JbX0mSpg 提取码:gf1d

Prometheus + Grafana 监控(mysql 和redis)的更多相关文章
- Prometheus+Grafana监控MySQL、Redis数据库
俗话说,没有监控的系统就是在裸奔,好的监控就是运维人员的第三只手,第三只眼.本文将使用prometheus及Grafana搭建一套监控系统来监控主机及数据库(MySQL.Redis). 1. 安装G ...
- [转帖]安装prometheus+grafana监控mysql redis kubernetes等
安装prometheus+grafana监控mysql redis kubernetes等 https://www.cnblogs.com/sfnz/p/6566951.html plug 的模式进行 ...
- prometheus+grafana监控mysql
prometheus+grafana监控mysql 1.安装配置MySQL官方的 Yum Repository(有mysql只需设置监控账号即可) [root@localhost ~]# wget - ...
- 使用Prometheus+Grafana监控MySQL实践
一.介绍Prometheus Prometheus(普罗米修斯)是一套开源的监控&报警&时间序列数据库的组合,起始是由SoundCloud公司开发的.随着发展,越来越多公司和组织接受采 ...
- prometheus+grafana监控mysql最佳实践
导航 前言 环境准备 安装Docker 安装prometheus 安装mysqld_exporter prometheus采集数据 安装grafana grafana配置数据源 感谢您的阅读,预计阅读 ...
- 技术分享 | Prometheus+Grafana监控MySQL浅析
GreatSQL社区原创内容未经授权不得随意使用,转载请联系小编并注明来源. 简介 Prometheus 一套开源的监控&报警&时间序列数据库的组合,通常 Kubernetes 中都会 ...
- 安装prometheus+grafana监控mysql redis kubernetes等
1.prometheus安装 wget https://github.com/prometheus/prometheus/releases/download/v1.5.2/prometheus-1.5 ...
- prometheus+grafana监控redis
prometheus+grafana监控redis redis安装配置 https://www.cnblogs.com/autohome7390/p/6433956.html redis_export ...
- Prometheus + Grafana 监控系统搭
本文主要介绍基于Prometheus + Grafana 监控Linux服务器. 一.Prometheus 概述(略) 与其他监控系统对比 1 Prometheus vs. Zabbix Zabbix ...
随机推荐
- VS2019制作的安装包,默认安装到C盘快捷方式无法打开
先讲讲如何制作安装包 1.下载Visual Studio Installer 1)下载链接https://marketplace.visualstudio.com/items?itemName=Vis ...
- RabbitMQ系列之【CentOS6.5安装RabbitMQ】
环境准备 操作系统:CentOS 6.5 Final RabbitMQ: 3.1.5 Python: 2.7.11 ErLang: R16B02 安装预环境(少什么安装什么) yum -y insta ...
- Python基础——爬虫以及简单的数据分析
目标:使用Python编写爬虫,获取链家青岛站的房产信息,然后对爬取的房产信息进行分析. 环境:win10+python3.8+pycharm Python库: import requests imp ...
- Water Testing【皮克定理,多边形面积,线段上点的数目】
Water Testing 传送门:链接 来源:UPC 9656 题目描述 You just bought a large piece of agricultural land, but you n ...
- [搬运]Intellij IDEA 汉化
Github地址: https://github.com/pingfangx/TranslatorX
- GetLastError返回值含义
GetLastError的返回值的含义: (0)-操作成功完成. (1)-功能错误. (2)- 系统找不到指定的文件. (3)-系统找不到指定的路径. (4)-系统无法打开文件. (5)-拒绝访问. ...
- ca72a_c++_标准IO库:面向对象的标准库
/*ca72a_c++_标准IO库:面向对象的标准库继承:基类->派生类3个头文件9个标准库类型IO对象不可复制或赋值 ofstream, f--file,文件输出流ostringstream, ...
- 07.DRF-序列化
Serializer序列化器 序列化器的作用: 进行数据的校验 对数据对象进行转换 一.定义Serializer 1.1 定义方法 Django REST framework中的Serializer使 ...
- Java并发编程-Unsafe实现原理与Unsafe应用解析
前言 Unsafe是位于sun.misc包下的一个类,主要提供一些用于执行低级别.不安全操作的方法,如直接访问系统内存资源.自主管理内存资源等,这些方法在提升Java运行效率.增强Java语言底层资源 ...
- 使用word2016发有代码高亮的博客
复制使用notepad++,eclipse这类有高亮的编辑器编写的代码到word中是默认有高亮的. 测试有没有代码高亮(eclipse代码): package p_day1; public class ...