spark的运行指标监控
sparkUi的4040界面已经有了运行监控指标,为什么我们还要自定义存入redis?
1.结合自己的业务,可以将监控页面集成到自己的数据平台内,方便问题查找,邮件告警
2.可以在sparkUi的基础上,添加一些自己想要指标统计
一、spark的SparkListener
sparkListener是一个接口,我们使用时需要自定义监控类实现sparkListener接口中的各种抽象方法,SparkListener 下各个事件对应的函数名非常直白,即如字面所表达意思。 想对哪个阶段的事件做一些自定义的动作,变继承SparkListener实现对应的函数即可,这些方法会帮助我监控spark运行时各个阶段的数据量,从而我们可以获得这些监控指标数据
abstract class SparkListener extends SparkListenerInterface {
//stage完成的时调用

  override def onStageCompleted(stageCompleted: SparkListenerStageCompleted): Unit = { }


//stage提交时调用

  override def onStageSubmitted(stageSubmitted: SparkListenerStageSubmitted): Unit = { }

  override def onTaskStart(taskStart: SparkListenerTaskStart): Unit = { }

  override def onTaskGettingResult(taskGettingResult: SparkListenerTaskGettingResult): Unit = { }

//task结束时调用

  override def onTaskEnd(taskEnd: SparkListenerTaskEnd): Unit = { }

  override def onJobStart(jobStart: SparkListenerJobStart): Unit = { }

  override def onJobEnd(jobEnd: SparkListenerJobEnd): Unit = { }

  override def onEnvironmentUpdate(environmentUpdate: SparkListenerEnvironmentUpdate): Unit = { }

  override def onBlockManagerAdded(blockManagerAdded: SparkListenerBlockManagerAdded): Unit = { }

  override def onBlockManagerRemoved(

      blockManagerRemoved: SparkListenerBlockManagerRemoved): Unit = { }

  override def onUnpersistRDD(unpersistRDD: SparkListenerUnpersistRDD): Unit = { }

  override def onApplicationStart(applicationStart: SparkListenerApplicationStart): Unit = { }

  override def onApplicationEnd(applicationEnd: SparkListenerApplicationEnd): Unit = { }

  override def onExecutorMetricsUpdate(

      executorMetricsUpdate: SparkListenerExecutorMetricsUpdate): Unit = { }

  override def onExecutorAdded(executorAdded: SparkListenerExecutorAdded): Unit = { }

  override def onExecutorRemoved(executorRemoved: SparkListenerExecutorRemoved): Unit = { }

  override def onBlockUpdated(blockUpdated: SparkListenerBlockUpdated): Unit = { }

  override def onOtherEvent(event: SparkListenerEvent): Unit = { }

}
1.实现自己SparkListener,对onTaskEnd方法是指标存入redis
(1)SparkListener是一个接口,创建一个MySparkAppListener类继承SparkListener,实现里面的onTaskEnd即可
(2)方法:override def onTaskEnd(taskEnd: SparkListenerTaskEnd): Unit = { }
SparkListenerTaskEnd类:
case class SparkListenerTaskEnd(

                                 //spark的stageId

                                 stageId: Int,

                                 //尝试的阶段Id(也就是下级Stage?)

                                 stageAttemptId: Int,

                                 taskType: String,

                                 reason: TaskEndReason,

                                 //task信息

                                 taskInfo: TaskInfo,

                                 // task指标

                                 @Nullable taskMetrics: TaskMetrics)

  extends SparkListenerEvent
(3)在 onTaskEnd方法内可以通过成员taskinfo与taskMetrics获取的信息
/**
 * 1、taskMetrics
 * 2、shuffle
 * 3、task运行(input output)
 * 4、taskInfo
 **/
(4)TaskMetrics可以获取的监控信息
class TaskMetrics private[spark] () extends Serializable {

  // Each metric is internally represented as an accumulator

  private val _executorDeserializeTime = new LongAccumulator

  private val _executorDeserializeCpuTime = new LongAccumulator

  private val _executorRunTime = new LongAccumulator

  private val _executorCpuTime = new LongAccumulator

  private val _resultSize = new LongAccumulator

  private val _jvmGCTime = new LongAccumulator

  private val _resultSerializationTime = new LongAccumulator

  private val _memoryBytesSpilled = new LongAccumulator

  private val _diskBytesSpilled = new LongAccumulator

  private val _peakExecutionMemory = new LongAccumulator

  private val _updatedBlockStatuses = new CollectionAccumulator[(BlockId, BlockStatus)]

val inputMetrics: InputMetrics = new InputMetrics()

/**

 * Metrics related to writing data externally (e.g. to a distributed filesystem),

 * defined only in tasks with output.

 */

val outputMetrics: OutputMetrics = new OutputMetrics()

/**

 * Metrics related to shuffle read aggregated across all shuffle dependencies.

 * This is defined only if there are shuffle dependencies in this task.

 */

val shuffleReadMetrics: ShuffleReadMetrics = new ShuffleReadMetrics()

/**

 * Metrics related to shuffle write, defined only in shuffle map stages.

 */

val shuffleWriteMetrics: ShuffleWriteMetrics = new ShuffleWriteMetrics()
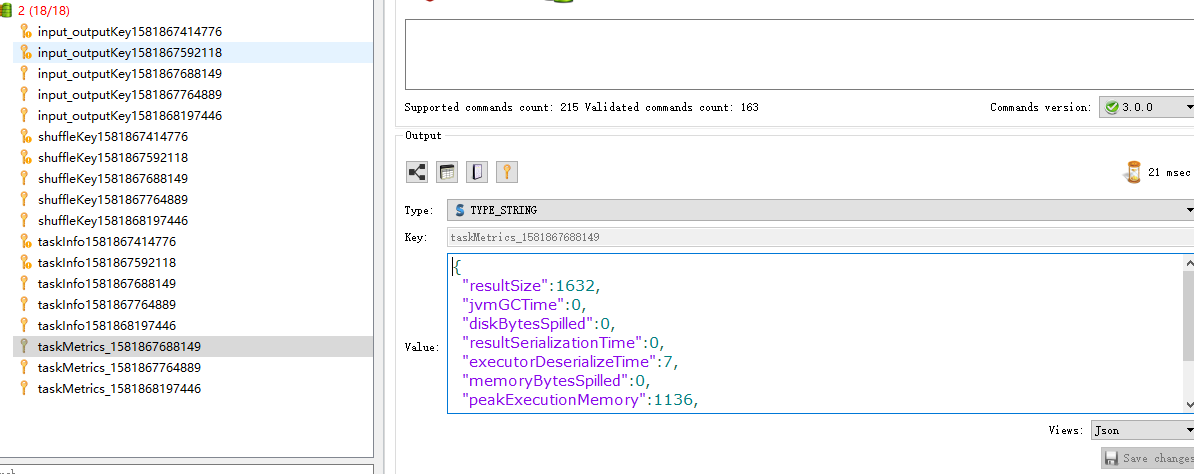
(5)代码实现并存入redis
/**

 * 需求1.想自定义spark的job运行情况存入redis,集成到自己的业务后台展示中

 */

class MySparkAppListener extends SparkListener with Logging {

  val redisConf = "jedisConfig.properties"

  val jedis: Jedis = JedisUtil.getInstance().getJedis

  //父类的第一个方法

  override def onTaskEnd(taskEnd: SparkListenerTaskEnd): Unit = {

    //在 onTaskEnd方法内可以获取的信息有

    /**

     * 1、taskMetrics

     * 2、shuffle

     * 3、task运行(input output)

     * 4、taskInfo

     **/

    val currentTimestamp = System.currentTimeMillis()

    // TaskMetrics(task的指标)可以拿到的指标

    /**

     * private val _executorDeserializeTime = new LongAccumulator

     * private val _executorDeserializeCpuTime = new LongAccumulator

     * private val _executorRunTime = new LongAccumulator

     * private val _executorCpuTime = new LongAccumulator

     * private val _resultSize = new LongAccumulator

     * private val _jvmGCTime = new LongAccumulator

     * private val _resultSerializationTime = new LongAccumulator

     * private val _memoryBytesSpilled = new LongAccumulator

     * private val _diskBytesSpilled = new LongAccumulator

     * private val _peakExecutionMemory = new LongAccumulator

     * private val _updatedBlockStatuses = new CollectionAccumulator[(BlockId, BlockStatus)]

     */

    val metrics = taskEnd.taskMetrics

    val taskMetricsMap = scala.collection.mutable.HashMap(

      "executorDeserializeTime" -> metrics.executorDeserializeTime, //executor的反序列化时间

      "executorDeserializeCpuTime" -> metrics.executorDeserializeCpuTime, //executor的反序列化的 cpu时间

      "executorRunTime" -> metrics.executorRunTime, //executoor的运行时间

      "resultSize" -> metrics.resultSize, //结果集大小

      "jvmGCTime" -> metrics.jvmGCTime, //

      "resultSerializationTime" -> metrics.resultSerializationTime,

      "memoryBytesSpilled" -> metrics.memoryBytesSpilled, //内存溢写的大小

      "diskBytesSpilled" -> metrics.diskBytesSpilled, //溢写到磁盘的大小

      "peakExecutionMemory" -> metrics.peakExecutionMemory //executor的最大内存

    )

    val jedisKey = "taskMetrics_" + {

      currentTimestamp

    }

    jedis.set(jedisKey, Json(DefaultFormats).write(jedisKey))

    jedis.pexpire(jedisKey, 3600)

    //======================shuffle指标================================

    val shuffleReadMetrics = metrics.shuffleReadMetrics

    val shuffleWriteMetrics = metrics.shuffleWriteMetrics

    //shuffleWriteMetrics shuffle读过程的指标有这些

    /**

     * private[executor] val _bytesWritten = new LongAccumulator

     * private[executor] val _recordsWritten = new LongAccumulator

     * private[executor] val _writeTime = new LongAccumulator

     */

    //shuffleReadMetrics shuffle写过程的指标有这些

    /**

     * private[executor] val _remoteBlocksFetched = new LongAccumulator

     * private[executor] val _localBlocksFetched = new LongAccumulator

     * private[executor] val _remoteBytesRead = new LongAccumulator

     * private[executor] val _localBytesRead = new LongAccumulator

     * private[executor] val _fetchWaitTime = new LongAccumulator

     * private[executor] val _recordsRead = new LongAccumulator

     */

    val shuffleMap = scala.collection.mutable.HashMap(

      "remoteBlocksFetched" -> shuffleReadMetrics.remoteBlocksFetched, //shuffle远程拉取数据块

      "localBlocksFetched" -> shuffleReadMetrics.localBlocksFetched, //本地块拉取

      "remoteBytesRead" -> shuffleReadMetrics.remoteBytesRead, //shuffle远程读取的字节数

      "localBytesRead" -> shuffleReadMetrics.localBytesRead, //读取本地数据的字节

      "fetchWaitTime" -> shuffleReadMetrics.fetchWaitTime, //拉取数据的等待时间

      "recordsRead" -> shuffleReadMetrics.recordsRead, //shuffle读取的记录总数

      "bytesWritten" -> shuffleWriteMetrics.bytesWritten, //shuffle写的总大小

      "recordsWritte" -> shuffleWriteMetrics.recordsWritten, //shuffle写的总记录数

      "writeTime" -> shuffleWriteMetrics.writeTime

    )

    val shuffleKey = s"shuffleKey${currentTimestamp}"

    jedis.set(shuffleKey, Json(DefaultFormats).write(shuffleMap))

    jedis.expire(shuffleKey, 3600)

    //=================输入输出========================

    val inputMetrics = taskEnd.taskMetrics.inputMetrics

    val outputMetrics = taskEnd.taskMetrics.outputMetrics

    val input_output = scala.collection.mutable.HashMap(

      "bytesRead" -> inputMetrics.bytesRead, //读取的大小

      "recordsRead" -> inputMetrics.recordsRead, //总记录数

      "bytesWritten" -> outputMetrics.bytesWritten,//输出的大小

      "recordsWritten" -> outputMetrics.recordsWritten//输出的记录数

    )

    val input_outputKey = s"input_outputKey${currentTimestamp}"

    jedis.set(input_outputKey, Json(DefaultFormats).write(input_output))

    jedis.expire(input_outputKey, 3600)

    //####################taskInfo#######

    val taskInfo: TaskInfo = taskEnd.taskInfo

    val taskInfoMap = scala.collection.mutable.HashMap(

      "taskId" -> taskInfo.taskId ,

      "host" -> taskInfo.host ,

      "speculative" -> taskInfo.speculative , //推测执行

      "failed" -> taskInfo.failed ,

      "killed" -> taskInfo.killed ,

      "running" -> taskInfo.running

    )

    val taskInfoKey = s"taskInfo${currentTimestamp}"

    jedis.set(taskInfoKey , Json(DefaultFormats).write(taskInfoMap))

    jedis.expire(taskInfoKey , 3600)

  }
(5)程序测试
sparkContext.addSparkListener方法添加自己监控主类
sc.addSparkListener(new MySparkAppListener())

使用wordcount进行简单测试
二、spark实时监控
1.StreamingListener是实时监控的接口,里面有数据接收成功、错误、停止、批次提交、开始、完成等指标,原理与上述相同
trait StreamingListener {

  /** Called when a receiver has been started */

  def onReceiverStarted(receiverStarted: StreamingListenerReceiverStarted) { }

  /** Called when a receiver has reported an error */

  def onReceiverError(receiverError: StreamingListenerReceiverError) { }

  /** Called when a receiver has been stopped */

  def onReceiverStopped(receiverStopped: StreamingListenerReceiverStopped) { }

  /** Called when a batch of jobs has been submitted for processing. */

  def onBatchSubmitted(batchSubmitted: StreamingListenerBatchSubmitted) { }

  /** Called when processing of a batch of jobs has started.  */

  def onBatchStarted(batchStarted: StreamingListenerBatchStarted) { }

  /** Called when processing of a batch of jobs has completed. */

  def onBatchCompleted(batchCompleted: StreamingListenerBatchCompleted) { }

  /** Called when processing of a job of a batch has started. */

  def onOutputOperationStarted(

      outputOperationStarted: StreamingListenerOutputOperationStarted) { }

  /** Called when processing of a job of a batch has completed. */

  def onOutputOperationCompleted(

      outputOperationCompleted: StreamingListenerOutputOperationCompleted) { }

}
2.主要指标及用途
1.onReceiverError
监控数据接收错误信息,进行邮件告警
2.onBatchCompleted 该批次完成时调用该方法
(1)sparkstreaming的偏移量提交时,当改批次执行完,才进行offset的保存入库,(该无法保证统计入库完成后程序中断、offset未提交)
(2)批次处理时间大于了规定的窗口时间,程序出现阻塞,进行邮件告警
三、spark、yarn的web返回接口进行数据解析,获取指标信息

1.启动某个本地spark程序
访问 :http://localhost:4040/metrics/json/,得到一串json数据,解析gauges,则可获取所有的信息
{

    "version": "3.0.0",

    "gauges": {

        "local-1581865176069.driver.BlockManager.disk.diskSpaceUsed_MB": {

            "value": 0

        },

        "local-1581865176069.driver.BlockManager.memory.maxMem_MB": {

            "value": 1989

        },

        "local-1581865176069.driver.BlockManager.memory.memUsed_MB": {

            "value": 0

        },

        "local-1581865176069.driver.BlockManager.memory.remainingMem_MB": {

            "value": 1989

        },

        "local-1581865176069.driver.DAGScheduler.job.activeJobs": {

            "value": 0

        },

        "local-1581865176069.driver.DAGScheduler.job.allJobs": {

            "value": 0

        },

        "local-1581865176069.driver.DAGScheduler.stage.failedStages": {

            "value": 0

        },

        "local-1581865176069.driver.DAGScheduler.stage.runningStages": {

            "value": 0

        },

        "local-1581865176069.driver.DAGScheduler.stage.waitingStages": {

            "value": 0

        }

    },

    "counters": {

        "local-1581865176069.driver.HiveExternalCatalog.fileCacheHits": {

            "count": 0

        },

        "local-1581865176069.driver.HiveExternalCatalog.filesDiscovered": {

            "count": 0

        },

        "local-1581865176069.driver.HiveExternalCatalog.hiveClientCalls": {

            "count": 0

        },

        "local-1581865176069.driver.HiveExternalCatalog.parallelListingJobCount": {

            "count": 0

        },

        "local-1581865176069.driver.HiveExternalCatalog.partitionsFetched": {

            "count": 0

        }

    },

    "histograms": {

        "local-1581865176069.driver.CodeGenerator.compilationTime": {

            "count": 0,

            "max": 0,

            "mean": 0,

            "min": 0,

            "p50": 0,

            "p75": 0,

            "p95": 0,

            "p98": 0,

            "p99": 0,

            "p999": 0,

            "stddev": 0

        },

        "local-1581865176069.driver.CodeGenerator.generatedClassSize": {

            "count": 0,

            "max": 0,

            "mean": 0,

            "min": 0,

            "p50": 0,

            "p75": 0,

            "p95": 0,

            "p98": 0,

            "p99": 0,

            "p999": 0,

            "stddev": 0

        },

        "local-1581865176069.driver.CodeGenerator.generatedMethodSize": {

            "count": 0,

            "max": 0,

            "mean": 0,

            "min": 0,

            "p50": 0,

            "p75": 0,

            "p95": 0,

            "p98": 0,

            "p99": 0,

            "p999": 0,

            "stddev": 0

        },

        "local-1581865176069.driver.CodeGenerator.sourceCodeSize": {

            "count": 0,

            "max": 0,

            "mean": 0,

            "min": 0,

            "p50": 0,

            "p75": 0,

            "p95": 0,

            "p98": 0,

            "p99": 0,

            "p999": 0,

            "stddev": 0

        }

    },

    "meters": { },

    "timers": {

        "local-1581865176069.driver.DAGScheduler.messageProcessingTime": {

            "count": 0,

            "max": 0,

            "mean": 0,

            "min": 0,

            "p50": 0,

            "p75": 0,

            "p95": 0,

            "p98": 0,

            "p99": 0,

            "p999": 0,

            "stddev": 0,

            "m15_rate": 0,

            "m1_rate": 0,

            "m5_rate": 0,

            "mean_rate": 0,

            "duration_units": "milliseconds",

            "rate_units": "calls/second"

        }

    }

}
解析json获取指标信息
    val diskSpaceUsed_MB = gauges.getJSONObject(applicationId + ".driver.BlockManager.disk.diskSpaceUsed_MB").getLong("value")//使用的磁盘空间

    val maxMem_MB = gauges.getJSONObject(applicationId + ".driver.BlockManager.memory.maxMem_MB").getLong("value") //使用的最大内存

    val memUsed_MB = gauges.getJSONObject(applicationId + ".driver.BlockManager.memory.memUsed_MB").getLong("value")//内存使用情况

    val remainingMem_MB = gauges.getJSONObject(applicationId + ".driver.BlockManager.memory.remainingMem_MB").getLong("value") //闲置内存

    //#####################stage###################################

    val activeJobs = gauges.getJSONObject(applicationId + ".driver.DAGScheduler.job.activeJobs").getLong("value")//当前正在运行的job

    val allJobs = gauges.getJSONObject(applicationId + ".driver.DAGScheduler.job.allJobs").getLong("value")//总job数

    val failedStages = gauges.getJSONObject(applicationId + ".driver.DAGScheduler.stage.failedStages").getLong("value")//失败的stage数量

    val runningStages = gauges.getJSONObject(applicationId + ".driver.DAGScheduler.stage.runningStages").getLong("value")//正在运行的stage

    val waitingStages = gauges.getJSONObject(applicationId + ".driver.DAGScheduler.stage.waitingStages").getLong("value")//等待运行的stage

    //#####################StreamingMetrics###################################

    val lastCompletedBatch_processingDelay = gauges.getJSONObject(applicationId + ".driver.query.StreamingMetrics.streaming.lastCompletedBatch_processingDelay").getLong("value")// 最近批次执行的延迟时间

    val lastCompletedBatch_processingEndTime = gauges.getJSONObject(applicationId + ".driver.query.StreamingMetrics.streaming.lastCompletedBatch_processingEndTime").getLong("value")//最近批次执行结束时间(毫秒为单位)

    val lastCompletedBatch_processingStartTime = gauges.getJSONObject(applicationId + ".driver.query.StreamingMetrics.streaming.lastCompletedBatch_processingStartTime").getLong("value")//最近批次开始执行时间

    //执行时间

    val lastCompletedBatch_processingTime = (lastCompletedBatch_processingEndTime - lastCompletedBatch_processingStartTime)

    val lastReceivedBatch_records = gauges.getJSONObject(applicationId + ".driver.query.StreamingMetrics.streaming.lastReceivedBatch_records").getLong("value")//最近批次接收的数量

    val runningBatches = gauges.getJSONObject(applicationId + ".driver.query.StreamingMetrics.streaming.runningBatches").getLong("value")//正在运行的批次

    val totalCompletedBatches = gauges.getJSONObject(applicationId + ".driver.query.StreamingMetrics.streaming.totalCompletedBatches").getLong("value")//完成的数据量

    val totalProcessedRecords = gauges.getJSONObject(applicationId + ".driver.query.StreamingMetrics.streaming.totalProcessedRecords").getLong("value")//总处理条数

    val totalReceivedRecords = gauges.getJSONObject(applicationId + ".driver.query.StreamingMetrics.streaming.totalReceivedRecords").getLong("value")//总接收条数

    val unprocessedBatches = gauges.getJSONObject(applicationId + ".driver.query.StreamingMetrics.streaming.unprocessedBatches").getLong("value")//为处理的批次

    val waitingBatches = gauges.getJSONObject(applicationId + ".driver.query.StreamingMetrics.streaming.waitingBatches").getLong("value")//处于等待状态的批次
2.spark提交至yarn
   val sparkDriverHost = sc.getConf.get("spark.org.apache.hadoop.yarn.server.webproxy.amfilter.AmIpFilter.param.PROXY_URI_BASES")

    //监控信息页面路径为集群路径+/proxy/+应用id+/metrics/json

  val url = s"${sparkDriverHost}/metrics/json"
3.作用
1.该job(endTime, applicationUniqueName, applicationId, sourceCount, costTime, countPerMillis)可以做表格,做链路统计
2.磁盘与内存信息做饼图,用来对内存和磁盘的监控
3.程序task的运行情况做表格,用来对job的监控
spark的运行指标监控的更多相关文章
- 通过案例对 spark streaming 透彻理解三板斧之三:spark streaming运行机制与架构
本期内容: 1. Spark Streaming Job架构与运行机制 2. Spark Streaming 容错架构与运行机制 事实上时间是不存在的,是由人的感官系统感觉时间的存在而已,是一种虚幻的 ...
- Linux 服务器运行健康状况监控利器 Spotlight on Unix 的安装与使用
1.本文背景 1.1.Linux 服务器情况 # cat /etc/issueRed Hat Enterprise Linux Server release 6.1 (Santiago)Kernel ...
- Spark程序运行常见错误解决方法以及优化
转载自:http://bigdata.51cto.com/art/201704/536499.htm Spark程序运行常见错误解决方法以及优化 task倾斜原因比较多,网络io,cpu,mem都有可 ...
- Spark的 运行模式详解
Spark的运行模式是多种多样的,那么在这篇博客中谈一下Spark的运行模式 一:Spark On Local 此种模式下,我们只需要在安装Spark时不进行hadoop和Yarn的环境配置,只要将S ...
- SpringBoot第十二集:度量指标监控与异步调用(2020最新最易懂)
SpringBoot第十二集:度量指标监控与异步调用(2020最新最易懂) Spring Boot Actuator是spring boot项目一个监控模块,提供了很多原生的端点,包含了对应用系统的自 ...
- 图解JanusGraph系列 - JanusGraph指标监控报警(Monitoring JanusGraph)
大家好,我是洋仔,JanusGraph图解系列文章,实时更新~ 图数据库文章总目录: 整理所有图相关文章,请移步(超链):图数据库系列-文章总目录 源码分析相关可查看github(码文不易,求个sta ...
- 【03】SpringBoot2核心技术-核心功能—数据访问_单元测试_指标监控
3.数据访问(SQL) 3.1 数据库连接池的自动配置-HikariDataSource 1.导入JDBC场景 <dependency> <groupId>org.spring ...
- 业务监控-指标监控(v1)
最近做了指标监控系统的后台,包括需求调研.代码coding.调试调优测试等,穿插其他杂事等前后花了一个月左右. 指标监控指的是用户通过接口上传某些指标信息,并且通过配置阈值公式和告警规则等信息监测自己 ...
- 通过案例对 spark streaming 透彻理解三板斧之二:spark streaming运行机制
本期内容: 1. Spark Streaming架构 2. Spark Streaming运行机制 Spark大数据分析框架的核心部件: spark Core.spark Streaming流计算. ...
随机推荐
- PyQt(Python+Qt)学习随笔:QListWidgetItem的重要方法
老猿Python博文目录 专栏:使用PyQt开发图形界面Python应用 老猿Python博客地址 QListWidgetItem类为QListWidget类提供构成QListWidget列表部件的项 ...
- 第十二章、Designer中的menu菜单、toolBar工具栏和Action动作
老猿Python博文目录 专栏:使用PyQt开发图形界面Python应用 老猿Python博客地址 一.引言 Qt Designer中的部件栏并没有菜单.toolBar以及Action相关的部件,仅在 ...
- PyQt(Python+Qt)学习随笔:复选框checkBox的tristate属性
在Qt Designer中,tristate属性是复选框checkBox相比较于QAbstractButton多出来的唯一属性. tristate属性表示复选框是三种状态还是两种状态,如果trista ...
- PyQt(Python+Qt)学习随笔:窗口部件大小策略sizePolicy与SizeConstraint布局大小约束的关系
在<PyQt(Python+Qt)学习随笔:Qt Designer中部件的三个属性sizeHint缺省尺寸.minimumSizeHint建议最小尺寸和minimumSize最小尺寸>. ...
- 【题解】「UVA11626」Convex Hull
凸包模板题. 之前写过拿 Graham 算法求凸包的,为了不重复/多学点知识,那这次拿 Andrew 算法求凸包吧qaq *此文章所有图片均为作者手画. Andrew 算法 假设我们有这些点: 首先把 ...
- basic english
color/visual see look color dark light beautiful shade black blue brown clear gray green orange red ...
- 【译】为什么Rust中的BTreeMap没有with_capacity()方法?
原文标题:Why doesn't Rust's BTreeMap have a with_capacity() method? 原文链接:https://www.nicolas-hahn.com/20 ...
- 算法——寻找第K个最大的数
在未排序的数组中找到第 k 个最大的元素. 链接: leetcode. 解题思路:通过快速排序的思想方法,每次随机获取指定范围内一个树的排序位置,然后根据这个位置,再重新指定范围,直到这个位置索引满足 ...
- nginx学习之——信号控制和配置
一.信号控制 1)TERM, INT Quick shutdown \\麻溜停掉(暴力停止),一般不常用 // 启动和停止nginx 当前目录:/usr/local/bin/nginx 启动: ...
- Hadoop框架:Yarn基本结构和运行原理
本文源码:GitHub·点这里 || GitEE·点这里 一.Yarn基本结构 Hadoop三大核心组件:分布式文件系统HDFS.分布式计算框架MapReduce,分布式集群资源调度框架Yarn.Ya ...