Firebug: Net Panel 使用详解
Since there is not much user documentation related to Firebug features (and there is a lot what to know about) I have decided to put together several posts about existing features.
This post is intended as a detailed explanation of the Net panel from the user perspective. This post is not about developing an extension for this panel or Firebug itself. Also notice that all features described below are available (some of them introduced) in Firebug 1.4.
You'll be surprised how many features is there! ![]()
Net Panel Overview
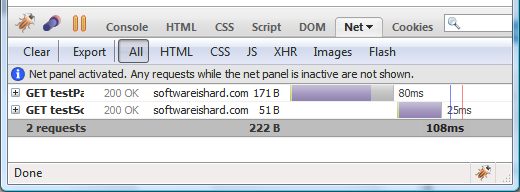
The main purpose of the Net panel is to monitor HTTP traffic initiated by a web page and simply present all collected and computed information to the user. It's content is composed from list of entries where each entry represents one request/response round trip made by the page.

Click the image to get full size.
The image above shows the result from a page that sent two network
requests to the server in order to load. The first request is for the
top testPage1.htm document (the page itself) and the second for embedded testScript1.js script file.
If you have Firebug installed enable Net panel and click here to see the example live.
Each entry displays basic info about the request and a graphical Timeline that depicts load phases in time. For now it's enough to say that it took 80ms to load the page testPage.htm and after it was loaded the script file testScript.js started to load, which took another 25ms (see more info about the Timeline below).
Following info is displayed:
- HTTP request method (GET).
- Response status and description (200 OK).
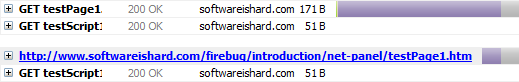
- Requested file name (testPage1.htm) And if the mouse cursor moves over it, entire URL is displayed.
- Domain name from where the response came from (softwareishard.com).
- Size of the response (171 B).
- Graphical timeline and load time info (80ms).
There is also a summary info at the bottom of the request list.

This summary simply says:
- The page initiated two requests.
- The size of the requested data is 222 B.
- The total page load time was 108 milliseconds (since the beginning of the first request to the end of the last request).
Not to forget, there is a message at the top of the list explaining
that if the panel isn't enabled nothing is monitored. This is important
since if the user isn't interested in HTTP tracking, there are no
performance penalties if the panel is disabled.

This message is appended into the list of request every time the
panel is disabled and enabled again so, it's obvious that some requests
doesn't have to be displayed.
Net Request & Response Details
Every request entry can be expanded by clicking on the left hand plus button in order to see additional info. It's important to note that the entry actually represents both: the request sent to the server and also the response
coming back. No matter if it comes from the server or the browser
cache, one request-response round-trip is represented by one entry in
the list.
Click on the following screenshot to see all headers.
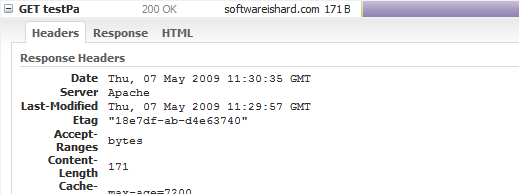
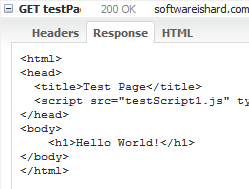
The expanded body has following tabs:
- Headers - request and response HTTP headers
- Response - data returned from the server.
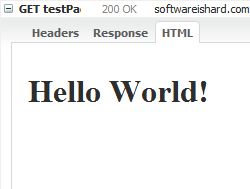
- HTML - preview of an HTML response (available only if the response is an HTML).
The other tabs look like as follows:
 |
 |
URL Parameters
If a network request uses a query string (URL parameters), another Params tab is available providing tabular info about all specified parameters.
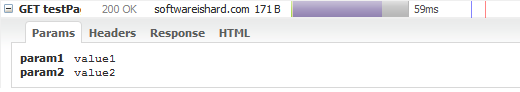
The example above shows parameters for the following URL:
http://www.softwareishard.com/firebug/introduction/net-panel/testPage1.htm?param1=value1¶m2=value2
Clik here for live example.
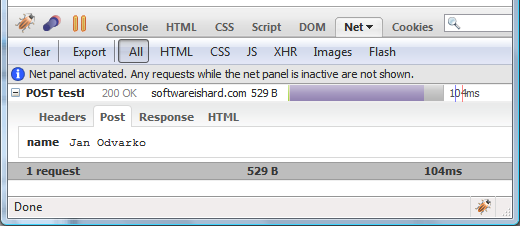
POST & PUT Requests
If the requests is sending any data using POST or PUT HTTP method, there is another tab with sent data.
Click here for a live example.
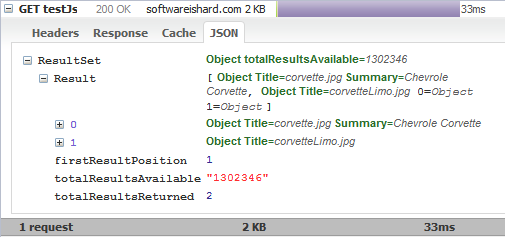
JSON Responses
In case of a JSON response, there is yet another tab that uses expandable hierarchical tree to display all received data.
A live example is available.
Browser Cache
If a network response comes from the browser cache, there is a Cache tab, showing an info that is related to the appropriate cache-entry.
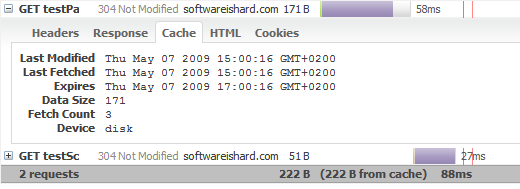
The image above shows a case when both requests came from the browser cache - response status is 304 Not Modified. Also, the summary row shows amount of data coming from the cache.
Further, there is following info:
- Last Modified - last time the cache entry was modified
- Last Fetched - last time the cache entry was opened
- Expires - expiration time of the cache entry
- Data Size - cache entry data size
- Fetch Count - number of times the cache entry has been opened
- Device - id for the device that stores this cache entry
Cookies
There can be also other tabs coming from Firebug extensions. An example is a Cookies tab that shows all send and received cookies for a request. This tab comes from a Firecookie extension.
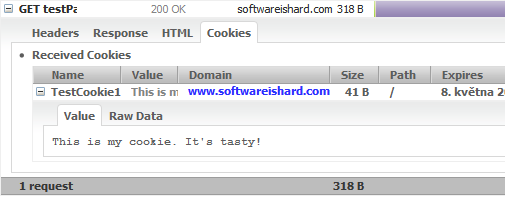
An example page is here.
Not to forget, in order to have this tab, you need the Firecookie extension installed.
Timeline
One of the most useful features for debugging page load performance is a request Timeline. Net panel uses this graphical representation to show request load in time together with timing data.
If you move mouse over the graph there is a detailed tooltip info. See the following screenshot:
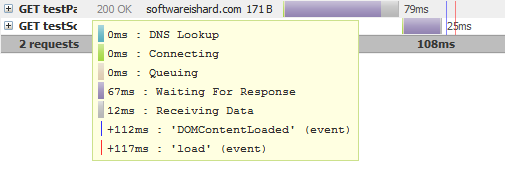
Every request-response round trip is composed from a several phases, represented by different color in the graph:
- DNS Lookup - DNS resolution time
- Connection - elapsed time required to create a TCP connection
- Queuing - elapsed time spent in a browser queue waiting for a network connection
- Waiting For Response - waiting for a response from the server
- Receiving Data - elapsed time required to read entire response from the server (and/
or time required to read from cache). - DomContentLoaded event - time when DomContentLoad event was fired (since the beginning of the request, can be negative if the request has been started after the event)
- load event - time when page load
event was fired (since the beginning of the request, can be negative if
the request has been started after the event)
See also a post dedicated to HTTP timings in Firebug 1.5.
Search
The net panel also uses Firebug's Search Box that can be used to search panel's content and also response bodies.
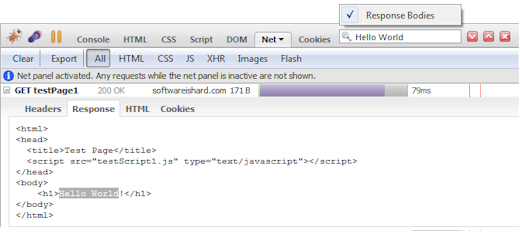
Click the image to enlarge.
As you type into the Firebug search box, an option menu automatically pops up allowing to set a Response Bodies
option so, the panel looks for the searched text even within returned
responses. Entries automatically expand if the text is found inside and
the occurrence is also selected in the UI. The search is automatically case sensitive if the searched text contains any capital letters.
Toolbar
Let's also quickly explain all the available toolbar buttons.

- Clear - removes all entries.
- Export* - Exports all HTTP tracing data into a HTTP Archive file (*.har)
- All (filter) - all requests are displayed.
- HTML (filter) - only HTML requests are displayed
- CSS (filter) - only CSS requests are displayed
- JS (filter) - only Javascript requests are displayed
- XHR (filter) - only dynamic requests (using XMLHttpRequest) are displayed
- Images (filter) - only image requests are displayed
- Flash (filter) - only Flash requests are displayed
* This action comes from a NetExport extension. All collected and computed data presented within the Net panel can be exported in HTTP Archive format (based on JSON). There is also a viewer that can be used to preview existing *.har files.
Context Menu
There is also several useful actions available in a request context menu.
If you right click on a request entry you should see something like as
follows (the list of actions depends on the type of clicked request):
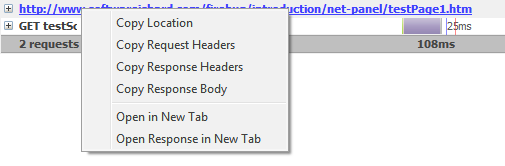
- Copy Location - copy request URL into the clipboard
- Copy Request Headers - copy all request headers into the clipboard
- Copy Response Headers - copy all response headers into the clipboard
- Copy Response Body - copy response body into the clipboard
- Open in New Tab - open response in a new browser tab (the request can be sent to the server again)
- Open Response in New Tab - open response body in a new tab (cached response is always used)
Firebug: Net Panel 使用详解的更多相关文章
- Firebug Console Panel 控制台详解【转载+整理】
本文内容 信息显示 信息显示的占位符 console.group 和 console.groupEnd 分组显示 console.dir console.dirxml console.assert c ...
- 使用Firebug进行断点调试详解
利用Firebug我们可以非常方便地对网页上的任何JavaScript代码进行断点调试. 首先,使用快捷键F12在当前页面打开Firebug,并切换到脚本选项卡. 其次,我们需要为指定的js代码添加断 ...
- Firebug控制台详解
转自:http://www.ruanyifeng.com/blog/2011/03/firebug_console_tutorial.html 作者: 阮一峰 日期: 2011年3月26日 Fireb ...
- Javascript 调试利器 Firebug使用详解
Javascript 调试利器 Firebug使用详解 有时候,为了更清楚方便的查看输出信息,我们可能需要将一些调试信息进行分组输出,那么可以使用console.group来对信息进行分组,在组信息输 ...
- Firebug控制台详解,让调试js代码变得更简单
http://www.open-open.com/lib/view/open1373120100347.html Firebug是网页开发的利器,能够极大地提升工作效率. Firebug控制台详解 控 ...
- Firebug控制台详解(转)
本文转自:http://www.ruanyifeng.com/blog/2011/03/firebug_console_tutorial.html 作者: 阮一峰 日期: 2011年3月26日 Fir ...
- Chrome开发者工具详解(5)-Application、Security、Audits面板
Chrome开发者工具详解(5)-Application.Security.Audits面板 这篇文章是Chrome开发者工具详解这一系列的最后一篇,介绍DevTools最后的三个面板功能-Appli ...
- Console命令详解,让调试js代码变得更简单
Firebug是网页开发的利器,能够极大地提升工作效率. 但是,它不太容易上手.我曾经翻译过一篇<Firebug入门指南>,介绍了一些基本用法.今天,继续介绍它的高级用法. ======= ...
- Extjs MVC开发模式详解
Extjs MVC开发模式详解 在JS的开发过程中,大规模的JS脚本难以组织和维护,这一直是困扰前端开发人员的头等问题.Extjs为了解决这种问题,在Extjs 4.x版本中引入了MVC开发模式, ...
随机推荐
- python实现轮廓发现
目录: (一)轮廓发现的介绍 (二)代码实现 (1)使用直接使用阈值方法threshold方法获取二值化图像来选择轮廓 (2)使用canny边缘检测获取二值化图像 (一)轮廓发现的介绍与API的介绍 ...
- 分享一个工具方法:日期格式化 & 日期转化,用法与java类SimpleDateFormat类似
/** * y 年(201X) * M 年中的月份(1-12) * d 月份中的天数(1-31) * H 一天中的小时数(0-23) * h am/pm 中的小时数(1-12) * m 小时中的分钟数 ...
- CKAD认证中的部署教程
在上一章中,我们已经学会了使用 kubeadm 创建集群和加入新的节点,在本章中,将按照 CKAD 课程的方法重新部署一遍,实际上官方教程的内容不多,笔者写了两篇类似的部署方式,如果已经部署了 kub ...
- myeclipse字体大小格式的设置
- 【2020-8-21】【数字游戏】【启发式搜索IDA*】
有这么一个游戏: 写出一个1-N的排列a[i],然后每次将相邻两个数相加,构成新的序列,再对新序列进行这样的操作,显然每次构成的序列都比上一次的序列长度少1,直到只剩下一个数字位置.下面是一个例子: ...
- 洛谷 P4088 [USACO18FEB] Slingshot P(线段树+二维数点)
题目链接 题意:有一个数轴,上面有 \(n\) 个传送门,使用第 \(i\) 个传送门,你可以从 \(x_i\) 走到 \(y_i\),花费的时间为 \(t_i\) 秒.你的速度为 \(1\) 格/秒 ...
- 解决Package is not available (for R version XXX)?
目录 1. 更新R(不推荐) 2. 更改或指定镜像源 3.源码安装 安装R包时这个错误是经常见到的.我认为有几个方法可解决,记录之. 1. 更新R(不推荐) 简单粗暴的方法就是更新R,但这波及的范围太 ...
- Nginx 动态增加扩展
Nginx 动态增加扩展 1. 先查看目前nginx已加载模块 /home/nginx-1.18.0 # nginx -V nginx version: nginx/1.18.0 built by g ...
- 【Linux】CentOS下升级Python和Pip版本全自动化py脚本
[Linux]CentOS下升级Python和Pip版本全自动化py脚本 CentOS7.6自带py2.7和py3.6 想要安装其它版本的话就要自己重新下载和编译py其它版本并且配置环境,主要是软链接 ...
- Identity Server 4 从入门到落地(三)—— 创建Web客户端
书接上回,我们已经搭建好了基于Identity Server 4的认证服务和管理应用(如果还没有搭建,参看本系列前两部分,相关代码可以从github下载:https://github.com/zhen ...