Pthon Matplotlib 画图
一、普通绘图
 import matplotlib.pyplot as plt

 import numpy as np

 # 绘制普通图像

 x = np.linspace(-1, 1, 50)

 y1 = 2 * x + 1

 y2 = x**2

 plt.figure()

 # 在绘制时设置lable, 逗号是必须的

 l1, = plt.plot(x, y1, label = 'line')

 l2, = plt.plot(x, y2, label = 'parabola', color = 'red', linewidth = 1.0, linestyle = '--')

 # 设置坐标轴的取值范围

 plt.xlim((-1, 1))

 plt.ylim((0, 2))

 # 设置坐标轴的lable

 plt.xlabel('X axis')

 plt.ylabel('Y axis')

 # 设置x坐标轴刻度, 原来为0.25, 修改后为0.5

 plt.xticks(np.linspace(-1, 1, 5))

 # 设置y坐标轴刻度及标签, $$是设置字体

 plt.yticks([0, 0.5], ['$minimum$', 'normal'])

 # 设置legend

 plt.legend(handles = [l1, l2,], labels = ['a', 'b'], loc = 'best')

 plt.show()
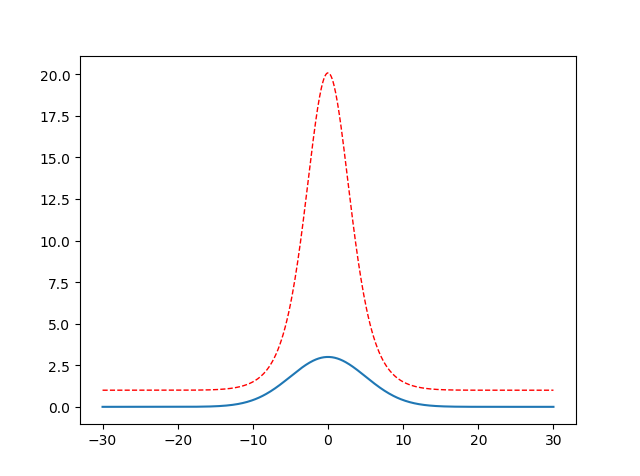
二、自定义单峰函数
 import math

 import numpy as np

 import matplotlib.pyplot as plt

 x = np.linspace(-30, 30, 500)

 y = []

 y2 = []

 a = 3

 b = 0

 c = 25

 for i in x :

     # 类似高斯函数,a 代表峰值, b对称轴位置,c方差

     temp = a * math.exp(-(i-b)**2 / (2 * c))

     y.append(temp)

     #对上一个单峰函数值进行放大处理,红色虚线部分

     y2.append(math.exp(temp))

 plt.figure()

 l1= plt.plot(x, y, label = 'line')

 l2, = plt.plot(x, y2, label = 'parabola', color = 'red', linewidth = 1.0, linestyle = '--')

 plt.show()
三、画subplot子图(2 x 2 为例)
     import matplotlib.pyplot as plt

     t=np.arange(0.0,2.0,0.1)

     s=np.sin(t*np.pi)

     plt.subplot(2,2,1) #要生成两行两列,这是第一个图plt.subplot('行','列','编号')

     plt.plot(t,s,'b--')

     plt.ylabel('y1')

     plt.subplot(2,2,2) #两行两列,这是第二个图

     plt.plot(2*t,s,'r--')

     plt.ylabel('y2')

     plt.subplot(2,2,3)#两行两列,这是第三个图

     plt.plot(3*t,s,'m--')

     plt.subplot(2,2,4)#两行两列,这是第四个图

     plt.plot(4*t,s,'k--')

     plt.show()

点图和线图
fig = plt.figure()

ax = fig.add_subplot(221, projection='3d')

ax.plot(array_normal[:,0],array_normal[:,1],array_normal[:,2])

plt.subplot(2,2,2)

plt.plot(np.arange(0,sample_len,1), signal_normal)

normal_pow = array_normal[:,2]

ax3 = fig.add_subplot(223, projection='3d')

ax3.plot(array_anomaly[:,0],array_anomaly[:,1],array_anomaly[:,2])

anomaly_pow = array_anomaly[:,2]

plt.subplot(2,2,4)

plt.scatter(np.arange(0,sample_len,1), signal_anomaly)

plt.show()

【Reference】
[1] https://www.jianshu.com/p/de223a79217a
[2] https://www.cnblogs.com/xingshansi/p/6777945.html
Pthon Matplotlib 画图的更多相关文章
- python matplotlib画图产生的Type 3 fonts字体没有嵌入问题
ScholarOne's 对python matplotlib画图产生的Type 3 fonts字体不兼容,更改措施: 在程序中添加如下语句 import matplotlib matplotlib. ...
- 使用python中的matplotlib 画图,show后关闭窗口,继续运行命令
使用python中的matplotlib 画图,show后关闭窗口,继续运行命令 在用python中的matplotlib 画图时,show()函数总是要放在最后,且它阻止命令继续往下运行,直到1.0 ...
- matplotlib 画图
matplotlib 画图 1. 画曲线图 Tompson = np.array([0, 0, 0, 0, 0.011, 0.051, 0.15, 0.251, 0.35, 0.44, 0 ...
- matplotlib画图
matplotlib画图 import numpy as np import matplotlib.pyplot as plt x1=[20,33,51,79,101,121,132,145,162, ...
- python3 使用matplotlib画图出现中文乱码的情况
python3使用matplotlib画图,因python3默认使用中unicode编码,所以在写代码时不再需要写 plt.xlabel(u’人数’),而是直接写plt.xlabel(‘人数’). 注 ...
- matplotlib画图实例:pyplot、pylab模块及作图參数
http://blog.csdn.net/pipisorry/article/details/40005163 Matplotlib.pyplot画图实例 {使用pyplot模块} matplotli ...
- python使用matplotlib画图
python使用matplotlib画图 matplotlib库是python最著名的画图库.它提供了一整套和matlab类似的命令API.十分适合交互式地进行制图. 先介绍了怎样使用matplotl ...
- matplotlib画图报错This figure includes Axes that are not compatible with tight_layout, so results might be incorrect.
之前用以下代码将实验结果用matplotlib show出来 plt.plot(np.arange(len(aver_reward_list)), aver_reward_list) plt.ylab ...
- matplotlib画图出现乱码情况
python3使用matplotlib画图,因python3默认使用中unicode编码,所以在写代码时不再需要写 plt.xlabel(u’人数’),而是直接写plt.xlabel(‘人数’). 注 ...
随机推荐
- java中关于AtomicInteger的使用
在Java语言中,++i和i++操作并不是线程安全的,在使用的时候,不可避免的会用到synchronized关键字.而AtomicInteger则通过一种线程安全的加减操作接口.咳哟参考我之前写的一篇 ...
- [C#]手把手教你打造Socket的TCP通讯连接(一)
本文章将讲解基于TCP连接的Socket通讯,使用Socket异步功能,并且无粘包现象,通过事件驱动使用. 在编写Socket代码之前,我们得要定义一下Socket的基本功能. 作为一个TCP连接,不 ...
- vue中Axios请求豆瓣API数据并展示到Swipe中
vue中Axios请求豆瓣API数据并展示到Swipe中 1.首先是安装Axios: 安装方法cnpm install axios --save 等待npm安装完毕: 2.在main.js中引入axi ...
- MySQL 大致测试更新时间
1:需求:把一个2千万条数据的一个表,随机更新其中的二十行需要大致多久? DROP TABLE IF EXISTS test20; CREATE TABLE test20( id INT AUTO_I ...
- 《Unix&Linux大学教程》学习笔记5 :正则表达式
1:Unix下正则表达式规则
- VTK拾取网格模型上的可见点
消隐与Z-Buffer 使用缓冲器记录物体表面在屏幕上投影所覆盖范围内的全部像素的深度值,依次访问屏幕范围内物体表面所覆盖的每一像素,用深度小(深度用z值表示,z值小表示离视点近)的像素点颜色替代深度 ...
- javascript arguments介绍
来源于: https://developer.mozilla.org/zh-CN/docs/Web/JavaScript/Reference/Functions/arguments https://g ...
- JavaScript绑定this
问题描述 var a = { one: 1, haha() { console.log(this.one) } } setTimeout(a.haha, 1000) 在上例中,函数haha引用了thi ...
- MySQL累积求和
有如下表 id money 1 10 2 20 3 30 4 40 求出如下数据 id money cum 1 10 10 2 20 30 3 30 60 4 40 100 建表 CREA ...
- python prettytable模块
简介 Python通过PrettyTable模块可以将输出内容如表格方式整齐地输出. 安装 pip install prettytable 1 示例 from prettytable import P ...