使用docker-compose快速部署Prometheus+grafana环境
由于最近公司服务频繁出问题,老板很生气,下面的人都很不好过,于是老大让加一下业务监控,来观察线上数据状态。
但是由于qa环境数据量太少,所以自己搭建了一套环境做相关监控,并且写了个脚本模仿生产上的数据,并且做了很多指标,写了一些Grafana的PromQL语法,网上的资料也很少,我就来补充一下,这个下一章再讲。
注意:
docker和docker-compose请自行下载安装
创建相关目录并给予权限,持久化目录需要给777权限,否则容器启动失败
cd ~ && mkdir prometheus && chmod 777 prometheus

cd prometheus && mkdir grafana_data prometheus_data && chmod 777 grafana_data prometheus_data
vim docker-compose.yml
version: "3.7"

services:

  node-exporter:

    image: prom/node-exporter:latest

    container_name: "node-exporter0"

    ports:

      - "9100:9100"

    restart: always

  prometheus:

    image: prom/prometheus:latest

    container_name: "prometheus0"

    restart: always

    ports:

      - "9090:9090"

    volumes:

      - "./prometheus.yml:/etc/prometheus/prometheus.yml"

      - "./prometheus_data:/prometheus"

  grafana:

    image: grafana/grafana

    container_name: "grafana0"

    ports:

      - "3000:3000"

    restart: always

    volumes:

      - "./grafana_data:/var/lib/grafana"
注:prometheus主机需要部署以上容器,其他被监控主机只需要部署node-exporter
3.prometheus配置文件(根据自己的服务器ip进行修改targets内容)
vim prometheus.yml
global:

  scrape_interval:     15s # 默认抓取周期

  external_labels:

    monitor: 'codelab-monitor'

scrape_configs:

  - job_name: 'node-exporter' #服务的名称

    scrape_interval: 5s

    metrics_path: /metrics  #获取指标的url

    static_configs:

      - targets: ['139.224.224.229:9100'] # 这个为监听指定服务服务的ip和port,需要修改为自己的ip,貌似云服务必须用公网ip
4.docker-compose启动
docker-compose up -d # 挂载目录给权限,不然会启动失败
如果启动报如下的"没有权限"错误:
grafana0         | You may have issues with file permissions, more information here: http://docs.grafana.org/installation/docker/#migrate-to-v51-or-later

grafana0         | mkdir: can't create directory '/var/lib/grafana/plugins': Permission denied

grafana0         | GF_PATHS_DATA='/var/lib/grafana' is not writable.

grafana0         | You may have issues with file permissions, more information here: http://docs.grafana.org/installation/docker/#migrate-to-v51-or-later

grafana0         | mkdir: can't create directory '/var/lib/grafana/plugins': Permission denied
则需要将挂载目录赋予权限,即:
chmod 777 grafana_data/ prometheus_data/ #个人根据配置文件中具体的挂在目录进行权限修改
5.访问主机的9090端口可以查到Prometheus监控到的数据,访问3000端口是grafana的界面,账密admin/admin
6.配置监控,点击齿轮,选择Data Sources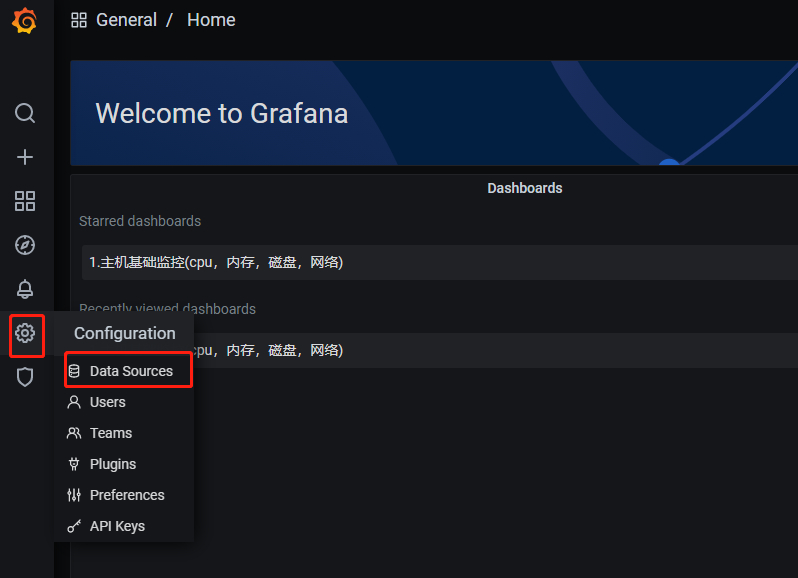
7.点击Add data source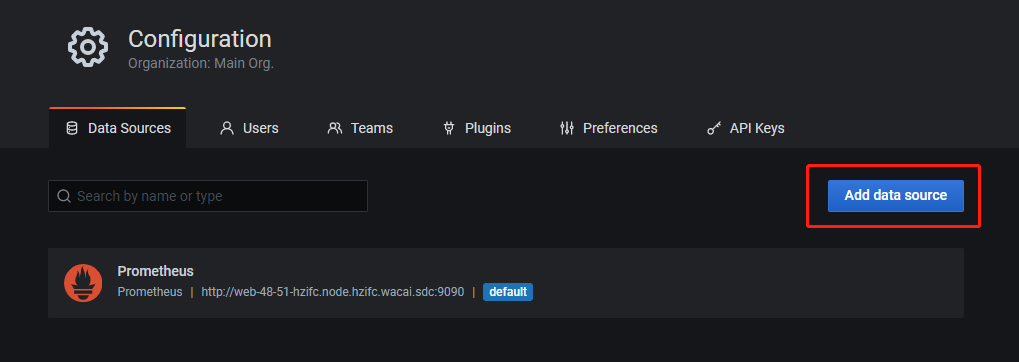
8.填写prometheus地址 ip+端口或者主机名+端口(需要配置hosts)
9.点击save&test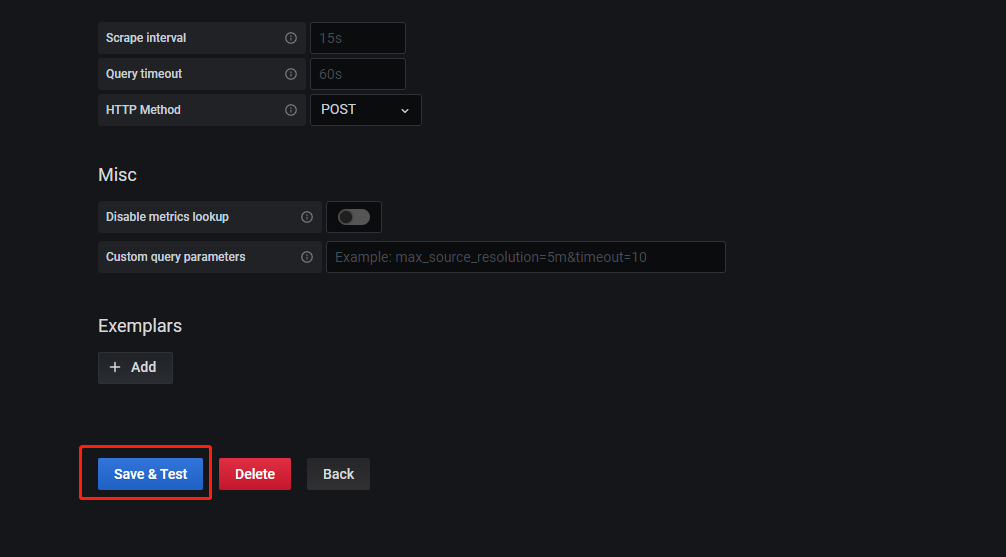
10.点击+号,选择import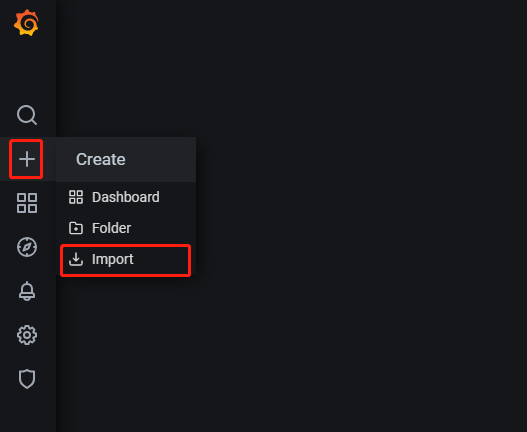
11.输入模板号9276,点击load。 8919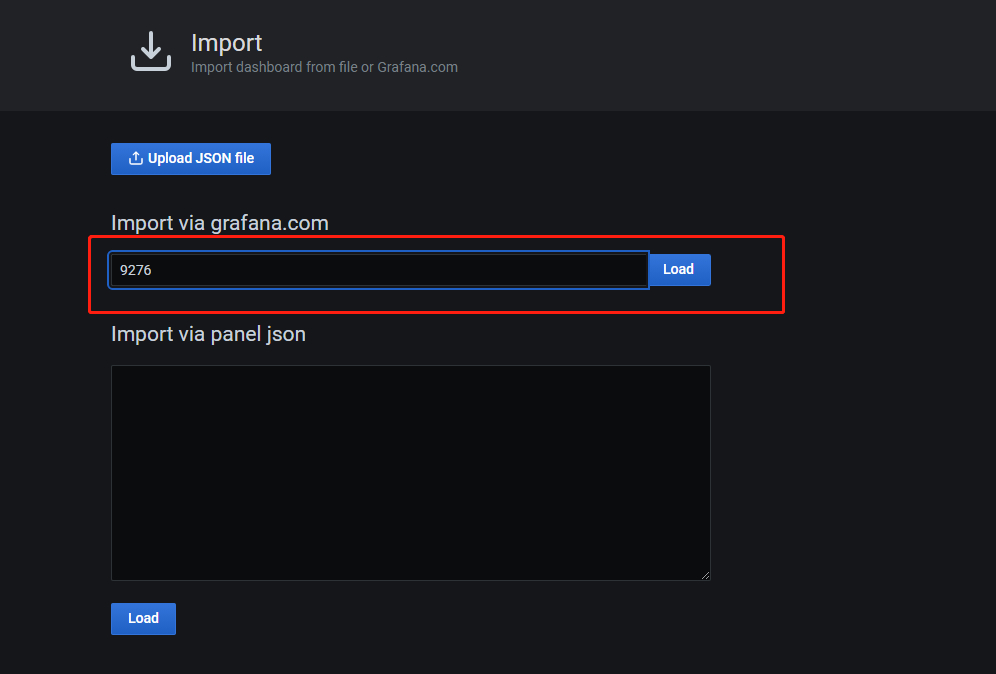
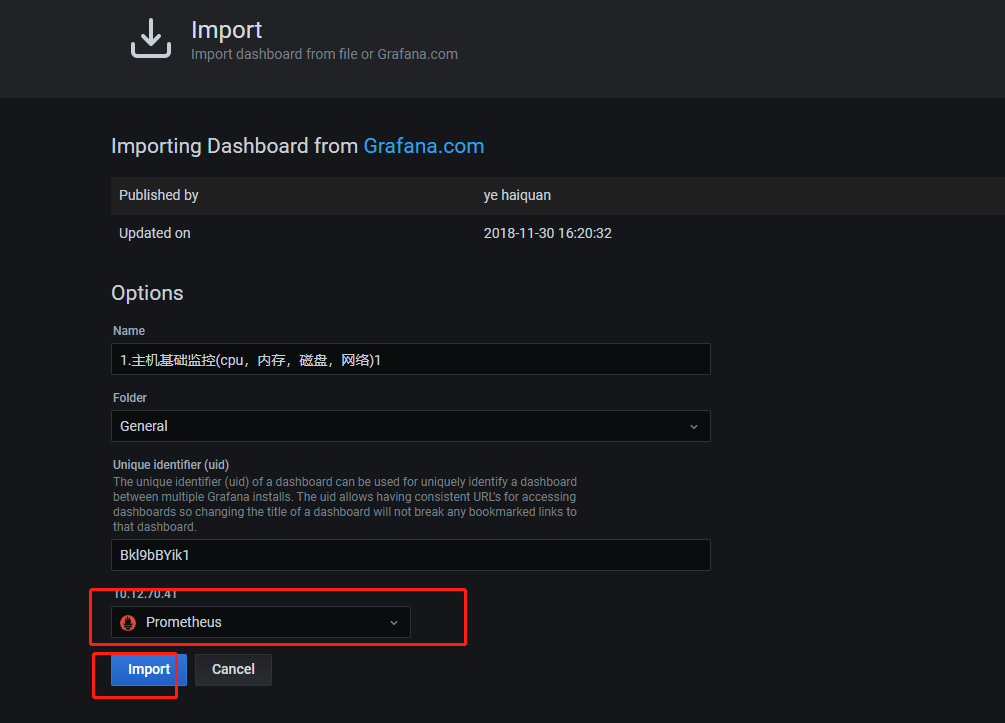
11.导入模板完成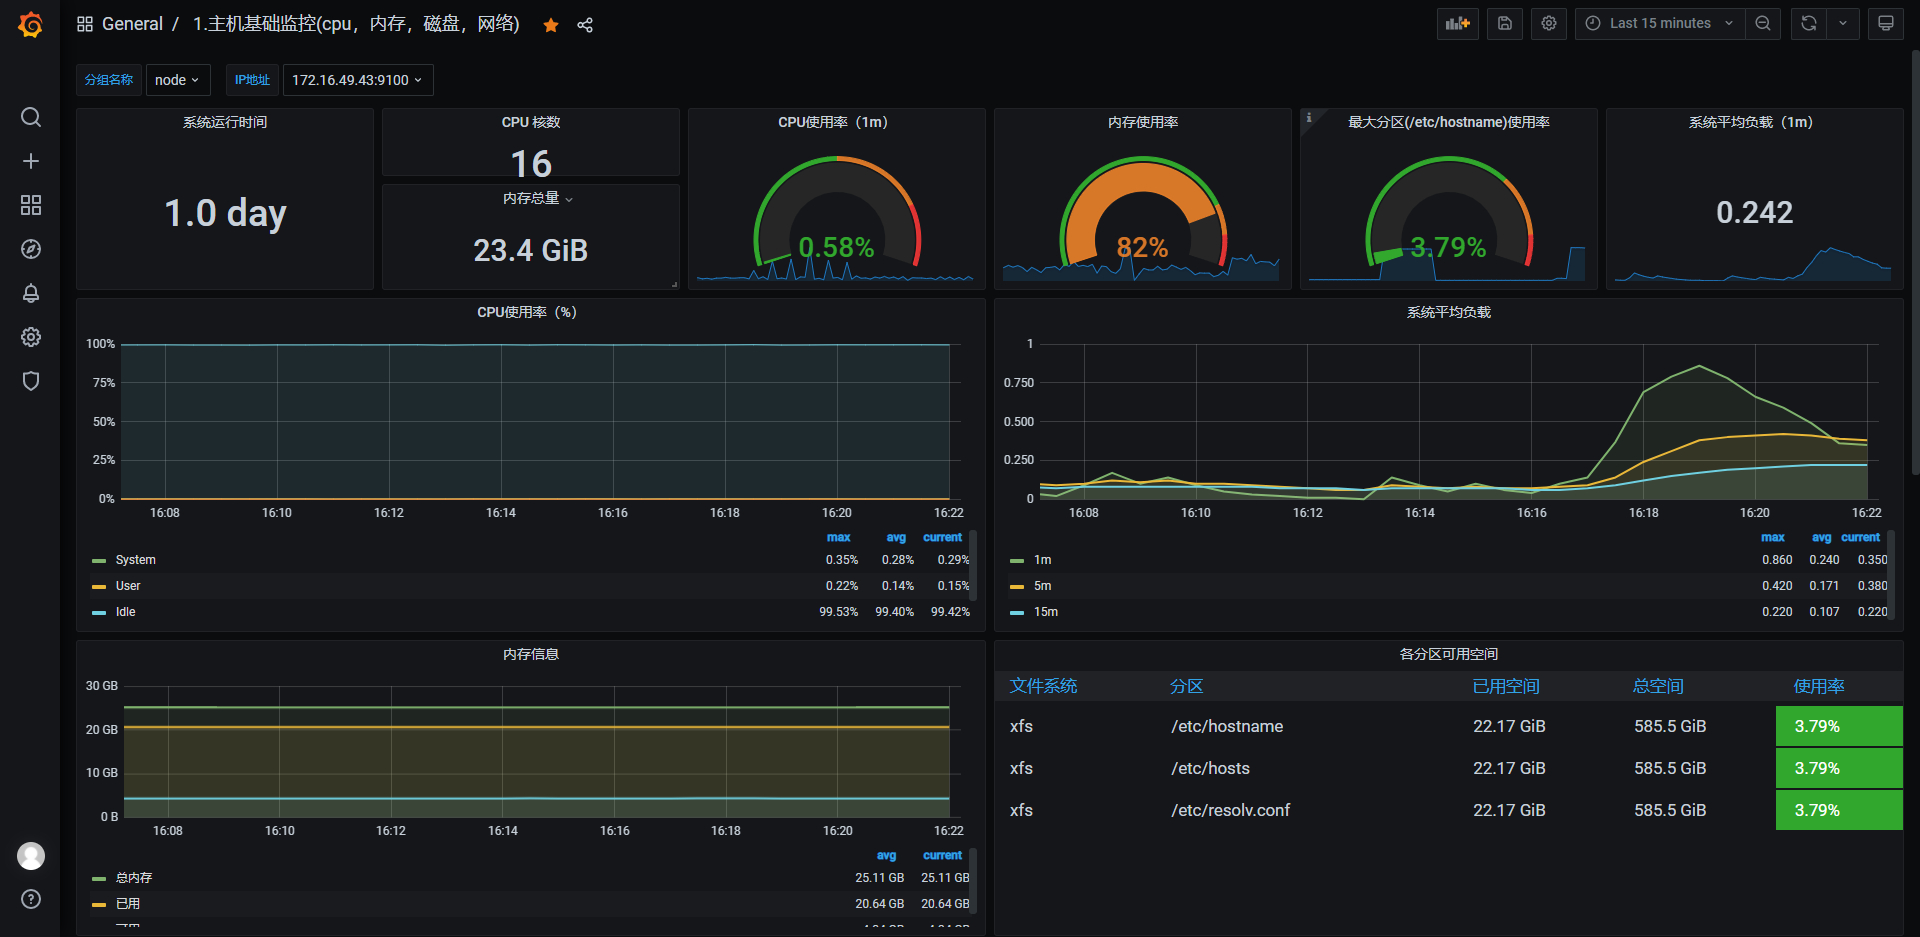
使用docker-compose快速部署Prometheus+grafana环境的更多相关文章
- 利用Docker Compose快速搭建本地测试环境
前言 Compose是一个定义和运行多个Docker应用的工具,用一个YAML(dockder-compose.yml)文件就能配置我们的应用.然后用一个简单命令就能启动所有的服务.Compose编排 ...
- 使用 Docker Compose 快速构建 TiDB 集群
本文档介绍如何在单机上通过 Docker Compose 快速一键部署一套 TiDB 测试集群.Docker Compose 可以通过一个 YAML 文件定义多个容器的应用服务,然后一键启动或停止. ...
- 用Docker swarm快速部署Nebula Graph集群
用Docker swarm快速部署Nebula Graph集群 一.前言 本文介绍如何使用 Docker Swarm 来部署 Nebula Graph 集群. 二.nebula集群搭建 2.1 环境准 ...
- Docker Compose 一键部署LNMP
Docker Compose 一键部署LNMP 目录结构 [root@localhost ~]# tree compose_lnmp/ compose_lnmp/ ├── docker-compose ...
- Docker Compose 一键部署Nginx代理Tomcat集群
Docker Compose 一键部署Nginx代理Tomcat集群 目录结构 [root@localhost ~]# tree compose_nginx_tomcat/ compose_nginx ...
- Docker Compose 一键部署多节点爬虫程序
Docker Compose 一键部署多节点爬虫程序 目录结构 [root@localhost ~]# tree compose_crawler/ compose_crawler/ ├── cento ...
- 如何快速部署 Prometheus?- 每天5分钟玩转 Docker 容器技术(85)
上一节介绍了 Prometheus 的核心,多维数据模型.本节演示如何快速搭建 Prometheus 监控系统. 环境说明 我们将通过 Prometheus 监控两台 Docker Host:192. ...
- 使用Prometheus监控docker compose方式部署的ES
需求 收集 ES 的指标, 并进行展示和告警; 现状 ES 通过 docker compose 安装 所在环境的 K8S 集群有 Prometheus 和 AlertManager 及 Grafana ...
- docker-compose 快速部署Prometheus,监控docker 容器, 宿主机,ceph -- cluster集群
话不多说上菜: 现在环境是这样: ceph 4台: 192.168.100.21 ceph-node1 192.168.100.22 ceph-node2 192.168.100.23 ceph ...
- [phvia/dkc] Docker Compose 快速构建(LNMP+Node)运行环境
快速构建(LNMP+Node)运行环境. dkc 在此作为 docker-compose 的缩写,你可以理解为 alias dkc=docker-compose 准备 安装 docker 选择1) 从 ...
随机推荐
- Java日期时间API系列34-----Jdk8中java.time包中的新的日期时间API类应用,使用Period一行代码计算生日。
通过Java日期时间API系列9-----Jdk8中java.time包中的新的日期时间API类的Period和Duration的区别中得知,Period可以比较2个日期相差的年月日.年龄计算是2个日 ...
- Vue3 的watch 监视属性
1. 监听单个 watch(变量,(新值,老值)=>{}) 2. 监听多个 watch([变量1,变量2],(新值,老值)=>{}) 3. 监听对象 watch(()=>对象,(新值 ...
- CDQ&整体二分-三维偏序(陌上花开)
题面 本文讲cdq,整体二分的思路与做法.=分治VS数据结构 其实维度这一方面,空间几何可以是维度,像时间这样有规定顺序的词语也可能是维度. cdq 三维偏序,一般可以用一维一维的消.可以用cdq嵌套 ...
- apache安装详解
Apache安装 准备工作. 首先在C盘根目录下创建一个名为web的文件夹作为php开发环境的安装位置,并在web文件夹中创建apache24子文件夹,将apache解压后文件放至此处. 安装包 首先 ...
- 现在 Llama 具备视觉能力并可以在你的设备上运行 - 欢迎使用 Llama 3.2
Llama 3.2 来了!今天,我们欢迎 Llama 系列的下一个版本加入 Hugging Face.这次,我们很高兴与 Meta 合作发布多模态和小型模型.在 Hub 上提供了十个开源模型 (5 个 ...
- C# .netcore NPOI库 实现报表的列自适应删减
实际需求:业务上的一个需求,数据库表A中的B字段存放的是该条数据的一些标签,标签存在两级[即一级标签和二级标签], 现在要是实现将这些标签统计到报表中,一级标签作为表头,二级标签作为填充值. 由于之前 ...
- URL是什么
URL是什么 URL(Uniform Resource Locator,统一资源定位器) URL的组成: 协议://{域名|主机名|IP}:端口/路径/文件名?参数#锚点 协议 Scheme/Prot ...
- 实践出真知,小程序wepy,uni-app框架开发使用!
一.前提 目前我只使用过wepy和uni-app框架开发过小程序,着重比较这两个框架使用感受! 另外wepy框架已经不维护了,希望uni-app好好维护下去! wepy和uni-app都是类似于vue ...
- 关闭火狐Firefox下载提示弹窗
关闭火狐 Firefox 下载提示弹窗可以通过地址栏输入about:config,打开高级首选项,搜索:browser.download.alwaysOpenPanel将true改为false即可关闭 ...
- mysql 批量重命名数据表、统一给表加前缀
背景 一个本地数据库,里面有 90 个数据表.由于历史原因,现在需要批量给以前的数据表加上一个前缀.于是安排人吭哧吭呲的人工修改,耗费一天工时.过了几天,又需要把统一前缀去掉.内心早已问候 @¥#%% ...