ASHRAE KAGGLE大能源预测(前三名方案总结+相关知识点讲解+python实现)
@
1 概述
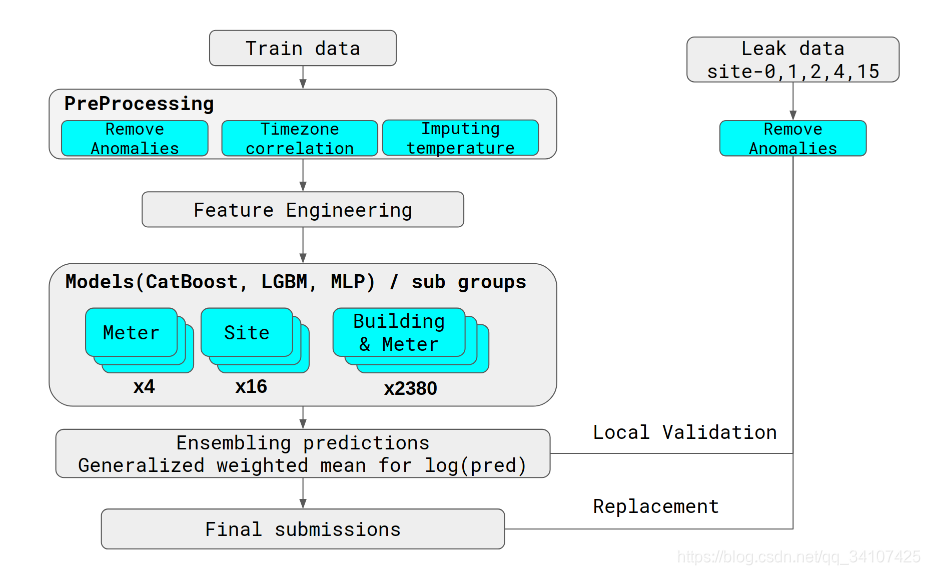
先上第一名分析的图
2 处理思想学习
2.1 移除异常值
Long steaks of constant values
- 恒定值的长条纹
Large positive/negative spikes - 极端的大尖峰
我们使用一个数据中所有建筑物验证了潜在的异常-如果同时在多个建筑物中出现异常,我们可以合理地确定这确实是一个真正的异常。
总结:异常值使用多个角度来验证这是真实的一个异常值
2.2 缺失值
温度元数据中缺少很多值。我们发现使用线性插值插补丢失的数据对我们的模型有帮助。
2.3 目标函数
一般人使用的都是log1p(meter_reading),他们与常人不同的使用了log1p(meter_reading)/square_feet来进行预测。
2.4 特征工程
- categorical interactions such as concatenation of building_id and meter
串联building_id和meter产生新的categorical featurebuilding_id_meter - count frequency of feautures
计算特征的数量 - Smoothed and 1st, 2nd-order differentiation temperature features using Savitzky-Golay filter.
- Cyclic encoding of periodic features; e.g., hour gets mapped to hour_x = cos(2pihour/24) and hour_y = sin(2pihour/24)
这个很骚,就是对于循环特征的编码,用cos和sin进行编码 - Bayesian target encoding
这个是作者自己写的一种target编码,下面会详细讲一下 - 3rd 的思路:作者因为缺乏时间,仅仅消除了一些异常值。使用的是当同一时间同一地区都出现0的时候,消除他们,然后消除了一些最大的异常值。
- 温度的滞后,多个高分作者都提到过。
2.4.1 Savitzky-Golay filter
- Savitzky-Golay卷积平滑算法是移动平滑算法的改进。
- Savitzky-Golay卷积平滑关键在于矩阵算子的求解。
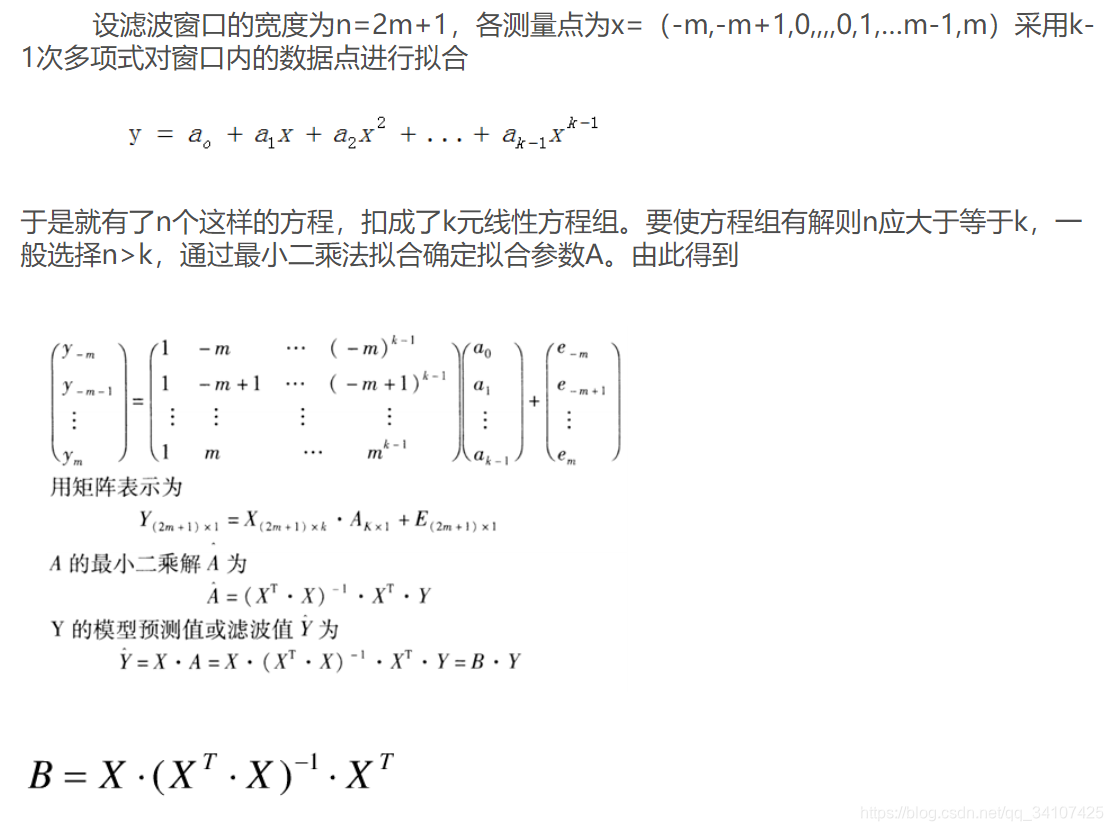
总结:先计算出B,然后计算预测Y,这个需要利用矩阵的运算。应该不难。回头复现的时候上代码
下面回到比赛上来看他们的处理结果
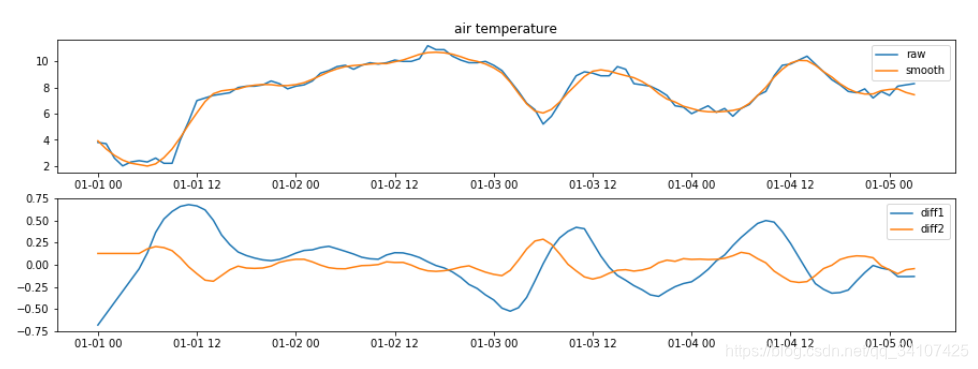
- 第一个图蓝色线是原数据
- 第一个图黄色线是用G-S平滑后的数据
- 第二个图蓝色线是G-S平滑后的数据的一阶导数
- 第二个图黄色线是G-S平滑后的数据的二阶导数
2.4.2 Bayesian target encoding(python实现)
import gc

import numpy as np

import pandas as pd

from sklearn.linear_model import RidgeCV

from sklearn.metrics import mean_squared_error
PRIOR_PRECISION = 10

class GaussianTargetEncoder():

    def __init__(self, group_cols, target_col="target", prior_cols=None):

        self.group_cols = group_cols

        self.target_col = target_col

        self.prior_cols = prior_cols

    def _get_prior(self, df):

        if self.prior_cols is None:

            prior = np.full(len(df), df[self.target_col].mean())

        else:

            prior = df[self.prior_cols].mean(1)

        return prior

    def fit(self, df):

        self.stats = df.assign(mu_prior=self._get_prior(df), y=df[self.target_col])

        self.stats = self.stats.groupby(self.group_cols).agg(

            n        = ("y", "count"),

            mu_mle   = ("y", np.mean),

            sig2_mle = ("y", np.var),

            mu_prior = ("mu_prior", np.mean),

        )

    def transform(self, df, prior_precision=1000, stat_type="mean"):

        precision = prior_precision + self.stats.n/self.stats.sig2_mle

        if stat_type == "mean":

            numer = prior_precision*self.stats.mu_prior\

                    + self.stats.n/self.stats.sig2_mle*self.stats.mu_mle

            denom = precision

        elif stat_type == "var":

            numer = 1.0

            denom = precision

        elif stat_type == "precision":

            numer = precision

            denom = 1.0

        else:

            raise ValueError(f"stat_type={stat_type} not recognized.")

        mapper = dict(zip(self.stats.index, numer / denom))

        if isinstance(self.group_cols, str):

            keys = df[self.group_cols].values.tolist()

        elif len(self.group_cols) == 1:

            keys = df[self.group_cols[0]].values.tolist()

        else:

            keys = zip(*[df[x] for x in self.group_cols])

        values = np.array([mapper.get(k) for k in keys]).astype(float)

        prior = self._get_prior(df)

        values[~np.isfinite(values)] = prior[~np.isfinite(values)]

        return values

    def fit_transform(self, df, *args, **kwargs):

        self.fit(df)

        return self.transform(df, *args, **kwargs)
# load data

train = pd.read_csv("/kaggle/input/ashrae-energy-prediction/train.csv")

test  = pd.read_csv("/kaggle/input/ashrae-energy-prediction/test.csv")
# create target

train["target"] = np.log1p(train.meter_reading)

test["target"] = train.target.mean()
# create time features

def add_time_features(df):

    df.timestamp = pd.to_datetime(df.timestamp)

    df["hour"]    = df.timestamp.dt.hour

    df["weekday"] = df.timestamp.dt.weekday

    df["month"]   = df.timestamp.dt.month

add_time_features(train)

add_time_features(test)
# define groupings and corresponding priors

groups_and_priors = {

    # singe encodings

    ("hour",):        None,

    ("weekday",):     None,

    ("month",):       None,

    ("building_id",): None,

    ("meter",):       None,

    # second-order interactions

    ("meter", "hour"):        ["gte_meter", "gte_hour"],

    ("meter", "weekday"):     ["gte_meter", "gte_weekday"],

    ("meter", "month"):       ["gte_meter", "gte_month"],

    ("meter", "building_id"): ["gte_meter", "gte_building_id"],

    # higher-order interactions

    ("meter", "building_id", "hour"):    ["gte_meter_building_id", "gte_meter_hour"],

    ("meter", "building_id", "weekday"): ["gte_meter_building_id", "gte_meter_weekday"],

    ("meter", "building_id", "month"):   ["gte_meter_building_id", "gte_meter_month"],

}
features = []

for group_cols, prior_cols in groups_and_priors.items():

    features.append(f"gte_{'_'.join(group_cols)}")

    gte = GaussianTargetEncoder(list(group_cols), "target", prior_cols)

    train[features[-1]] = gte.fit_transform(train, PRIOR_PRECISION)

    test[features[-1]]  = gte.transform(test,  PRIOR_PRECISION)
train_preds = np.zeros(len(train))

test_preds = np.zeros(len(test))

for m in range(4):

    print(f"Meter {m}", end="")

    # instantiate model

    model = RidgeCV(

        alphas=np.logspace(-10, 1, 25),

        normalize=True,

    )

    # fit model

    model.fit(

        X=train.loc[train.meter==m, features].values,

        y=train.loc[train.meter==m, "target"].values

    )

    # make predictions

    train_preds[train.meter==m] = model.predict(train.loc[train.meter==m, features].values)

    test_preds[test.meter==m]   = model.predict(test.loc[test.meter==m, features].values)

    # transform predictions

    train_preds[train_preds < 0] = 0

    train_preds[train.meter==m] = np.expm1(train_preds[train.meter==m])

    test_preds[test_preds < 0] = 0

    test_preds[test.meter==m] = np.expm1(test_preds[test.meter==m])

    # evaluate model

    meter_rmsle = rmsle(

        train_preds[train.meter==m],

        train.loc[train.meter==m, "meter_reading"].values

    )

    print(f", rmsle={meter_rmsle:0.5f}")

print(f"Overall rmsle={rmsle(train_preds, train.meter_reading.values):0.5f}")

del train, train_preds, test

gc.collect()
2.5 models ensemble
- 2nd的思想:Due to the size of the dataset and difficulty in setting up a robust validation framework, we did not focus much on feature engineering, fearing it might not extrapolate cleanly to the test data. Instead we chose to ensemble as many different models as possible to capture more information and help the predictions to be stable across years.
因为数据集的规模巨大,以及难以建立验证框架的困难,他们担心特征工程可能不发清晰的推断到测试数据上,因此并未过多的关注特征工程。相反,整合尽可能多的不同模型来捕获更多的信息,并帮助预测集的平稳。
根据他们过去的经验,在没有可靠的验证框架的情况下,构建好的特征是非常棘手的 - 2nd的思想:We bagged a bunch of boosting models XGB, LGBM, CB at various levels of data: Models for every site+meter, models for every building+meter, models for every building-type+meter and models using entire train data. It was very useful to build a separate model for each site so that the model could capture site-specific patterns and each site could be fitted with a different parameter set suitable for it. It also automatically solved for issues like timestamp alignment and feature measurement scale being different across sites so we didn't have to solve for them separately.
为每一个建立单独的model,作者大概为这次比赛总共建立了超过5000个models进行融合 - 3nd的思想:Given diverse experiments with different CV schemes I did over the period of the competition, I decided to simply combine all the results (over 30), I got into a single submission using a simple average after selection by pearson correlation (6th on private LB).
作者因为时间不充裕,所以简单的融合了所有的结果,超过30个的结果。作者简单的使用平均的方法。然后使用peason correlation皮尔逊相关系数来选择平均那几个结果。 - 不得不说,就算lightGBM的性能高于XGB和Catboost,但是这三个都是要用在比赛中的,可能是能提取不同的信息。有的人还会使用CNN和FFNN
2.5.1 pearson correlation(+python 实现)
Pearson相关系数(Pearson CorrelationCoefficient)是用来衡量两个数据集合是否在一条线上面,它用来衡量定距变量间的线性关系。
#如何使用

from scipy.stats.stats import pearsonr

pearsonr(x, y)
#具体文档查看

from pydoc import help

from scipy.stats.stats import pearsonr

help(pearsonr)

>>>

Help on function pearsonr in module scipy.stats.stats:

pearsonr(x, y)

 Calculates a Pearson correlation coefficient and the p-value for testing

 non-correlation.

 The Pearson correlation coefficient measures the linear relationship

 between two datasets. Strictly speaking, Pearson's correlation requires

 that each dataset be normally distributed. Like other correlation

 coefficients, this one varies between -1 and +1 with 0 implying no

 correlation. Correlations of -1 or +1 imply an exact linear

 relationship. Positive correlations imply that as x increases, so does

 y. Negative correlations imply that as x increases, y decreases.

 The p-value roughly indicates the probability of an uncorrelated system

 producing datasets that have a Pearson correlation at least as extreme

 as the one computed from these datasets. The p-values are not entirely

 reliable but are probably reasonable for datasets larger than 500 or so.

 Parameters

 ----------

 x : 1D array

 y : 1D array the same length as x

 Returns

 -------

 (Pearson's correlation coefficient,

  2-tailed p-value)

 References

 ----------

 http://www.statsoft.com/textbook/glosp.html#Pearson%20Correlation
2.6 Why does postprocessing work? 2nd place magic
Why does postprocessing work? 2nd place magic
- 2nd 的思路:在预测之后,得到的数据乘上一个常数,一般是0.8~1.1,这个就叫postprocess.
参考博客:
1st Place Solution Team Isamu & Matt
2nd Place Solution
3rd Place Solution
Savitzky-Golay 滤波器
ASHRAE KAGGLE大能源预测(前三名方案总结+相关知识点讲解+python实现)的更多相关文章
- 【转载】如何在 Kaggle 首战中进入前 10%
本文转载自如何在 Kaggle 首战中进入前 10% 转载仅出于个人学习收藏,侵删 Introduction 本文采用署名 - 非商业性使用 - 禁止演绎 3.0 中国大陆许可协议进行许可.著作权由章 ...
- Kaggle网站流量预测任务第一名解决方案:从模型到代码详解时序预测
Kaggle网站流量预测任务第一名解决方案:从模型到代码详解时序预测 2017年12月13日 17:39:11 机器之心V 阅读数:5931 近日,Artur Suilin 等人发布了 Kaggl ...
- Kaggle 自行车租赁预测比赛项目实现
作者:大树 更新时间:01.20 email:59888745@qq.com 数据处理,机器学习 回主目录:2017 年学习记录和总结 .caret, .dropup > .btn > . ...
- 一个学生分数表,用sql语句查询出各班级的前三名
昨天去一家公司面试,被这道题难住了,哎,又失去一次好的机会. 回来 之后就再想这个问题 表结构及数据如下:
- Java输出考试前三名
实现输出考试成绩的前三名 要求: 1. 考试成绩已保存在数组 scores 中,数组元素依次为 89 , -23 , 64 , 91 , 119 , 52 , 73 2. 要求通过自定义方法来实现成绩 ...
- ORACLE分科目统计每科前三名的学生的语句
有个成绩表 score(student_no,Subject_no,Score)分别为学号,课程号,成绩.我想用语句查询出每科的前三名学生的学号,请各位高手教教小弟 1.创建测试语句:create t ...
- Kaggle大数据竞赛平台入门
Kaggle大数据竞赛平台入门 大数据竞赛平台,国内主要是天池大数据竞赛和DataCastle,国外主要就是Kaggle.Kaggle是一个数据挖掘的竞赛平台,网站为:https://www.kagg ...
- SQL统计每科前三名的学生的语句
偶然在论坛看到一个网友的帖子,关于他遇到一个面试题的,网站写了很多,我看了一下,结果应该是没问题的,但是为何面试官还是不满意,我想面试官可能并不是想考你真能把这道题做出来,而是看你如何简洁的通过一个s ...
- PGIS大数据量点位显示方案
PGIS大数据量点位显示方案 问题描述 PGIS在地图上显示点位信息时,随点位数量的增加浏览器响应速度会逐渐变慢,当同时显示上千个点时浏览器会变得非常缓慢,以下是进行的测试: 测试环境: 服务器: C ...
随机推荐
- DEDE中自定义表单HTML 怎么写
用DEDE嵌套网站时,有时我们需要添加自定义字段,而自定义字段的HTML样式如何设置呢? 功能地图(核心/频道模型/内容模型管理/)——普通文章的修改——字段管理——你的自定义字段的修改——最下面自定 ...
- Spring Boot的TestRestTemplate使用
文章目录 添加maven依赖 TestRestTemplate VS RestTemplate 使用Basic Auth Credentials 使用HttpClientOption 使用RestTe ...
- IDEA 之 常用快捷键
1. 编辑 No. 快捷键 功能描述 01 Ctrl+Space 补全代码 02 Ctrl+Shift+Space 补全代码,添加分号结束符 03 Ctrl+q 展示某个类或方法的API说明文档 04 ...
- Json & pickle 数据序列化
前提: 文本文件中只能写入字符串或ascii码格式的内容. info={'name':'zoe','age':18} f=open('test.txt','w') f.write(info) #在文本 ...
- 7.JUC线程高级-生产消费问题&虚假唤醒
描述 生产消费问题在java多线程的学习中是经常遇到的问题 ,多个线程共享通一个资源的时候会出现各种多线程中经常出现的各种问题. 实例说明 三个类:售货员Clerk,工厂Factory,消费者Cons ...
- SVN签出,回退
2019独角兽企业重金招聘Python工程师标准>>> yum install -y subversion 安装SVN 签出代码 : [root@test svn]# svn che ...
- INTERVIEW #1
一.数据对齐存储 在32位系统中:int占4Bytes,short占2Bytes,char占1Byte,加起来应该是7Bytes,但是下面这段代码输出却是8. #define _CRT_SECURE_ ...
- Centos7 搭建bind9.9
DNS服务器概述: DNS(Domain Name System),即域名系统. DNS服务器分为三种: 主域名服务器(Master Server).辅助域名服务器(Slave DNS).缓存服务器( ...
- 请不要浪费你的生命,一文多发推广就用它(OpenWrite)
你我的共同困惑 你是否跟我一样?刚开始尝试写作,自己没有名气,有以下几个困惑: 想要推广自己,想在多个平台发文? 多平台发文之后,想要看各个平台的流量如何? 有了流量,想要引流用户到自己的网站? 网站 ...
- Jenkins+Ansible+Gitlab自动发布/回滚Spring项目
一.实现方法流程图 流程图如下:代码托管在本地GitLab上(为了复现整套流水线,我直接使用了GitHub,懒得再搭建GitLab),开发完成后提交代码到代码仓库,[自动]触发Jenkins进行持续集 ...