matplotlib subplot 子图
总括
MATLAB和pyplot有当前的图形(figure)和当前的轴(axes)的概念,所有的作图命令都是对当前的对象作用。可以通过gca()获得当前的axes(轴),通过gcf()获得当前的图形(figure)
import numpy as np

import matplotlib.pyplot as plt

def f(t):

return np.exp(-t) * np.cos(2*np.pi*t)

t1 = np.arange(0.0, 5.0, 0.1)

t2 = np.arange(0.0, 5.0, 0.02)

plt.figure(1)

plt.subplot(211)

plt.plot(t1, f(t1), 'bo', t2, f(t2), 'k')

plt.subplot(212)

plt.plot(t2, np.cos(2*np.pi*t2), 'r--')

plt.show()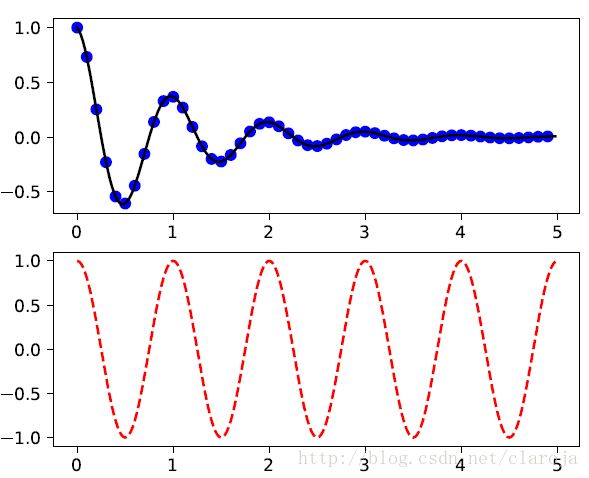
如果不指定figure()的轴,figure(1)命令默认会被建立,同样的如果你不指定subplot(numrows, numcols, fignum)的轴,subplot(111)也会自动建立。
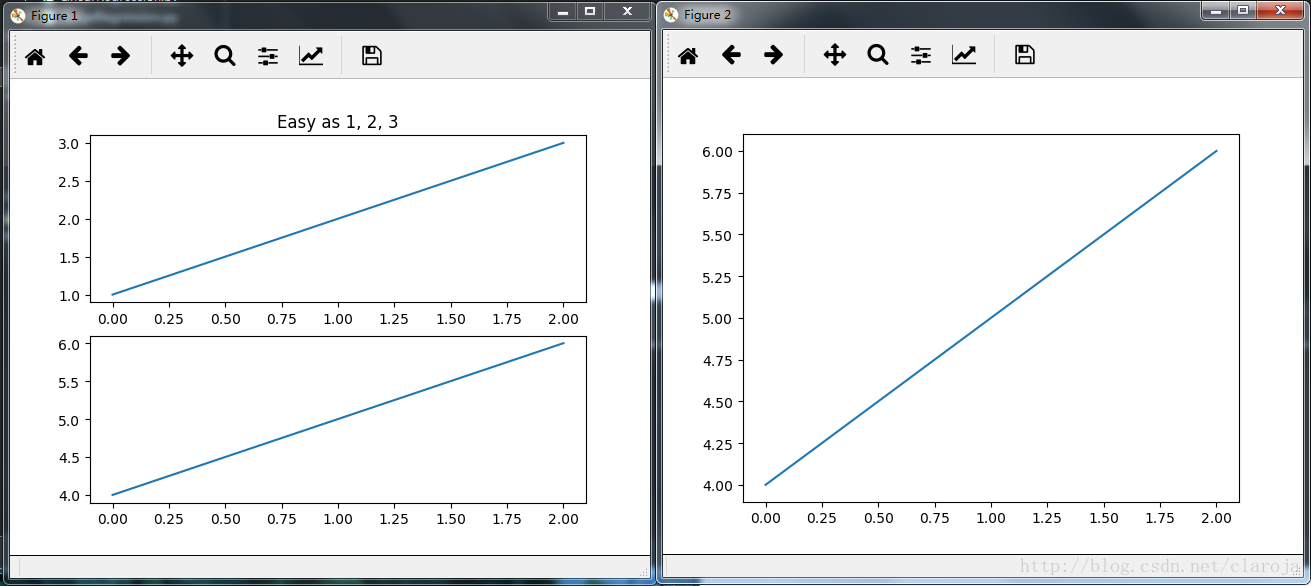
import matplotlib.pyplot as plt

plt.figure(1) # 创建第一个画板(figure)

plt.subplot(211) # 第一个画板的第一个子图

plt.plot([1, 2, 3])

plt.subplot(212) # 第二个画板的第二个子图

plt.plot([4, 5, 6])

plt.figure(2) #创建第二个画板

plt.plot([4, 5, 6]) # 默认子图命令是subplot(111)

plt.figure(1) # 调取画板1; subplot(212)仍然被调用中

plt.subplot(211) #调用subplot(211)

plt.title('Easy as 1, 2, 3') # 做出211的标题
subplot()是将整个figure均等分割,而axes()则可以在figure上画图。
import matplotlib.pyplot as plt

import numpy as np

# 创建数据

dt = 0.001

t = np.arange(0.0, 10.0, dt)

r = np.exp(-t[:1000]/0.05) # impulse response

x = np.random.randn(len(t))

s = np.convolve(x, r)[:len(x)]*dt # colored noise

# 默认主轴图axes是subplot(111)

plt.plot(t, s)

plt.axis([0, 1, 1.1*np.amin(s), 2*np.amax(s)])

plt.xlabel('time (s)')

plt.ylabel('current (nA)')

plt.title('Gaussian colored noise')

#内嵌图

a = plt.axes([.65, .6, .2, .2], facecolor='y')

n, bins, patches = plt.hist(s, 400, normed=1)

plt.title('Probability')

plt.xticks([])

plt.yticks([])

#另外一个内嵌图

a = plt.axes([0.2, 0.6, .2, .2], facecolor='y')

plt.plot(t[:len(r)], r)

plt.title('Impulse response')

plt.xlim(0, 0.2)

plt.xticks([])

plt.yticks([])

plt.show()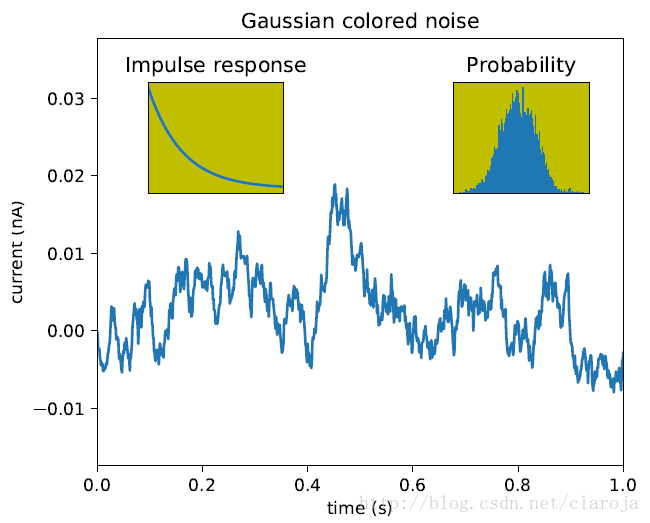
你可以通过clf()清空当前的图板(figure),通过cla()来清理当前的轴(axes)。你需要特别注意的是记得使用close()关闭当前figure画板
通过GridSpec来定制Subplot的坐标
GridSpec指定子图所放置的几何网格。
SubplotSpec在GridSpec中指定子图(subplot)的位置。
subplot2grid类似于“pyplot.subplot”,但是它从0开始索引
ax = plt.subplot2grid((2,2),(0, 0))

ax = plt.subplot(2,2,1)
以上两行的子图(subplot)命令是相同的。subplot2grid使用的命令类似于HTML语言。
ax1 = plt.subplot2grid((3,3), (0,0), colspan=3)

ax2 = plt.subplot2grid((3,3), (1,0), colspan=2)

ax3 = plt.subplot2grid((3,3), (1, 2), rowspan=2)

ax4 = plt.subplot2grid((3,3), (2, 0))

ax5 = plt.subplot2grid((3,3), (2, 1))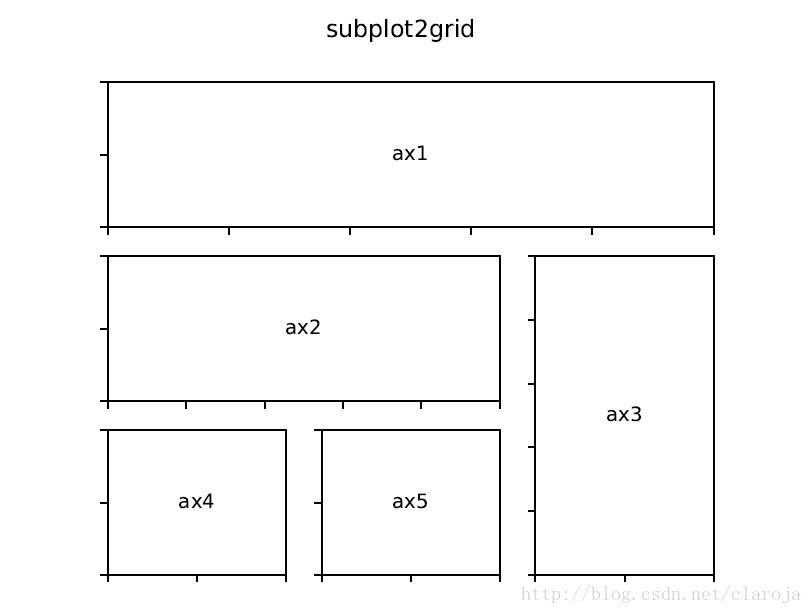
使用GridSpec 和 SubplotSpec
ax = plt.subplot2grid((2,2),(0, 0))相当于
import matplotlib.gridspec as gridspec

gs = gridspec.GridSpec(2, 2)

ax = plt.subplot(gs[0, 0])
一个gridspec实例提供给了类似数组的索引来返回SubplotSpec实例,所以我们可以使用切片(slice)来合并单元格。
gs = gridspec.GridSpec(3, 3)

ax1 = plt.subplot(gs[0, :])

ax2 = plt.subplot(gs[1,:-1])

ax3 = plt.subplot(gs[1:, -1])

ax4 = plt.subplot(gs[-1,0])

ax5 = plt.subplot(gs[-1,-2])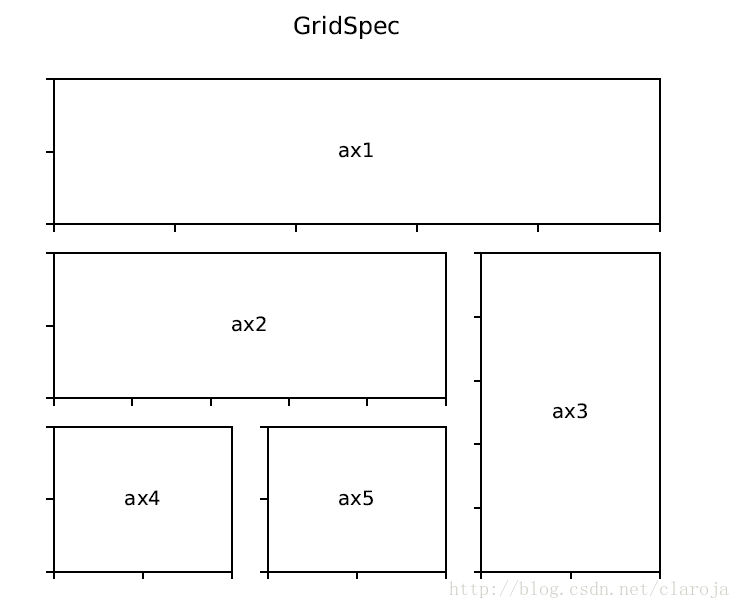
调整GridSpec图层
当GridSpec被使用后,你可以调整子图(subplot)的参数。这个类似于subplot_adjust,但是它只作用于GridSpec实例。
gs1 = gridspec.GridSpec(3, 3)

gs1.update(left=0.05, right=0.48, wspace=0.05)

ax1 = plt.subplot(gs1[:-1, :])

ax2 = plt.subplot(gs1[-1, :-1])

ax3 = plt.subplot(gs1[-1, -1])

gs2 = gridspec.GridSpec(3, 3)

gs2.update(left=0.55, right=0.98, hspace=0.05)

ax4 = plt.subplot(gs2[:, :-1])

ax5 = plt.subplot(gs2[:-1, -1])

ax6 = plt.subplot(gs2[-1, -1])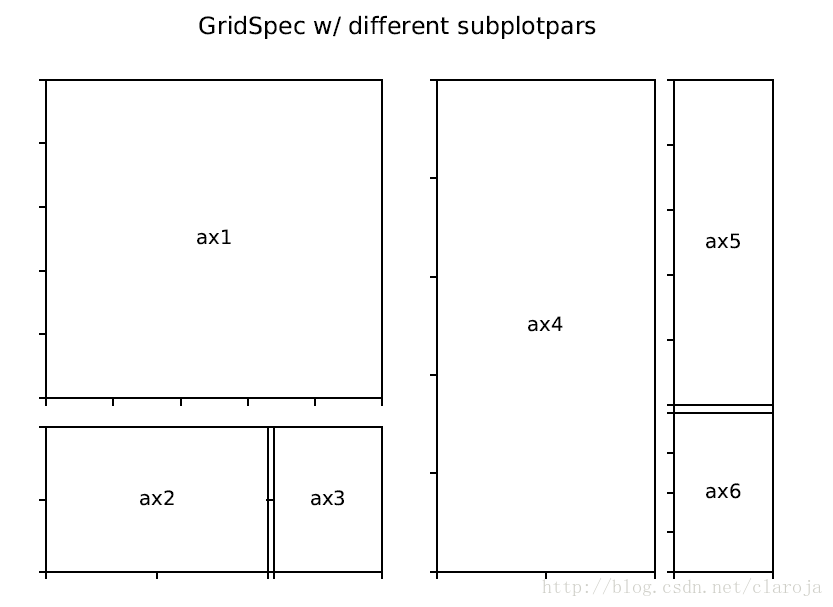
在subplotSpec中嵌套GridSpec
gs0 = gridspec.GridSpec(1, 2)

gs00 = gridspec.GridSpecFromSubplotSpec(3, 3, subplot_spec=gs0[0])

gs01 = gridspec.GridSpecFromSubplotSpec(3, 3, subplot_spec=gs0[1])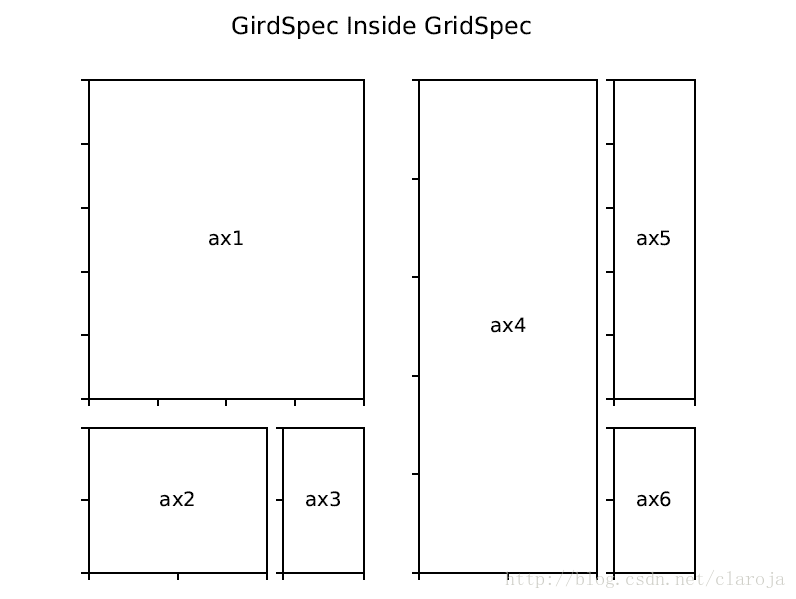
下图是一个3*3方格,嵌套在4*4方格中的例子 
调整GridSpec的尺寸
默认的,GridSpec会创建相同尺寸的单元格。你可以调整相关的行与列的高度和宽度。注意,绝对值是不起作用的,相对值才起作用。
gs = gridspec.GridSpec(2, 2,

                        width_ratios=[1,2],

                        height_ratios=[4,1]

                        )

ax1 = plt.subplot(gs[0])

ax2 = plt.subplot(gs[1])

ax3 = plt.subplot(gs[2])

ax4 = plt.subplot(gs[3])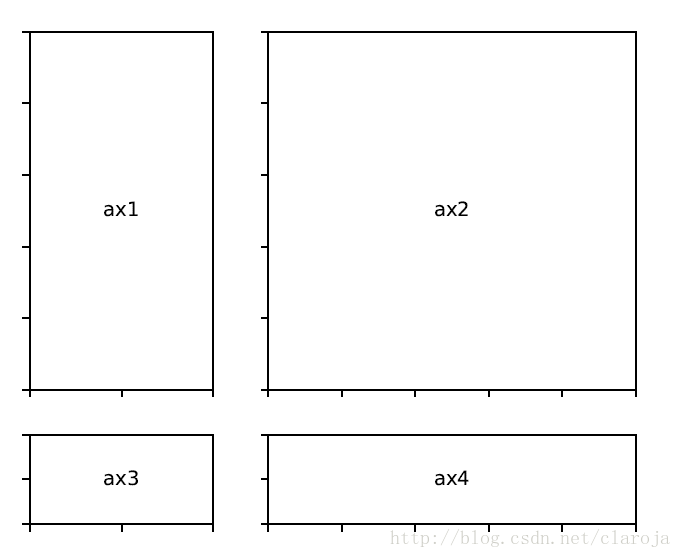
调整图层
tigh_layout自动调整子图(subplot)参数来适应画板(figure)的区域。它只会检查刻度标签(ticklabel),坐标轴标签(axis label),标题(title)。
轴(axes)包括子图(subplot)被画板(figure)的坐标指定。所以一些标签会超越画板(figure)的范围。
plt.rcParams['savefig.facecolor'] = "0.8"

def example_plot(ax, fontsize=12):

    ax.plot([1, 2])

    ax.locator_params(nbins=3)

    ax.set_xlabel('x-label', fontsize=fontsize)

    ax.set_ylabel('y-label', fontsize=fontsize)

    ax.set_title('Title', fontsize=fontsize)

plt.close('all')

fig, ax = plt.subplots()

example_plot(ax, fontsize=24)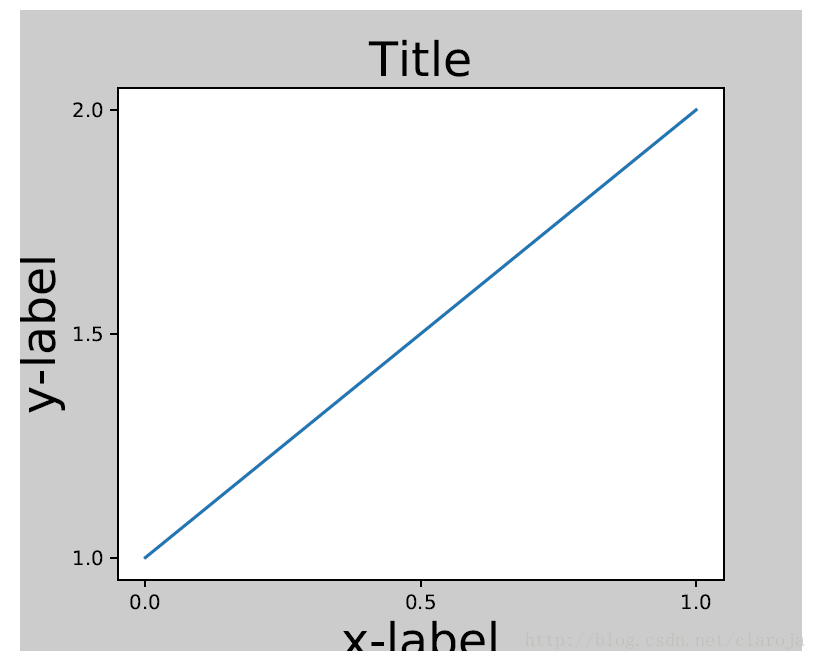
对于子图(subplot)可以通过调整subplot参数解决这个问题。Matplotlib v1.1 引进了一个新的命令tight_layout()自动的解决这个问题
plt.tight_layout()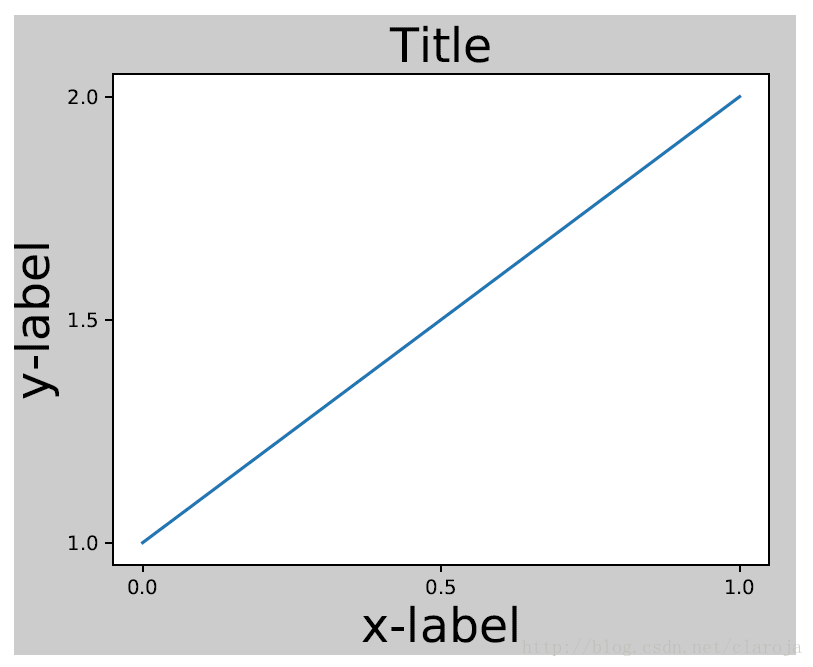
很多子图的情况
plt.close('all')

fig, ((ax1, ax2), (ax3, ax4)) = plt.subplots(nrows=2, ncols=2)

example_plot(ax1)

example_plot(ax2)

example_plot(ax3)

example_plot(ax4)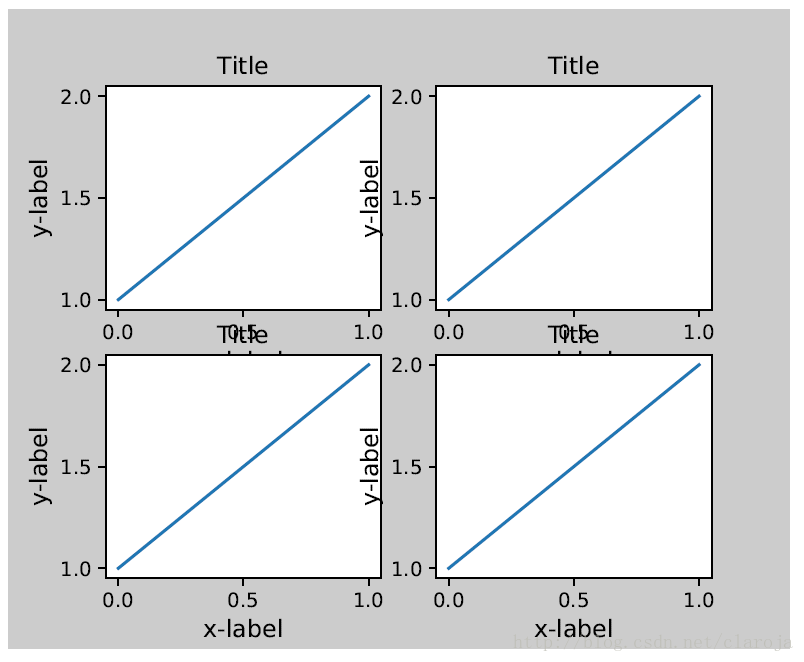
plt.tight_layout()
tight_layout()含有pad,w_pad和h_pad
plt.tight_layout(pad=0.4, w_pad=0.5, h_pad=1.0)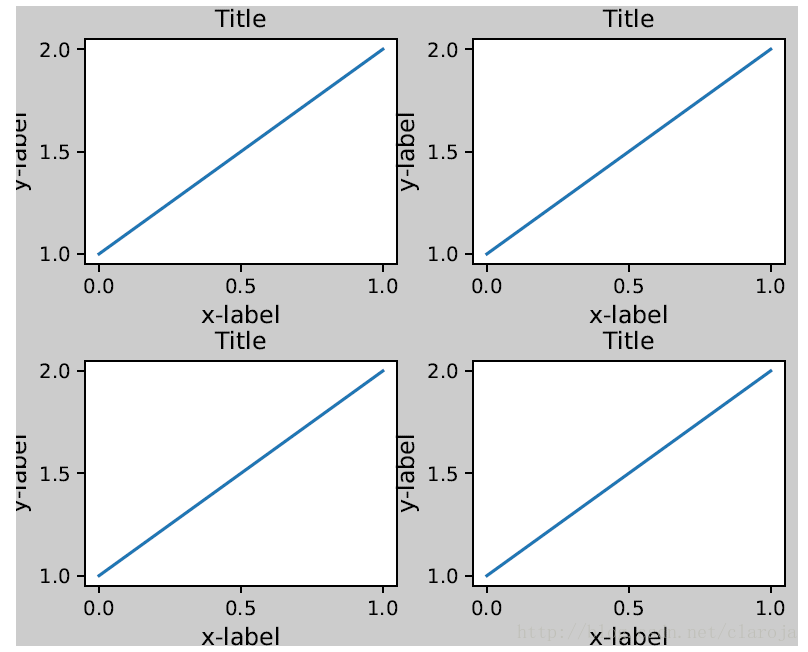
在GridSpec中使用tight_layout()
GridSpec拥有它自己的tight_layout()方法
plt.close('all')

fig = plt.figure()

import matplotlib.gridspec as gridspec

gs1 = gridspec.GridSpec(2, 1)

ax1 = fig.add_subplot(gs1[0])

ax2 = fig.add_subplot(gs1[1])

example_plot(ax1)

example_plot(ax2)

gs1.tight_layout(fig)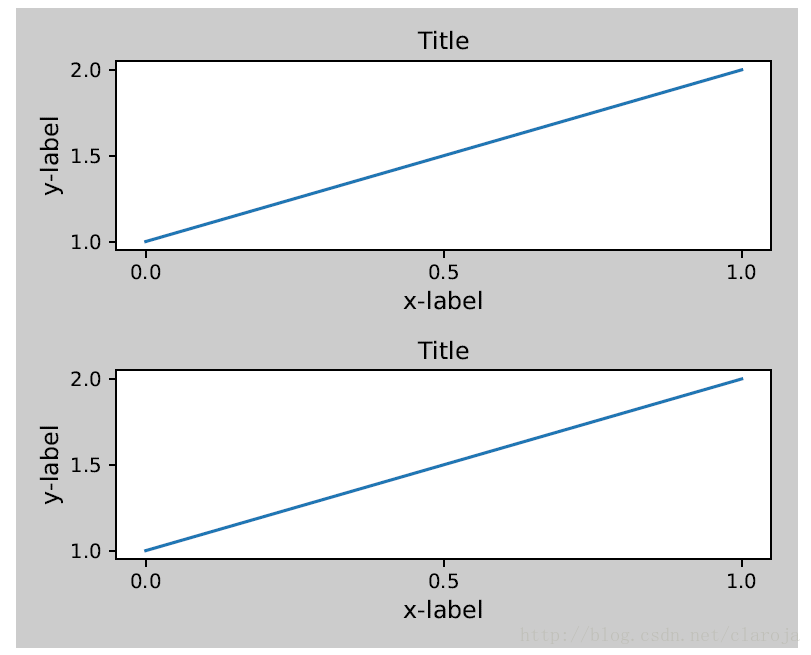
你可以指定一个可选择的方形(rect)参数来指定子图(subplot)到画板(figure)的距离 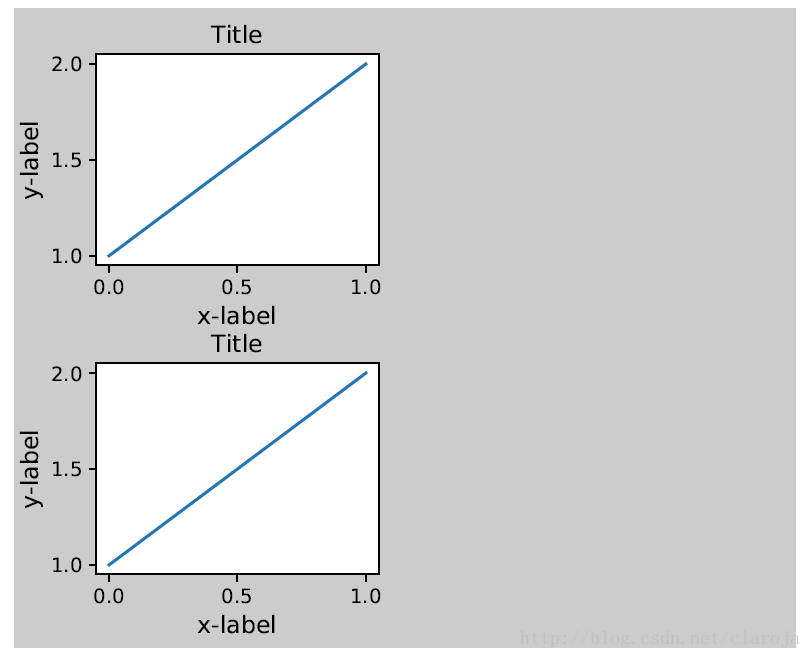
这个还可以应用到复合的gridspecs中
gs2 = gridspec.GridSpec(3, 1)

for ss in gs2:

ax = fig.add_subplot(ss)

example_plot(ax)

ax.set_title("")

ax.set_xlabel("")

ax.set_xlabel("x-label", fontsize=12)

gs2.tight_layout(fig, rect=[0.5, 0, 1, 1], h_pad=0.5)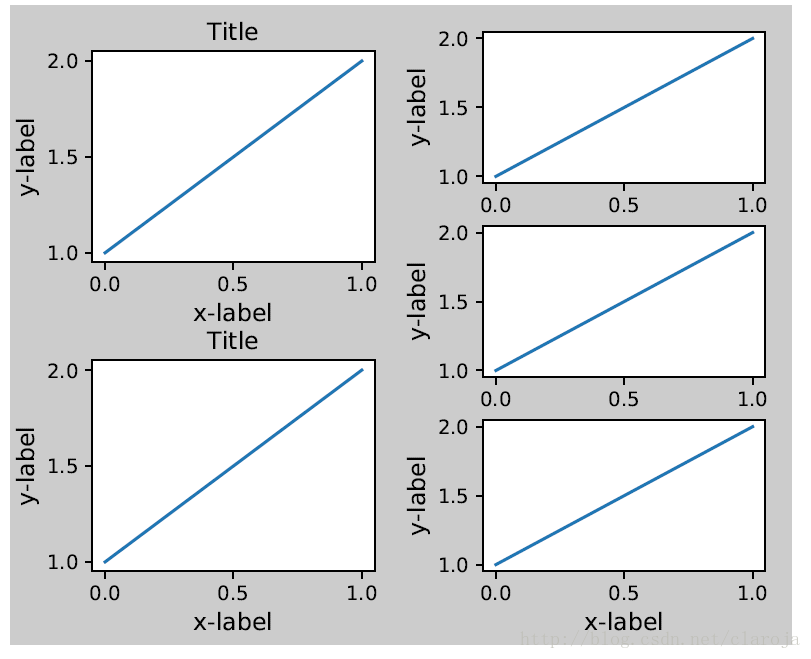
在AxesGrid1中使用tight_layout()
plt.close('all')

fig = plt.figure()

from mpl_toolkits.axes_grid1 import Grid

grid = Grid(fig, rect=111, nrows_ncols=(2,2),

axes_pad=0.25, label_mode='L',

)

for ax in grid:

example_plot(ax)

ax.title.set_visible(False)

plt.tight_layout()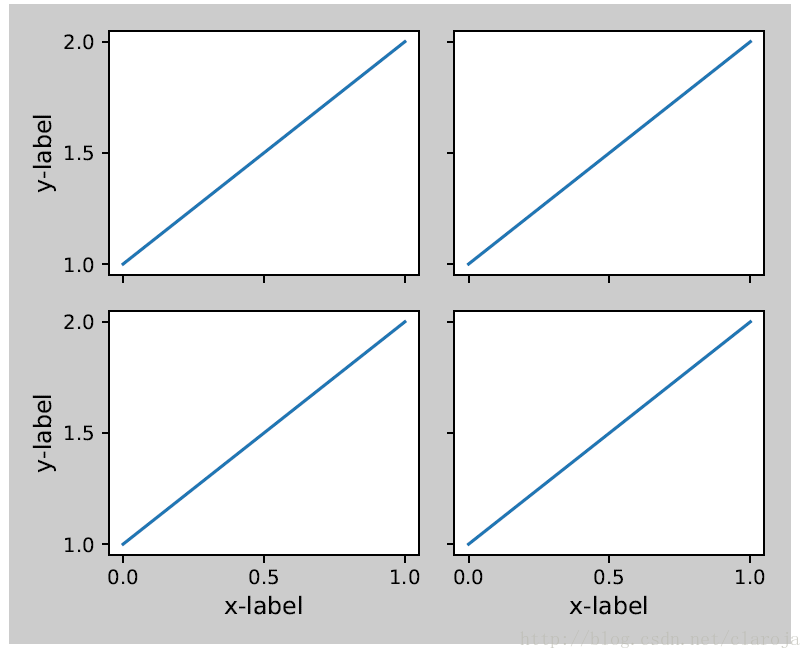
在colorbar中使用tight_layout()
colorbar是Axes的实例,而不是Subplot的实例,所以tight_layout不会起作用,在matplotlib v1.1中,你把colorbar作为一个subplot来使用gridspec。
plt.close('all')

arr = np.arange(100).reshape((10,10))

fig = plt.figure(figsize=(4, 4))

im = plt.imshow(arr, interpolation="none")

plt.colorbar(im, use_gridspec=True)

plt.tight_layout()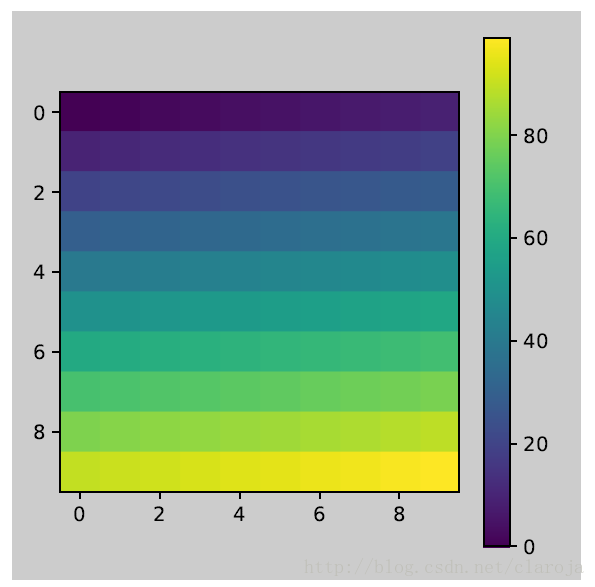
另外一个方法是,使用AxesGrid1工具箱为colorbar创建一个轴Axes
plt.close('all')

arr = np.arange(100).reshape((10,10))

fig = plt.figure(figsize=(4, 4))

im = plt.imshow(arr, interpolation="none")

from mpl_toolkits.axes_grid1 import make_axes_locatable

divider = make_axes_locatable(plt.gca())

cax = divider.append_axes("right", "5%", pad="3%")

plt.colorbar(im, cax=cax)

plt.tight_layout()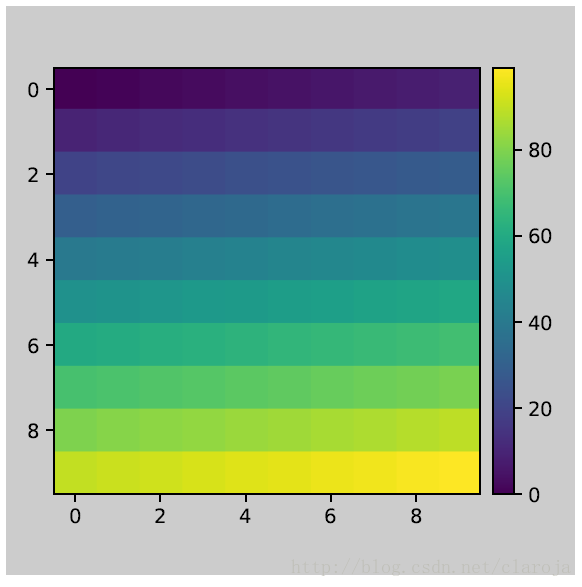
代码:
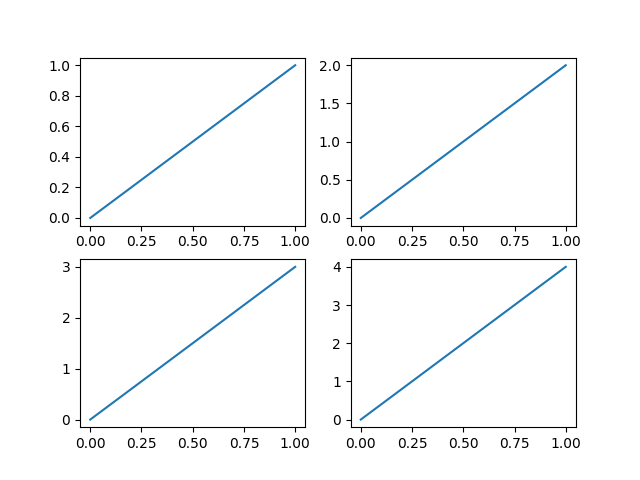
import matplotlib.pyplot as plt

# 多合一显示

# 模式一

plt.figure(1)

plt.subplot(2, 2, 1)

plt.plot([0, 1], [0, 1])

plt.subplot(2, 2, 2)

plt.plot([0, 1], [0, 2])

plt.subplot(2, 2, 3)

plt.plot([0, 1], [0, 3])

plt.subplot(2, 2, 4)

plt.plot([0, 1], [0, 4])

# 模式二

plt.figure(2)

plt.subplot(2, 1, 1)

plt.plot([0, 1], [0, 1])

plt.subplot(2, 3, 4)

plt.plot([0, 1], [0, 2])

plt.subplot(2, 3, 5)

plt.plot([0, 1], [0, 3])

plt.subplot(2, 3, 6)

plt.plot([0, 1], [0, 4])

plt.show()
运行结果:

matplotlib subplot 子图的更多相关文章
- matplotlib 操作子图(subplot,axes)
Matplotlib 中文用户指南 3.3 使用 GridSpec 自定义子图位置 ax:matplotlib.axes._subplots.AxesSubplot,的基本操作 ax.set_xtic ...
- (转)Matplotlib的子图subplot的使用
转:https://www.jianshu.com/p/de223a79217a 前言 Matplotlib的可以把很多张图画到一个显示界面,这就设计到面板切分成一个一个子图.这是怎么做到的呢.mat ...
- python使用matplotlib:subplot绘制多个子图
1 问题描述 matploglib 能够绘制出精美的图表, 有些时候, 我们希望把一组图放在一起进行比较, 有没有什么好的方法呢? matplotlib 中提供的 subplot 可以很好的解决这个问 ...
- python使用matplotlib:subplot绘制多个子图 不规则画图
https://www.cnblogs.com/xiaoboge/p/9683056.html
- matplotlib添加子图(拼图功能)
我们已经知道,matplotlib是python中的一个十分好用的作图库,它的简单的使用方法可以在之前的随笔中找到.传送门:https://www.cnblogs.com/chester-cs/p/1 ...
- matplotlib ----- 多子图, subplots
这一篇讲的比较详细. http://matplotlib.org/examples/pylab_examples/subplots_demo.html 官方文档给出的subplots用法, http: ...
- matplotlib subplot 多图合一
1:第一种方法 # method1: subplot2grid ################# ''' 第一个参数(3, 3) 是把图分成3行3列 第二个参数是位置 (0, 0)表示从0行0列开始 ...
- matplotlib画子图时设置总标题
matplotlib subplots绘图时 设置总标题 :fig.suptitle(name)
- matplotlib调整子图大小
因为子图太多而导致每个子图很小,很密,如何调整
随机推荐
- nginx 反向代理配置 upstream
最近项目要写后台,用nodejs写服务接口,然后研究了下nginx反向代理,各种坑下来,也总算把代理配了下来. 我本地用nodejs起了两个服务,一个端口是8888,一个端口是8889,在启动ngin ...
- 36小时极客嘉年华!FISCO BCOS黑客马拉松报名启动
FISCO BCOS是完全开源的联盟区块链底层技术平台,由金融区块链合作联盟(深圳)(简称金链盟)成立开源工作组通力打造.开源工作组成员包括博彦科技.华为.深证通.神州数码.四方精创.腾讯.微众银行. ...
- Exception inside CORBA when accessing a remote bean
http://stackoverflow.com/questions/23291520/exception-inside-corba-when-accessing-a-remote-bean
- .NET 基础 一步步 一幕幕[XML基础操作]
XML可扩展标记语言,标准通用标记语言的子集,是一种用于标记电子文件使其具有结构性的标记语言. 什么是XML,学他有什么用? 优点:容易读懂,格式标准任何语言都内置了XML分析引擎,不用单独进行文件分 ...
- C++文件操作方法小结
- 获取文件句柄 - fopen, fclose fopen(filename, opentype): 按照opentype的方式打开指定文件,打开失败返回NULL,否则返回文件句柄. 打开类型的属性 ...
- 矩形面积并-扫描线 线段树 离散化 模板-poj1151 hdu1542
今天刚看到这个模板我是懵逼的,这个线段树既没有建树,也没有查询,只有一个update,而且区间成段更新也没有lazy标记....研究了一下午,我突然我发现我以前根本不懂扫描线,之所以没有lazy标记, ...
- ASP.NET Core Linux
环境说明 CentOS / 7.1 (64bit) (Linux操作系统) 3MySQL5.7(网站应用数据库) .NET Core SDK 2.0.0(网站应用环境) Nginx(反向代理服务器) ...
- VS2013使用EF6通过ADO.NET 连接mySql成功步骤
VS2013使用EF6通过ADO.NET 连接mySql成功步骤 1.安装mysql-for-visualstudio-1.2.6(我用的目前最新版,这个一般安装VS2013就已经有了,没有的话下载一 ...
- ios 绘制虚线 CGContextSetLineDash的使用
画虚线需要用到函数: CGContextSetLineDash 此函数需要四个参数: context – 这个不用多说 phase - 稍后再说 lengths – 指明虚线是如何交替绘制,具体看例子 ...
- Mysql中WHERE IN,UNION 用法详解
WHERE IN 用法 这里分两种情况来介绍 1.in 后面是记录集,如: select * from table where uname in(select uname from ...