
Visualize real-time data streams with Gnuplot
(September 2008)
For the last couple of years, I've been working on European Space Agency (ESA) projects - writing rather complex code generators. In the ESA project I am currently working on, I am also the technical lead; and I recently faced the need to (quickly) provide real-time plotting of streaming data. Being a firm believer in open-source, after a little Googling I found Gnuplot. From my (somewhat limited) viewpoint, Gnuplot appears to be the LaTEX equivalent in the world of graphs: amazing functionality that is also easily accessible. Equally important, Gnuplot follows the powerful paradigm that UNIX established: it comes with an easy to use scripting language, thus allowing its users to prescribe actions and "glue" Gnuplot together with other applications - and form powerful combinations.
To that end, I humbly submit a little creation of mine: a Perl script that spawns instances of Gnuplot and plots streaming data in real-time.
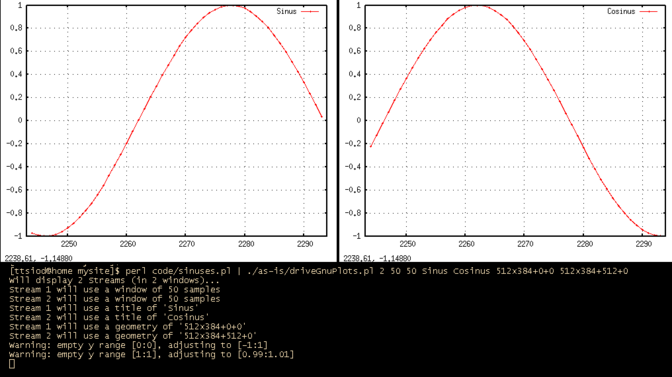
Plotting data in real-time
Interfacing over standard input
My coding experience has taught me to strive for minimal and complete interfaces: to that end, the script plots data that will arrive over the standard input, one sample per line. The samples are just numbers (integers / floating point numbers), and must be prefixed with the stream number ("0:", "1:", etc). Each plot window will also be configured to display a specific number of samples.
The resulting script is relatively simple - and easy to use:
bash ./driveGnuPlots.pl

Usage: ./driveGnuPlots.pl <options>

where options are (in order):

NumberOfStreams                         How many streams to plot (windows)

Stream1_WindowSampleSize <Stream2...>   This many window samples for each stream

Stream1_Title <Stream2_Title> ...       Title used for each stream

(Optional) Stream1_geometry <...>.      Sizes and positions in pixels

The last parameters (the optionally provided geometries of the gnuplot windows)

are of the form:

  WIDTHxHEIGHT+XOFF+YOFF
Note that the script uses the "autoscale" feature of GnuPlot, to automatically adapt to the incoming value ranges.
An example usage scenario: plotting sine and cosine
Let's say we want to see a sine and a cosine run side-by-side, in real-time. We also want to watch the cosine "zooming-in" by 10x (time-scale wise). The following code will print our test samples:
#!/usr/bin/perl -w

use strict;

use Time::HiRes qw/sleep/;

# First, set the standard output to auto-flush

select((select(STDOUT), $| = 1)[0]);

# And loop 5000 times, printing values...

my $offset = 0.0;

while(1) {

    print "0:".sin($offset)."\n";

    print "1:".cos($offset)."\n";

    $offset += 0.1;

    if ($offset > 500) {

        last;

    }

    sleep(0.02);

}
We'll use this code to test our plotting script: the data for two streams (sine and cosine) are printed in the expected format: one sample (one number) printed per line. To distinguish between the two streams, the sample is prefixed with "0:", "1:", etc. Notice that we explicitly set the autoflush flag for our standard output: we need the data output to be unbuffered, otherwise our plotting script will receive data in bursts (when the data are flushed from the producer), and the plots will "jerk" forward.
This is how we test the plotting script (assuming we saved the sample code above in sinuses.pl): <
bash$ ./sinuses.pl | ./driveGnuPlots.pl 2 50 500 "Sine" "Cosine"
To stop the plotting, use Ctrl-C on the terminal you spawned from.
The parameters we passed to driveGnuPlots.pl are:
- 2 is the number of streams
- The window for the first stream (sine) will be 50 samples wide
- The window for the second stream (cosine) will be 500 samples wide (hence the different "zoom" factor)
- The titles of the two streams follow
When executed, the script spawns one gnuplot per each stream, and displays the graphs in a clear, flicker-free manner. If you don't like the Gnuplot settings I used (e.g. the grid, or the colors, or...) feel free to change them: the setup code that defines the plotting parameters starts at line 82 of the script.
Executive summary: plotting streaming data is now as simple as selecting them out from your "producer" program (filtering its standard output through any means you wish: grep, sed, awk, etc), and outputing them, one number per line. Just remember to prefix with the stream number ("0:", "1:", etc, to allow for multiple streams), and make sure you flush your standard output, e.g.
For this kind of output:

    bash$ /path/to/programName

    ...(other stuff)

    Measure:   7987.3

    ...(other stuff)

    Measure:   8364.4

    Measure:   8128.1

    ...

You would do this:

    bash$ /path/to/programName | \

	grep --line-buffered '^Measure:' | \

	awk -F: '{printf("0:%f\n", $2); fflush();}' | \

	driveGnuPlots.pl 1 50 "My data"
In the code above, grep filters out the lines that start with "Measure:", and awk selects the 2nd column ($2) and prefixes it with "0:" (since this is the 1st - and only, in this example - stream we will display). Notice that we used the proper options to force the standard output's flushing for both grep (--line-buffered) and awk (fflush() called).
Preparing for a demo
You don't want to move the GnuPlot windows after they are shown, do you? So you can just specify their placement, in "WIDTHxHEIGHT+XOFF+YOFF" format (in pixels):
bash$ ./sinus.pl | ./driveGnuPlots.pl 2 50 50 Sinus Cosinus 512x384+0+0 512x384+512+0
The provisioning of titles and GnuPlot window placement information, makes the script very well-suited for live demonstrations.
P.S. UNIX power in all its glory: it took me 30min to code this, and another 30 to debug it. Using pipes to spawned copies of gnuplots, we are able to do something that would require one or maybe two orders of magnitude more effort in any conventional programming language (yes, even accounting for custom graph libraries - you do have to learn their API and do your windows/interface handling...)
Visualize real-time data streams with Gnuplot的更多相关文章
- FunDA(9)- Stream Source:reactive data streams
上篇我们讨论了静态数据源(Static Source, snapshot).这种方式只能在预知数据规模有限的情况下使用,对于超大型的数据库表也可以说是不安全的资源使用方式.Slick3.x已经增加了支 ...
- NTFS格式下的Alternate Data Streams
今天我写点NTFS的交换数据流以及其带来的安全问题(Alternate Data Stream/ADS) =============================================== ...
- Awesome Big Data List
https://github.com/onurakpolat/awesome-bigdata A curated list of awesome big data frameworks, resour ...
- 翻译-In-Stream Big Data Processing 流式大数据处理
相当长一段时间以来,大数据社区已经普遍认识到了批量数据处理的不足.很多应用都对实时查询和流式处理产生了迫切需求.最近几年,在这个理念的推动下,催生出了一系列解决方案,Twitter Storm,Yah ...
- Exploring the 7 Different Types of Data Stories
Exploring the 7 Different Types of Data Stories What makes a story truly data-driven? For one, the n ...
- The difference between text mode and binary mode with file streams
FIO14-C. Understand the difference between text mode and binary mode with file streams Skip to e ...
- THE R QGRAPH PACKAGE: USING R TO VISUALIZE COMPLEX RELATIONSHIPS AMONG VARIABLES IN A LARGE DATASET, PART ONE
The R qgraph Package: Using R to Visualize Complex Relationships Among Variables in a Large Dataset, ...
- Flink应用案例:How Trackunit leverages Flink to process real-time data from industrial IoT devices
January 22, 2019Use Cases, Apache Flink Lasse Nedergaard Recently there has been significant dis ...
- explore your hadoop data and get real-time results
deep api integration makes getting value from your big data easy 深度api集成使你大数据訪问更加easy Elasticsearch ...
随机推荐
- DIV嵌套垂直居中
第一记住一点:父级相对定位,子级绝对定位 下面演示CSS样式: .父级DIV{ margin:0px auto; position:relative; border:2px solid #ff0000 ...
- 分享AceAdminUI后台框架-你喜欢吗?
距离上次写文章也很久了,这次分享一下自己刚刚看上的一款UI框架(自己买的),国外货,提供下载 第100位评论的我将会送出一个小礼物 礼物链接:http://yanghenglian.taobao.co ...
- Linux Shell系列教程之(十三)Shell分支语句case … esac教程
本文是Linux Shell系列教程的第(十三)篇,更多Linux Shell教程请看:Linux Shell系列教程 分支语句非常实用,基本上高级语言都支持分支语句(python 没有),大多数都使 ...
- 关于SQL Server的WITH(NOLOCK)和(NOLOCK)
The difference is that you should be using the syntax WITH (NOLOCK) (or WITH (<any table hint> ...
- 初识 easyui datagrid
首先应该下载好easyui datagrid所用的各种js 和css 这个可以到官网上去下载. 首先要引入datagrid所引入的js和css. <script src="js/jqu ...
- java微信开发
所谓的微信开发就是在微信开发模式之下,对微信进行公众号和企业号的扩展开发. 如果要让你的微信公众号有更多的功能,比如菜单支持,自动的信息服务,查询,消息推送等,就必须开启微信的开发模式.进入微 ...
- html5 大幅度地增加和改良input元素的种类
增加和改良input元素 url类型.email类型.date类型.time类型.datetime类型.datetime-local类型.month类型.week类型.number类型.range类型 ...
- js和html5实现画板
html5新添了一个重要又强大的标签元素<canvas>,该标签真有彻底替换掉flash的尽头,现在很多网页游戏就是用<canvas>完成的,下面代码就是用该标签制作的一个画板 ...
- iOS仿京东分类菜单之UICollectionView内容
在上<iOS仿京东分类菜单实例实现>已经实现了大部分主体的功能,本文是针对右边集合列表进行修改扩展,使它达到分组的效果,本文涉及到的主要是UICollectionView的知识内容,左边列 ...
- WPF Caliburn.Micro ListView 批量删除,有其他方法的大家一起交流一下
做这种批量删除的时候我的想法是获取每行的ID,然后更具ID删除,看过一些博客,大部分都是直接写在.CS文件里面,将ListView和CheckBox关联起来,最后用checkbox ck=sender ...