Matlab矢量图图例函数quiverkey
Matlab自带函数中不包含构造 quiver 函数注释过程,本文参照 matplotlib 中 quiverkey 函数,构造类似函数为 Matlab 中 quiver 矢量场进行标注。
quiverkey函数
首先看 matplotlib 中 quiverkey 如何定义的
quiverkey(*args, **kw)

Add a key to a quiver plot.

Call signature::

  quiverkey(Q, X, Y, U, label, **kw)

Arguments:

  *Q*:

    The Quiver instance returned by a call to quiver.

  *X*, *Y*:

    The location of the key; additional explanation follows.

  *U*:

    The length of the key

  *label*:

    A string with the length and units of the key

Keyword arguments:

  *coordinates* = [ 'axes' | 'figure' | 'data' | 'inches' ]

    Coordinate system and units for *X*, *Y*: 'axes' and 'figure' are

    normalized coordinate systems with 0,0 in the lower left and 1,1

    in the upper right; 'data' are the axes data coordinates (used for

    the locations of the vectors in the quiver plot itself); 'inches'

    is position in the figure in inches, with 0,0 at the lower left

    corner.

  *color*:

    overrides face and edge colors from *Q*.

  *labelpos* = [ 'N' | 'S' | 'E' | 'W' ]

    Position the label above, below, to the right, to the left of the

    arrow, respectively.

  *labelsep*:

    Distance in inches between the arrow and the label.  Default is

    0.1

  *labelcolor*:

    defaults to default :class:`~matplotlib.text.Text` color.

  *fontproperties*:

    A dictionary with keyword arguments accepted by the

    :class:`~matplotlib.font_manager.FontProperties` initializer:

    *family*, *style*, *variant*, *size*, *weight*

Any additional keyword arguments are used to override vector

properties taken from *Q*.

The positioning of the key depends on *X*, *Y*, *coordinates*, and

*labelpos*.  If *labelpos* is 'N' or 'S', *X*, *Y* give the position

of the middle of the key arrow.  If *labelpos* is 'E', *X*, *Y*

positions the head, and if *labelpos* is 'W', *X*, *Y* positions the

tail; in either of these two cases, *X*, *Y* is somewhere in the

middle of the arrow+label key object.

Additional kwargs: hold = [True|False] overrides default hold state
可以看到主要参数有这么些个
- quiver绘图指针
- 图例位置
X, Y - 标注大小
U - 标注单位字符
- 其他参数
1). 输入坐标X, Y单位
2). (文字)标注在图例哪个位置
3). 标注与图例相对距离
4). 标注字体颜色
使用方法:
对应Matlab函数也应该使用这么个流程
- 使用quiver绘图
- 将quiver返回指针与图例位置坐标和大小等作为参数传入
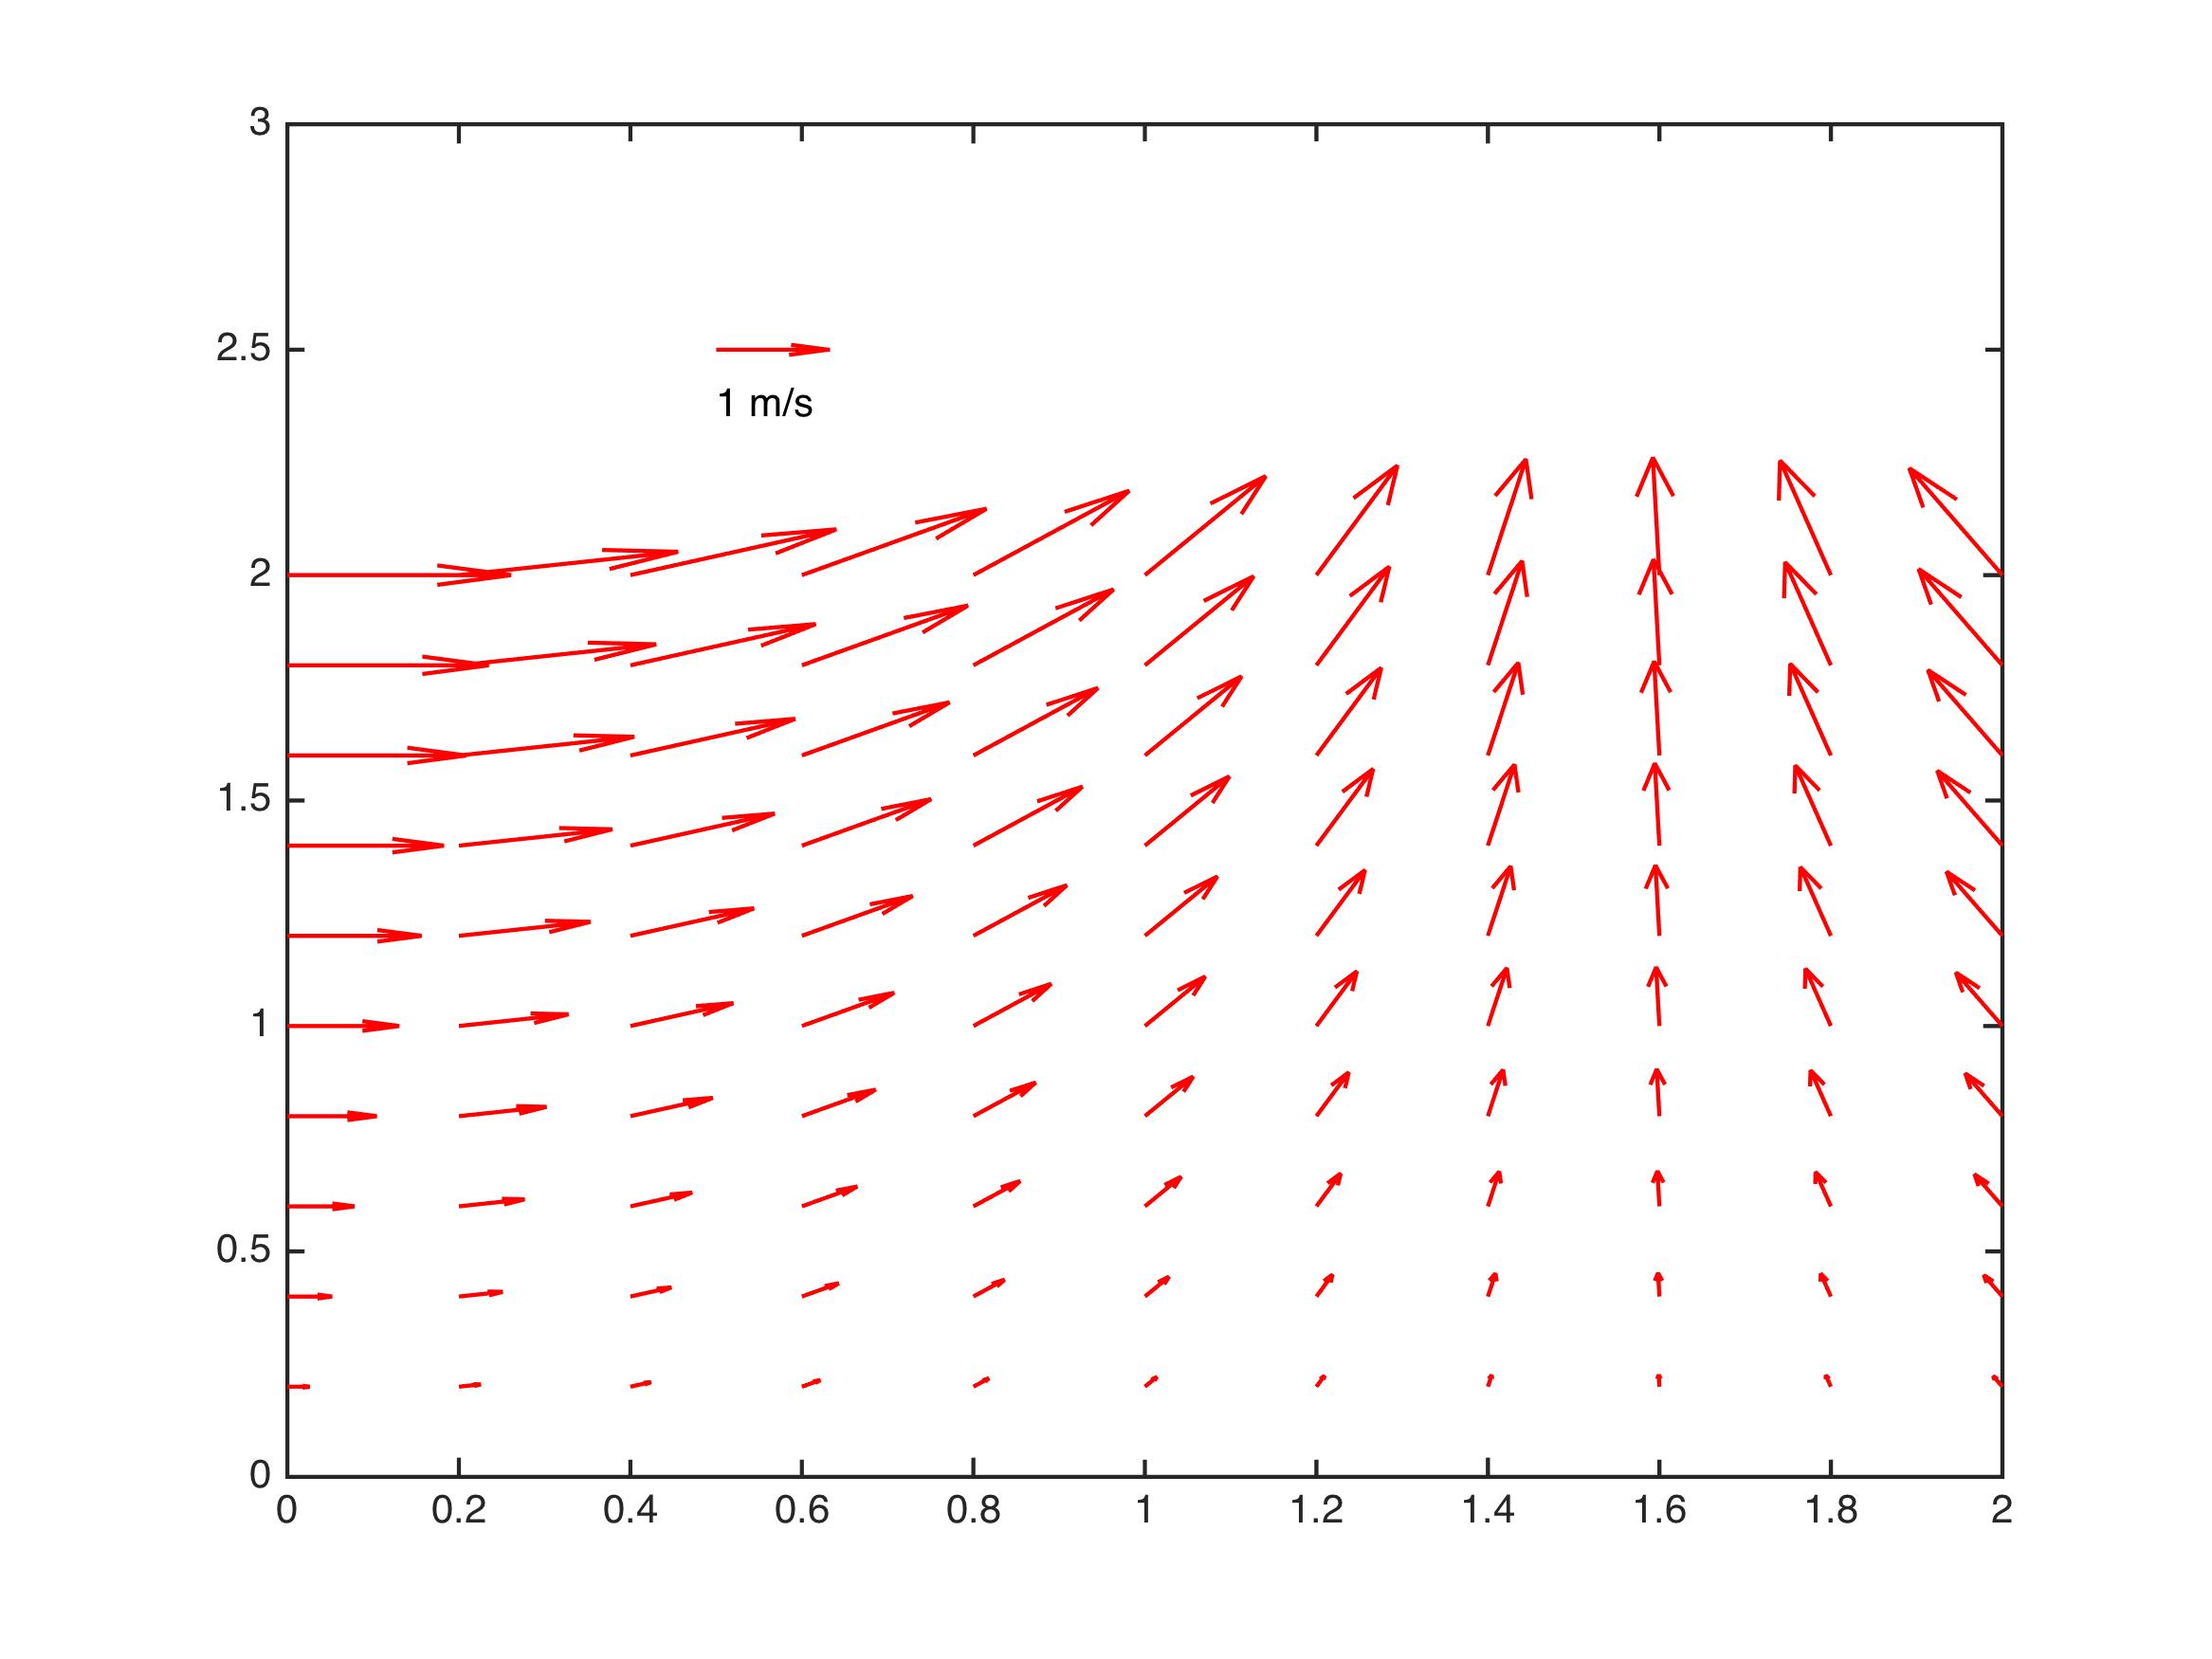
示例
[x,y] = meshgrid(0:0.2:2,0:0.2:2);

u = cos(x).*y;

v = sin(x).*y;

figure;

Qh = quiver(x,y,u,v);

quiverkey(Qh, 0.5, 2.5, 1, 'm/s', 'Color', 'r', 'Coordinates', 'data')
最终效果图
代码
function Q = quiverkey(Q, X, Y, U, label, varargin)

%QUIVERKEY legend for quiver

%

%   QUIVERKEY(Q, X, Y, U, label)

%

%   Arguments:

%       Q :      The quiver handle returned by a call to quiver

%       X,Y :    The location of the legend

%       U :      The unit length. If U<0, the arrow will be reversed

%       label :  The string with the length and units of the key

%

%   Addition arguments:

%       Coordinates = [ 'axes' | 'data'(default) ]

%

%           'axes' & 'figure' : 'axes' and 'figure' are normalized

%                       coordinate systems with 0,0 in the lower left

%                       and 1,1 in the upper right;

%           'data' :    use the axes data coordinates

%

%       LabelDistance : Distance in 'coordinates' between the arrow and the

%                   label. Deauft is 0.1 (units 'axes').

%

%       Color : overrides face and edge colors from Q.

%

%       LabelPosition = [ 'N' | 'S'(default) | 'E' | 'W' ]

%

%               Position the label above, below, to the right,

%               to the left of the arrow, respectively.

%

%       LabelColor : defaults to black

%

%   Examples:

%

%   [x,y] = meshgrid(0:0.2:2,0:0.2:2);

%   u = cos(x).*y;

%   v = sin(x).*y;

%   figure; Qh = quiver(x,y,u,v);

%   quiverkey(Qh, 0.5, 2.5, 1, 'm/s', 'Color', 'r', 'Coordinates', 'data')

%

% Author:

%   li12242 - Department of Civil Engineering in Tianjin University

% Email:

%   li12242@tju.edu.cn

%

%% get input argument

if nargin < 5

    error('Input arguments" Number incorrect!')

end

if isempty(varargin) && mod(length(varargin), 2) ~= 0

    error('Input arguments donot pairs!')

else

    [CoorUnit, LabelDist, Color, LabelPosition, LabelColor] = getInput(varargin);

end

%% add legend arrow

% get original data

xData = get(Q, 'XData'); yData = get(Q, 'YData');

uData = get(Q, 'UData'); vData = get(Q, 'VData');

% get axes properties

haxes = get(Q, 'Parent');

xLim = get(haxes, 'XLim'); yLim = get(haxes, 'YLim');

NextPlot = get(haxes, 'NextPlot');

% set axes properties

set(haxes, 'NextPlot', 'add')

if strcmp(CoorUnit, 'axes')

    % position of legend arrow

    xa = xLim(1) + X*(xLim(2) - xLim(1));

    ya = yLim(1) + Y*(yLim(2) - yLim(1));

else

    xa = X; ya = Y;

end

% add legend arrow into data vector

xData = [xData(:); xa]; yData = [yData(:); ya];

uData = [uData(:); U];  vData = [vData(:); 0];

% reset data

set(Q, 'XData', xData, 'YData', yData, 'UData', uData, 'VData', vData);

set(Q, 'Color', Color)

%% add text

dx = LabelDist*(xLim(2) - xLim(1));

dy = LabelDist*(yLim(2) - yLim(1));

% set position of label

switch LabelPosition

    case 'N'

        xl = xa; yl = ya + dy;

    case 'S'

        xl = xa; yl = ya - dy;

    case 'E'

        xl = xa + dx; yl = ya;

    case 'W'

        xl = xa - dx; yl = ya;

end% switch

th = text(xl, yl, [num2str(U), ' ', label]);

set(th, 'Color', LabelColor);

% turn axes properties to original

set(haxes, 'NextPlot', NextPlot)

end% func

%% sub function

function [CoorUnit, LabelDist, Color, LabelPosition, LabelColor] = getInput(varcell)

% Input:

%   varcell - cell variable

% Output:

%

nargin = numel(varcell);

%% set default arguments

CoorUnit = 'data';

LabelDist = 0.05; % units 'axes'

Color = 'k';

LabelPosition = 'S';

LabelColor = 'k';

%% get input arguments

contour = 1;

while contour < nargin

    switch varcell{contour}

        case 'Coordinates'

            CoorUnit = varcell{contour+ 1};

        case 'LabelDistance'

            LabelDist = varcell{contour+ 1};

        case 'Color'

            Color = varcell{contour+ 1};

        case 'LabelPosition'

            LabelPosition = varcell{contour+ 1};

        case 'LabelColor'

            LabelColor = varcell{contour+ 1};

        otherwise

            error('Unknown input argument.')

    end% switch

    contour = contour + 2;

end% while

end% fun
Matlab矢量图图例函数quiverkey的更多相关文章
- matlab 矢量化编程(四)—— 标量函数转化为能够处理矢量的函数
1. 组合的矢量实现 nchoosek(n, k) 的第二个参数在 matlab 下是不支持矢量化的,必须是标量形式.但 matlab 下的 gamma 函数,却可支持,矢量形式,又因为,gamma ...
- matlab中help所有函数功能的英文翻译
doc funname 在帮助浏览器中打开帮助文档 help funname 在命令窗口打开帮助文档 helpbrowser 直接打开帮助浏览器 lookfor funname 搜索某个关键字相关函数 ...
- C# 导出一个控件的矢量图
调用Control.DrawToBitmap(Bitmap) 方法是很容易得到控件的图形的. 但是bitmap是栅格化图形.栅格化图形有很多缺点,比如文件体积比较大. 放大后失真. 不易编辑等等. 这 ...
- matlab 全部的随机数函数
matlab 全部的随机数函数 (一)Matlab内部函数 a. 基本随机数 Matlab中有两个最基本生成随机数的函数. 1.rand() 生成(0,1)区间上均匀分布的随机变量.基本语法: ran ...
- Android 开发 VectorDrawable 矢量图 (三)矢量图动画
VectorDrawable 矢量图 三部曲: Android 开发 VectorDrawable 矢量图 (一)了解Android矢量图与获取矢量图 Android 开发 VectorDrawabl ...
- D3.js (v3)+react框架 基础部分之认识选择集和如何绘制一个矢量图
首先需要下载安装d3.js : yarn add d3 然后在组建中引入 : import * as d3 from 'd3' 然后定义一个方法,在componentDidMount()这个钩子 ...
- 矢量图和Word:EPS,PDF,EMF和SVG
1.EMF和Word 在学校的时候,我思考过一个问题,论文中的插图如何保证清晰度.关键之一就是使用矢量图.参考知乎问题:如何在论文中画出漂亮的插图?.常见的矢量图包括:EPS,EMF和SVG.SVG适 ...
- Matlab随笔之画图函数总结
原文:Matlab随笔之画图函数总结 MATLAB函数画图 MATLAB不但擅长於矩阵相关的数值运算,也适合用在各种科学目视表示(Scientific visualization).本节将介绍MATL ...
- Matlab中的eig函数和Opecv中eigen()函数的区别
奇异值分解的理论参见下面的链接 http://www.cnblogs.com/pinard/p/6251584.html https://blog.csdn.net/shenziheng1/artic ...
随机推荐
- 性能利器 Takin 来了!首个生产环境全链路压测平台正式开源
6 月 25 日,国内知名的系统高可用专家数列科技宣布开源旗下核心产品能力,对外开放生产全链路压测平台产品的源代码,并正式命名为 Takin. 目前中国人寿.顺丰科技.希音.中通快递.中国移动.永辉超 ...
- seata整合多数据源
seata整合多数据源 一.背景 二.整合步骤 1.seata server的搭建 2.引入数据源切换组件 3.引入seata组件 4.配置多数据源 5.关闭seata自己默认的数据源代理 6.配置s ...
- Spring Security Jwt Token 自动刷新
token的自动刷新 一.功能需求 二.功能分析 1.token 的生成 2.token 的自动延长 3.系统资源的保护 4.用户如何传递 token 三.实现思路 1.生成 token 和 refr ...
- 所驼门王的宝藏(Tarjan)
题目描述 在宽广的非洲荒漠中,生活着一群勤劳勇敢的羊驼家族.被族人恭称为"先知"的Alpaca L. Sotomon是这个家族的领袖,外人也称其为"所驼门王". ...
- 广域网(ppp协议、HDLC协议)
文章转自:https://blog.csdn.net/weixin_43914604/article/details/105028759 学习课程:<2019王道考研计算机网络> 学习目的 ...
- Java并发:ReadWriteLock 读写锁
读写锁在同一时刻可以允许多个线程访问,但是在写线程访问,所有的读线程和其他写线程均被阻塞. 读写锁不像 ReentrantLock 那些排它锁只允许在同一时刻只允许一个线程进行访问,读写锁可以允许多个 ...
- Typora使用教程
Typora简介 Typorn 是一款轻便简洁的Markdown编辑器,支持及时渲染技术,这也是与其他Markdown编辑器最显著的区别.及时渲染使得你写Markdown就像是写Word文档一样流畅自 ...
- 一、安装zabbix监控(源码编方式)
首先介绍一下zabbix的运行原理和运行条件. Zabbix监控原理 Zabbix 通过C/S 模式采集数据,通过B/S模式在web 端展示和配置. 被监控端:主机通过安装agent 方式采集数据, ...
- "迷途"的野指针,都快找不着北了
指针,C语言开发者表示很淦,指针的使用,很多人表示不敢直面ta,不像Java一样,有垃圾自动回收功能,我们不用担心那么多内存泄漏等问题,那C语言里边呢,指针又分为了"野指针",&q ...
- 初步认识express,并创建web服务器,挂载静态资源
1.Express简介 1.1什么是Express 官方给出的概念:Express 是基于 Node.js 平台,快速.开放.极简的 Web 开发框架,官方网址 相似用途:Express 的作用和 N ...