Matlab矢量图图例函数quiverkey
Matlab自带函数中不包含构造 quiver 函数注释过程,本文参照 matplotlib 中 quiverkey 函数,构造类似函数为 Matlab 中 quiver 矢量场进行标注。
quiverkey函数
首先看 matplotlib 中 quiverkey 如何定义的
quiverkey(*args, **kw)

Add a key to a quiver plot.

Call signature::

  quiverkey(Q, X, Y, U, label, **kw)

Arguments:

  *Q*:

    The Quiver instance returned by a call to quiver.

  *X*, *Y*:

    The location of the key; additional explanation follows.

  *U*:

    The length of the key

  *label*:

    A string with the length and units of the key

Keyword arguments:

  *coordinates* = [ 'axes' | 'figure' | 'data' | 'inches' ]

    Coordinate system and units for *X*, *Y*: 'axes' and 'figure' are

    normalized coordinate systems with 0,0 in the lower left and 1,1

    in the upper right; 'data' are the axes data coordinates (used for

    the locations of the vectors in the quiver plot itself); 'inches'

    is position in the figure in inches, with 0,0 at the lower left

    corner.

  *color*:

    overrides face and edge colors from *Q*.

  *labelpos* = [ 'N' | 'S' | 'E' | 'W' ]

    Position the label above, below, to the right, to the left of the

    arrow, respectively.

  *labelsep*:

    Distance in inches between the arrow and the label.  Default is

    0.1

  *labelcolor*:

    defaults to default :class:`~matplotlib.text.Text` color.

  *fontproperties*:

    A dictionary with keyword arguments accepted by the

    :class:`~matplotlib.font_manager.FontProperties` initializer:

    *family*, *style*, *variant*, *size*, *weight*

Any additional keyword arguments are used to override vector

properties taken from *Q*.

The positioning of the key depends on *X*, *Y*, *coordinates*, and

*labelpos*.  If *labelpos* is 'N' or 'S', *X*, *Y* give the position

of the middle of the key arrow.  If *labelpos* is 'E', *X*, *Y*

positions the head, and if *labelpos* is 'W', *X*, *Y* positions the

tail; in either of these two cases, *X*, *Y* is somewhere in the

middle of the arrow+label key object.

Additional kwargs: hold = [True|False] overrides default hold state
可以看到主要参数有这么些个
- quiver绘图指针
- 图例位置
X, Y - 标注大小
U - 标注单位字符
- 其他参数
1). 输入坐标X, Y单位
2). (文字)标注在图例哪个位置
3). 标注与图例相对距离
4). 标注字体颜色
使用方法:
对应Matlab函数也应该使用这么个流程
- 使用quiver绘图
- 将quiver返回指针与图例位置坐标和大小等作为参数传入
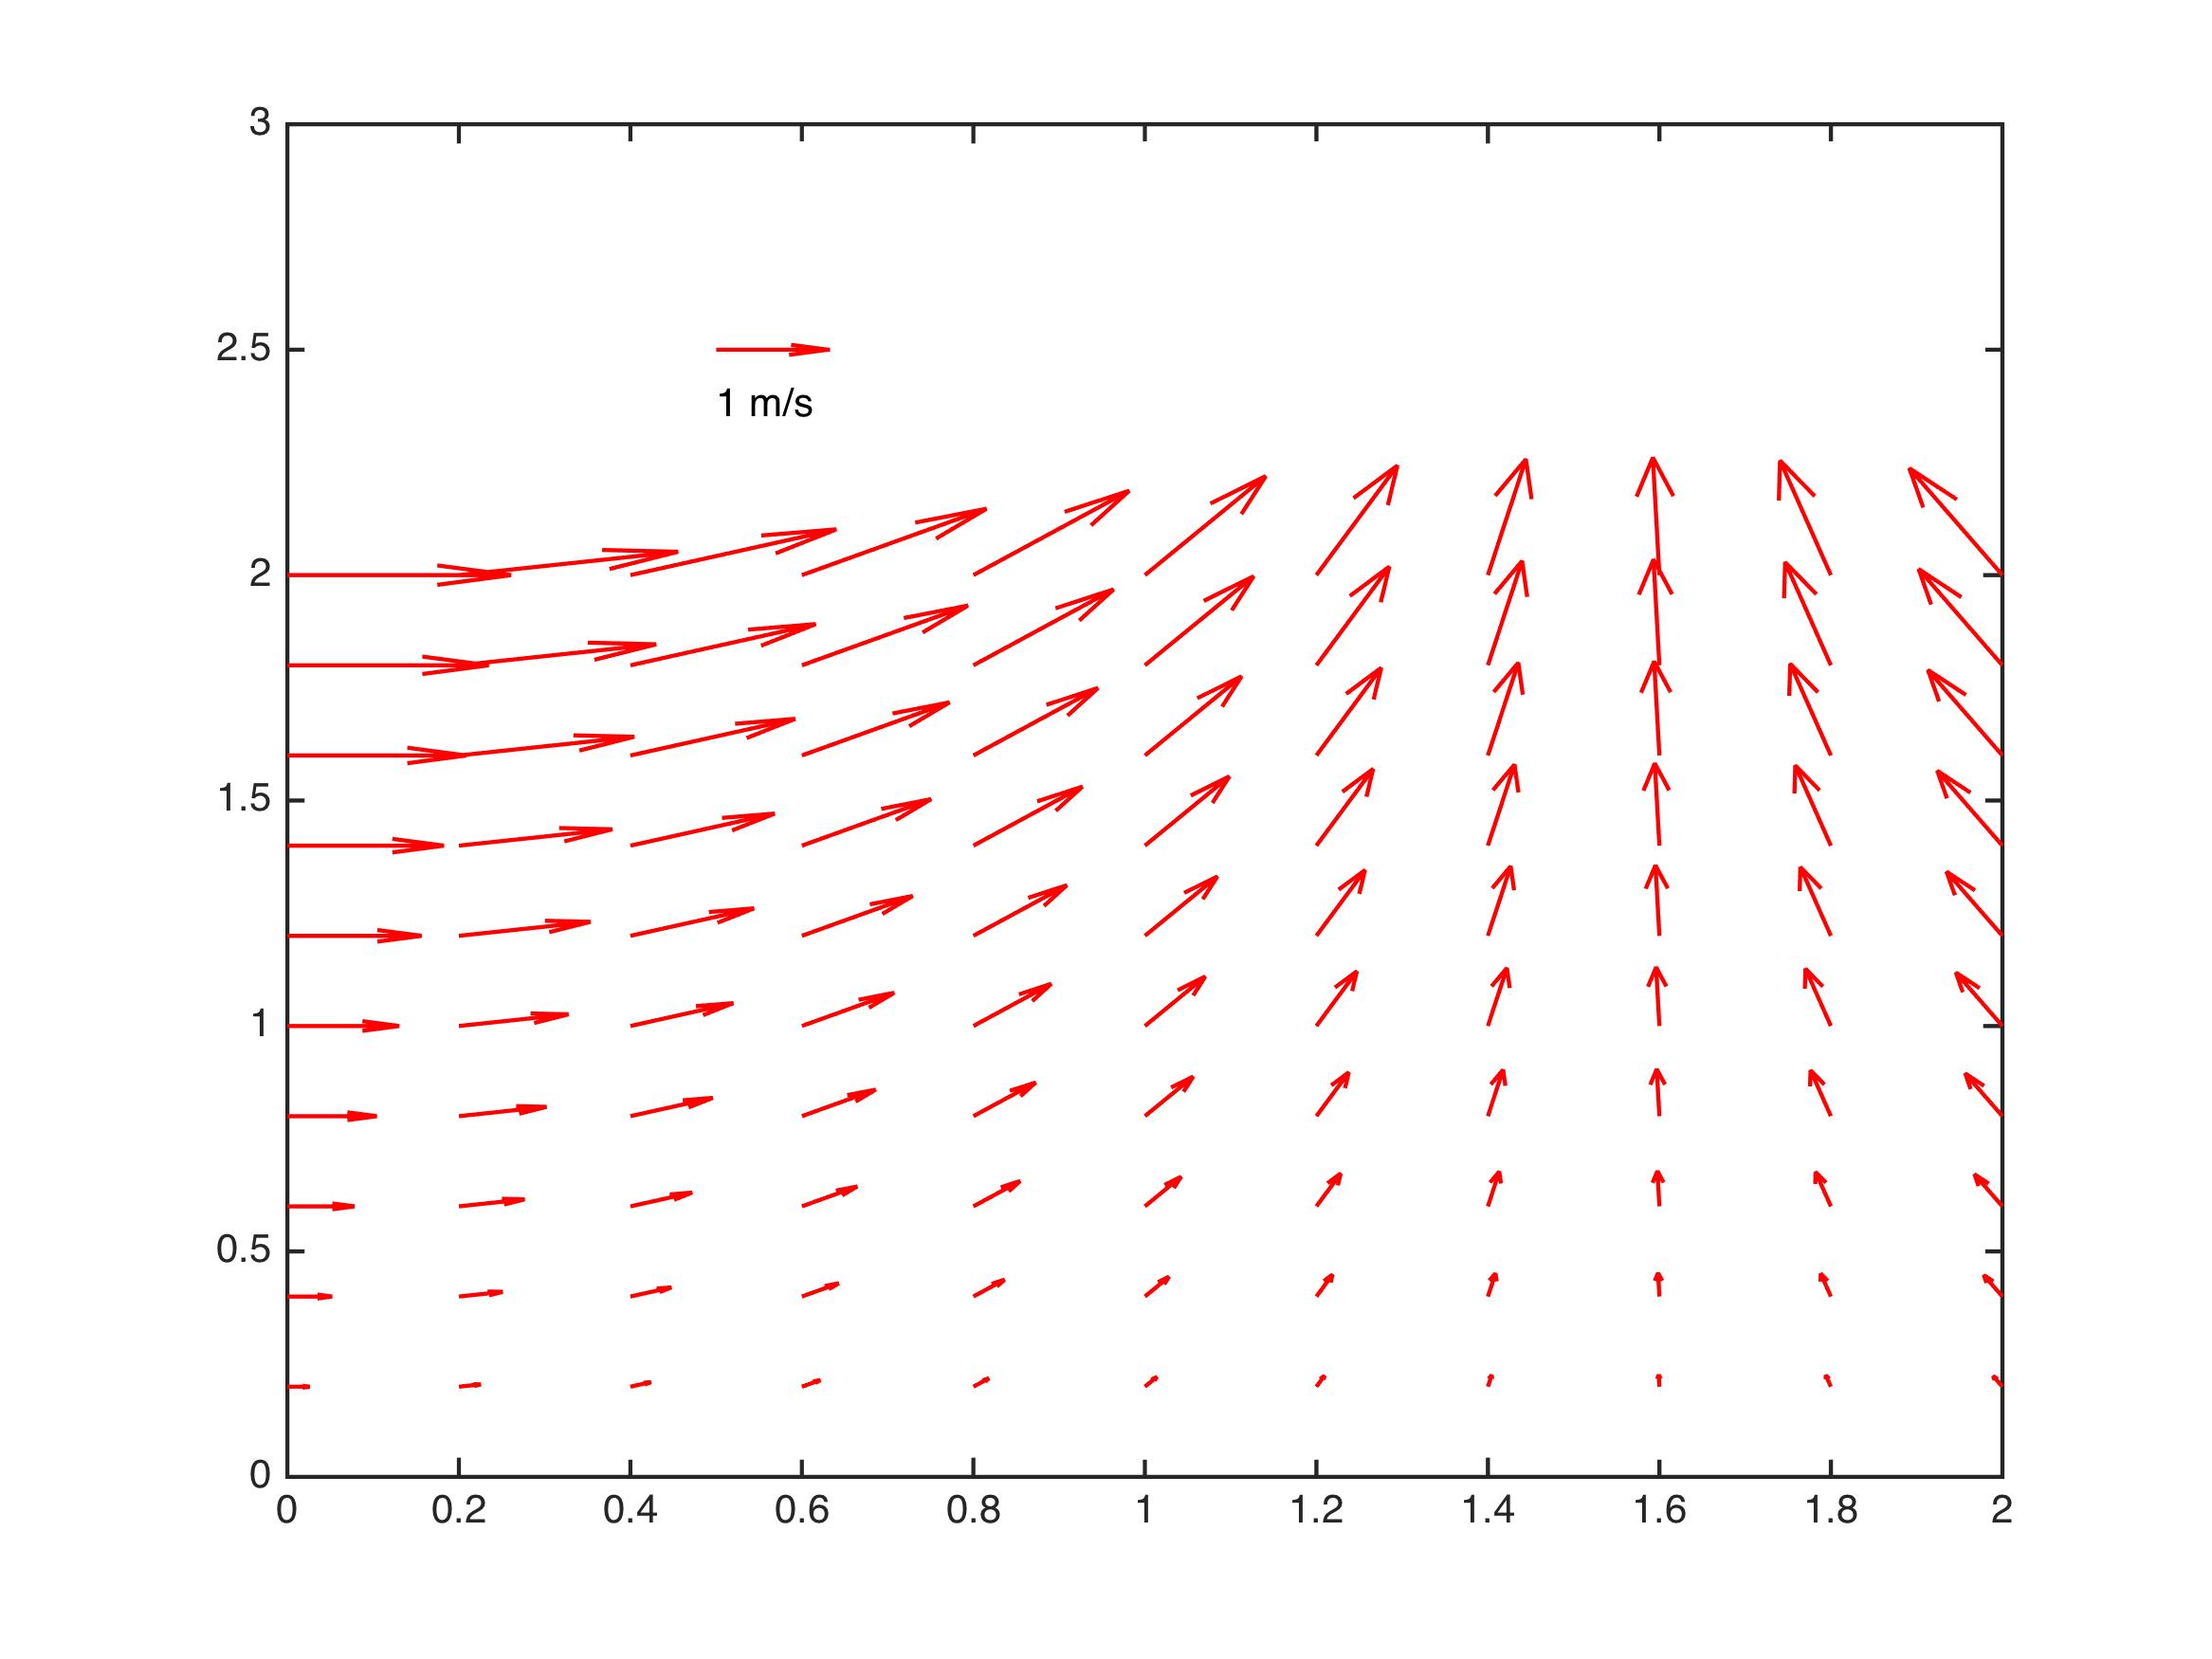
示例
[x,y] = meshgrid(0:0.2:2,0:0.2:2);

u = cos(x).*y;

v = sin(x).*y;

figure;

Qh = quiver(x,y,u,v);

quiverkey(Qh, 0.5, 2.5, 1, 'm/s', 'Color', 'r', 'Coordinates', 'data')
最终效果图
代码
function Q = quiverkey(Q, X, Y, U, label, varargin)

%QUIVERKEY legend for quiver

%

%   QUIVERKEY(Q, X, Y, U, label)

%

%   Arguments:

%       Q :      The quiver handle returned by a call to quiver

%       X,Y :    The location of the legend

%       U :      The unit length. If U<0, the arrow will be reversed

%       label :  The string with the length and units of the key

%

%   Addition arguments:

%       Coordinates = [ 'axes' | 'data'(default) ]

%

%           'axes' & 'figure' : 'axes' and 'figure' are normalized

%                       coordinate systems with 0,0 in the lower left

%                       and 1,1 in the upper right;

%           'data' :    use the axes data coordinates

%

%       LabelDistance : Distance in 'coordinates' between the arrow and the

%                   label. Deauft is 0.1 (units 'axes').

%

%       Color : overrides face and edge colors from Q.

%

%       LabelPosition = [ 'N' | 'S'(default) | 'E' | 'W' ]

%

%               Position the label above, below, to the right,

%               to the left of the arrow, respectively.

%

%       LabelColor : defaults to black

%

%   Examples:

%

%   [x,y] = meshgrid(0:0.2:2,0:0.2:2);

%   u = cos(x).*y;

%   v = sin(x).*y;

%   figure; Qh = quiver(x,y,u,v);

%   quiverkey(Qh, 0.5, 2.5, 1, 'm/s', 'Color', 'r', 'Coordinates', 'data')

%

% Author:

%   li12242 - Department of Civil Engineering in Tianjin University

% Email:

%   li12242@tju.edu.cn

%

%% get input argument

if nargin < 5

    error('Input arguments" Number incorrect!')

end

if isempty(varargin) && mod(length(varargin), 2) ~= 0

    error('Input arguments donot pairs!')

else

    [CoorUnit, LabelDist, Color, LabelPosition, LabelColor] = getInput(varargin);

end

%% add legend arrow

% get original data

xData = get(Q, 'XData'); yData = get(Q, 'YData');

uData = get(Q, 'UData'); vData = get(Q, 'VData');

% get axes properties

haxes = get(Q, 'Parent');

xLim = get(haxes, 'XLim'); yLim = get(haxes, 'YLim');

NextPlot = get(haxes, 'NextPlot');

% set axes properties

set(haxes, 'NextPlot', 'add')

if strcmp(CoorUnit, 'axes')

    % position of legend arrow

    xa = xLim(1) + X*(xLim(2) - xLim(1));

    ya = yLim(1) + Y*(yLim(2) - yLim(1));

else

    xa = X; ya = Y;

end

% add legend arrow into data vector

xData = [xData(:); xa]; yData = [yData(:); ya];

uData = [uData(:); U];  vData = [vData(:); 0];

% reset data

set(Q, 'XData', xData, 'YData', yData, 'UData', uData, 'VData', vData);

set(Q, 'Color', Color)

%% add text

dx = LabelDist*(xLim(2) - xLim(1));

dy = LabelDist*(yLim(2) - yLim(1));

% set position of label

switch LabelPosition

    case 'N'

        xl = xa; yl = ya + dy;

    case 'S'

        xl = xa; yl = ya - dy;

    case 'E'

        xl = xa + dx; yl = ya;

    case 'W'

        xl = xa - dx; yl = ya;

end% switch

th = text(xl, yl, [num2str(U), ' ', label]);

set(th, 'Color', LabelColor);

% turn axes properties to original

set(haxes, 'NextPlot', NextPlot)

end% func

%% sub function

function [CoorUnit, LabelDist, Color, LabelPosition, LabelColor] = getInput(varcell)

% Input:

%   varcell - cell variable

% Output:

%

nargin = numel(varcell);

%% set default arguments

CoorUnit = 'data';

LabelDist = 0.05; % units 'axes'

Color = 'k';

LabelPosition = 'S';

LabelColor = 'k';

%% get input arguments

contour = 1;

while contour < nargin

    switch varcell{contour}

        case 'Coordinates'

            CoorUnit = varcell{contour+ 1};

        case 'LabelDistance'

            LabelDist = varcell{contour+ 1};

        case 'Color'

            Color = varcell{contour+ 1};

        case 'LabelPosition'

            LabelPosition = varcell{contour+ 1};

        case 'LabelColor'

            LabelColor = varcell{contour+ 1};

        otherwise

            error('Unknown input argument.')

    end% switch

    contour = contour + 2;

end% while

end% fun
Matlab矢量图图例函数quiverkey的更多相关文章
- matlab 矢量化编程(四)—— 标量函数转化为能够处理矢量的函数
1. 组合的矢量实现 nchoosek(n, k) 的第二个参数在 matlab 下是不支持矢量化的,必须是标量形式.但 matlab 下的 gamma 函数,却可支持,矢量形式,又因为,gamma ...
- matlab中help所有函数功能的英文翻译
doc funname 在帮助浏览器中打开帮助文档 help funname 在命令窗口打开帮助文档 helpbrowser 直接打开帮助浏览器 lookfor funname 搜索某个关键字相关函数 ...
- C# 导出一个控件的矢量图
调用Control.DrawToBitmap(Bitmap) 方法是很容易得到控件的图形的. 但是bitmap是栅格化图形.栅格化图形有很多缺点,比如文件体积比较大. 放大后失真. 不易编辑等等. 这 ...
- matlab 全部的随机数函数
matlab 全部的随机数函数 (一)Matlab内部函数 a. 基本随机数 Matlab中有两个最基本生成随机数的函数. 1.rand() 生成(0,1)区间上均匀分布的随机变量.基本语法: ran ...
- Android 开发 VectorDrawable 矢量图 (三)矢量图动画
VectorDrawable 矢量图 三部曲: Android 开发 VectorDrawable 矢量图 (一)了解Android矢量图与获取矢量图 Android 开发 VectorDrawabl ...
- D3.js (v3)+react框架 基础部分之认识选择集和如何绘制一个矢量图
首先需要下载安装d3.js : yarn add d3 然后在组建中引入 : import * as d3 from 'd3' 然后定义一个方法,在componentDidMount()这个钩子 ...
- 矢量图和Word:EPS,PDF,EMF和SVG
1.EMF和Word 在学校的时候,我思考过一个问题,论文中的插图如何保证清晰度.关键之一就是使用矢量图.参考知乎问题:如何在论文中画出漂亮的插图?.常见的矢量图包括:EPS,EMF和SVG.SVG适 ...
- Matlab随笔之画图函数总结
原文:Matlab随笔之画图函数总结 MATLAB函数画图 MATLAB不但擅长於矩阵相关的数值运算,也适合用在各种科学目视表示(Scientific visualization).本节将介绍MATL ...
- Matlab中的eig函数和Opecv中eigen()函数的区别
奇异值分解的理论参见下面的链接 http://www.cnblogs.com/pinard/p/6251584.html https://blog.csdn.net/shenziheng1/artic ...
随机推荐
- HttpClient使用GET方式通过代理服务器读取页面的例子
import java.io.BufferedReader;import java.io.InputStreamReader;import org.apache.http.HttpEntity;imp ...
- Scrum Meeting 0607
零.说明 日期:2021-6-7 任务:简要汇报两日内已完成任务,计划后两日完成任务 一.进度情况 组员 负责 两日内已完成的任务 后两日计划完成的任务 困难 qsy PM&前端 重新设计产品 ...
- 【做题记录】[NOI2008] 假面舞会—有向图上的环与最长链
luogu 1477 [NOI2008] 假面舞会 容易发现: 如果图中没有环,那么面具种数一定是所有联通块内最长链之和,最少为 \(3\) . 如果有环,则面具种数一定是所有环的大小的最大公约数. ...
- 全志Tina_dolphin播放音视频裸流(h264,pcm)验证
最近在验证tina对裸流音视频的支持,主要指h264视频裸流及pcm音频裸流. 在原始sdk中有针对很多video和audio类型的parser,但就是没有找到pcm和h264的parser,所以需要 ...
- 【PowereDesigner】使用方法|mysql画图使用|不在跟新
自己画E-R图时, 运行:Power Designer ..1 ..2 ..3 可以先放两个空的实体,然后,分别修改属性(鼠标右键,最后一项Properties),名称为:学生.课程. ..4 创建一 ...
- #ifndef #define #endif #ifdef 避免重复引用
一:在什么阶段处理 ? 预处理 预处理 预处理 首先注意这四个头文件保护符是在预处理阶段由系统默认的预处理器(Linux操作系统上默认是cpp)来处理的.它们的含义如下: #define XXX // ...
- 2020美亚团体—Daniel篇
Daniel的桌上计算机的哈希值(SHA-256)是甚么? 通过取证大师计算 SHA-256值为 07DD40CF28603F421F3A09CD38F1C8AA40A2AC4BFB46ECF8299 ...
- 设计模式--策略模式Strategy
策略模式 算法经常需要被改变==使用S 节省资源(很多if else if-.不会被执行,却会被装载到代码段) 动机 在软件构建过程中,某些对象使用的算法可能多种多样,经常改变,如果将这些算法都编码到 ...
- 该虚拟机似乎正在使用中。如果该虚拟机未在使用,请按“获取所有权(T)”按钮获取它的所有权
问题 打开虚拟机镜像时报 VMware该虚拟机似乎正在使用中.如果该虚拟机未在使用,请按"获取所有权(T)"按钮获取它的所有权 解决方法 在你安装的镜像文件目录下找到后缀为.vmx ...
- js实现一个小游戏(飞翔的jj)
js实现一个小游戏(飞翔的jj) 源代码+素材图片在我的仓库 <!DOCTYPE html> <html lang="en"> <head> & ...