可视化库-Matplotlib-饼图与布局(第四天)
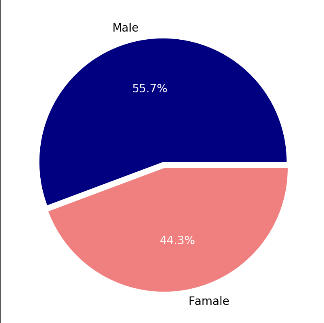
1。 画出一个基本的饼图,通过plt.pie()
m = 51212

f = 40742

m_perc = m / (m+f)

f_perc = f / (m+f)

colors = ['navy', 'lightcoral']

labels = ['Male', 'Famale']

plt.figure(figsize=(8, 8))

# autopct 表示的是使用百分号表示, explode=[0, 0.05]表示两个饼的间隔

paches, text, autotext = plt.pie([m_perc, f_perc], colors=colors, labels=labels, autopct='%1.1f%%', explode=[0, 0.05])

# 对文本添加尺寸大小 text表示外圈文本

for text in text + autotext:

    text.set_fontsize(20)

# 饼图内部的字体颜色

for text in autotext:

    text.set_color('white')

plt.show()
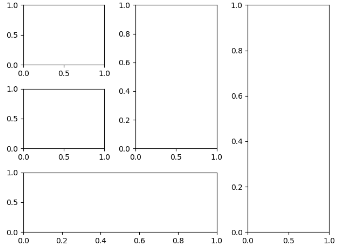
2. 设置子图布局,通过plt.subplot2grid((3, 3), (0, 0))
ax1 = plt.subplot2grid((3, 3), (0, 0))

ax2 = plt.subplot2grid((3, 3), (1, 0))

ax3 = plt.subplot2grid((3, 3), (0, 2), rowspan=3)

ax4 = plt.subplot2grid((3, 3), (2, 0), colspan=2)

ax5 = plt.subplot2grid((3, 3), (0, 1), rowspan=2)

plt.show()
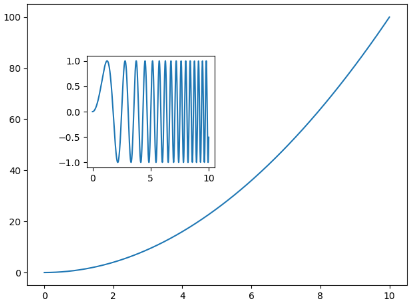
3. 在一个大图里面嵌套一个小图, 通过添加一个坐标系来完成 fig.add_axes([left, bottom, width, height])
x = np.linspace(0, 10, 1000)

y2 = np.sin(x**2)

y1 = x ** 2

fig, ax1 = plt.subplots()

left, bottom, width, height = [0.22, 0.45, 0.3, 0.35]

ax2 = fig.add_axes([left, bottom, width, height])

ax1.plot(x, y1)

ax2.plot(x, y2)

plt.show()
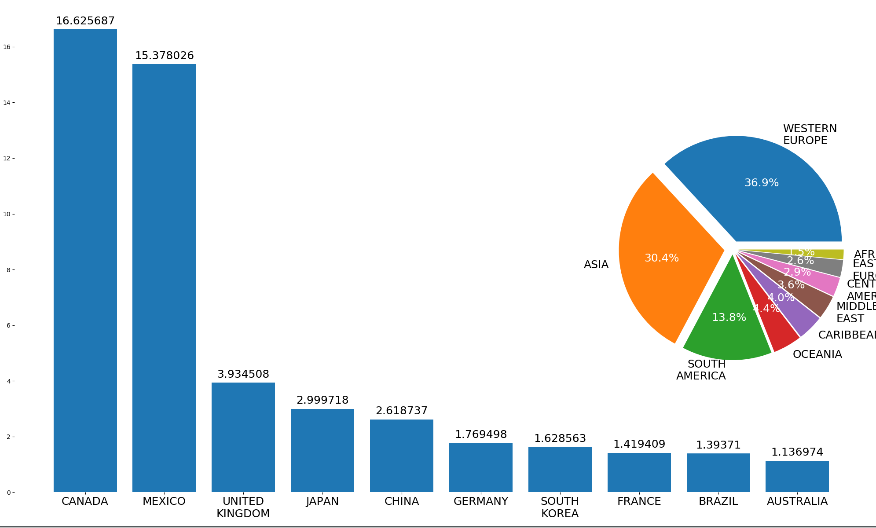
4. insert_axes在第一个图的基础上加入第二个图,这里也做了对条形图的高度加上了文本注释
from mpl_toolkits.axes_grid1.inset_locator import inset_axes

top10_arrivals_countries = ['CANADA','MEXICO','UNITED\nKINGDOM',\

                            'JAPAN','CHINA','GERMANY','SOUTH\nKOREA',\

                            'FRANCE','BRAZIL','AUSTRALIA']

top10_arrivals_values = [16.625687, 15.378026, 3.934508, 2.999718,\

                         2.618737, 1.769498, 1.628563, 1.419409,\

                         1.393710, 1.136974]

arrivals_countries = ['WESTERN\nEUROPE','ASIA','SOUTH\nAMERICA',\

                      'OCEANIA','CARIBBEAN','MIDDLE\nEAST',\

                      'CENTRAL\nAMERICA','EASTERN\nEUROPE','AFRICA']

arrivals_percent = [36.9,30.4,13.8,4.4,4.0,3.6,2.9,2.6,1.5]

# 在每一个条形图上进行文本的添加

def add_text(resc):

    for bar in resc:

        height = bar.get_height()

        # ax1.text 设置文本标签

        ax1.text(bar.get_x() + bar.get_width()/2 , height+0.1, '%s'%height, fontsize=18, ha='center', va='bottom')

# 条形图的绘制

fig, ax1 = plt.subplots(figsize=(20, 12))

vbar = ax1.bar(np.arange(len(top10_arrivals_values)), top10_arrivals_values)

plt.xticks(np.arange(len(top10_arrivals_values)), top10_arrivals_countries, fontsize=18)

# 在第一个坐标系的基础上构造第二个坐标系

ax2 = inset_axes(ax1, width=6, height=6, loc=5)

explode = (0.08, 0.08, 0.05, 0.05,0.05,0.05,0.05,0.05,0.05)

puaches, text, autotext = ax2.pie(arrivals_percent, explode=explode, labels=arrivals_countries, autopct='%1.1f%%')

for text in text + autotext:

    text.set_fontsize(18)

for text in autotext:

    text.set_color('white')

# 去除边框的操作

for spines in ax1.spines.values():

    spines.set_visible(False)

add_text(vbar)

plt.show()
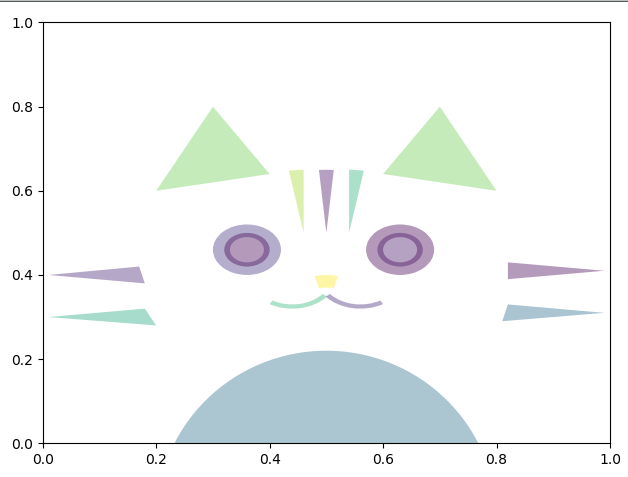
5. 通过一些三角形图案,画出一个猫的形状
import numpy as np

from matplotlib.patches import Circle, Wedge, Polygon, Ellipse

from matplotlib.collections import PatchCollection

import matplotlib.pyplot as plt

fig, ax = plt.subplots()

patches = []

# Full and ring sectors drawn by Wedge((x,y),r,deg1,deg2)

leftstripe = Wedge((.46, .5), .15, 90,100)           # Full sector by default

midstripe = Wedge((.5,.5), .15, 85,95)

rightstripe = Wedge((.54,.5), .15, 80,90)

lefteye = Wedge((.36, .46), .06, 0, 360, width=0.03)  # Ring sector drawn when width <1

righteye = Wedge((.63, .46), .06, 0, 360, width=0.03)

nose = Wedge((.5, .32), .08, 75,105, width=0.03)

mouthleft = Wedge((.44, .4), .08, 240,320, width=0.01)

mouthright = Wedge((.56, .4), .08, 220,300, width=0.01)

patches += [leftstripe,midstripe,rightstripe,lefteye,righteye,nose,mouthleft,mouthright]

# Circles

leftiris = Circle((.36,.46),0.04)

rightiris = Circle((.63,.46),0.04)

patches += [leftiris,rightiris]

# Polygons drawn by passing coordinates of vertices

leftear = Polygon([[.2,.6],[.3,.8],[.4,.64]], True)

rightear = Polygon([[.6,.64],[.7,.8],[.8,.6]], True)

topleftwhisker = Polygon([[.01,.4],[.18,.38],[.17,.42]], True)

bottomleftwhisker = Polygon([[.01,.3],[.18,.32],[.2,.28]], True)

toprightwhisker = Polygon([[.99,.41],[.82,.39],[.82,.43]], True)

bottomrightwhisker = Polygon([[.99,.31],[.82,.33],[.81,.29]], True)

patches+=[leftear,rightear,topleftwhisker,bottomleftwhisker,toprightwhisker,bottomrightwhisker]

body = Ellipse((0.5,-0.18),0.6,0.8)

patches.append(body)

# Draw the patches

colors = 100*np.random.rand(len(patches)) # set random colors

p = PatchCollection(patches, alpha=0.4)

p.set_array(np.array(colors))

ax.add_collection(p)

# Show the figure

plt.show()
可视化库-Matplotlib-饼图与布局(第四天)的更多相关文章
- Python可视化库-Matplotlib使用总结
在做完数据分析后,有时候需要将分析结果一目了然地展示出来,此时便离不开Python可视化工具,Matplotlib是Python中的一个2D绘图工具,是另外一个绘图工具seaborn的基础包 先总结下 ...
- Python数据可视化库-Matplotlib(一)
今天我们来学习一下python的数据可视化库,Matplotlib,是一个Python的2D绘图库 通过这个库,开发者可以仅需要几行代码,便可以生成绘图,直方图,功率图,条形图,错误图,散点图等等 废 ...
- python的数据可视化库 matplotlib 和 pyecharts
Matplotlib大家都很熟悉 不谈. ---------------------------------------------------------------------------- ...
- Python可视化库Matplotlib的使用
一.导入数据 import pandas as pd unrate = pd.read_csv('unrate.csv') unrate['DATE'] = pd.to_datetime(unrate ...
- 数据分析处理库pandas及可视化库Matplotlib
一.读取文件 1)读取文件内容 import pandas info = pandas.read_csv('1.csv',encoding='gbk') # 获取文件信息 print(info) pr ...
- Python数据可视化库-Matplotlib(二)
我们接着上次的继续讲解,先讲一个概念,叫子图的概念. 我们先看一下这段代码 import matplotlib.pyplot as plt fig = plt.figure() ax1 = fig.a ...
- python可视化库 Matplotlib 01 figure的详细用法
1.上一章绘制一幅最简单的图像,这一章介绍figure的详细用法,figure用于生成图像窗口的方法,并可以设置一些参数 2.先看此次生成的图像: 3.代码(代码中有详细的注释) # -*- enco ...
- python可视化库 Matplotlib 00 画制简单图像
1.下载方式:直接下载Andaconda,简单快捷,减少准备环境的时间 2.图像 3.代码:可直接运行(有详细注释) # -*- encoding:utf-8 -*- # Copyright (c) ...
- 机器学习-数据可视化神器matplotlib学习之路(四)
今天画一下3D图像,首先的另外引用一个包 from mpl_toolkits.mplot3d import Axes3D,接下来画一个球体,首先来看看球体的参数方程吧 (0≤θ≤2π,0≤φ≤π) 然 ...
随机推荐
- 将input type="file" 类型的图片文件转成base64
带有图片的form表单上传数据是很麻烦的,因为图片通常都是和文字分开上传,这是很麻烦的,所有吧图片转成base64就可以和当成文字上传了.话不多少,看代码: 首先定义一个类型为file的input标签 ...
- 2-14-1 MySQL基础语句,查询语句
一. SQL概述 结构化查询语言(Structured Query Language)简称SQL 1. 它是一种特殊目的的编程语言 2. 它还是一种数据库查询和程序设计语言 (用于存取数据以及查询.更 ...
- MyBatise代码自动生成时候Oralce的number类型BigDecimal问题
使用MyBatise的代码自动生成工具时候,即便在配置文件中定义了 <javaTypeResolver> <property name="forceBigDecimals& ...
- Codeforces Round #279 (Div. 2) 题解集合
终于有场正常时间的比赛了...毛子换冬令时还正是好啊233 做了ABCD,E WA了3次最后没搞定,F不会= = 那就来说说做的题目吧= = A. Team Olympiad 水题嘛= = 就是个贪心 ...
- Git创建仓库的方法(github翻译)
…通过命令行创建一个新的仓库 echo "# GitTest" >> README.md # 船舰一个说明文件,说明内容是 "# GitTest" ...
- vue.js-读取/发送数据
<!DOCTYPE html> <html> <head> <meta charset="UTF-8"> <title> ...
- PHP迭代器的小坑
使用PHP迭代器的时候,需要主要到很多迭代器是对内部迭代器的封装,当外部迭代器移动的时候,实际上也是在移动内部迭代器. 示例一:命令行 &"C:\wamp64\bin\php\php ...
- Qt 编译完后指定输出路径
make install INSTALL_ROOT=/home/hotot/qt4rls
- Mysql的日期转换成星期[某天对应周几]
|—— 应用中会有各种不同的需求,要灵活应对:比如拿到某一日期要知道是周几 |——DAYOFWEEK(date) [返回日期date的星期索引(1=星期天,2=星期一, ……7=星期六).这些索引值对 ...
- 解决 The word is not correctly spelled问题
The word is not correctly spelled 此问题是eclipse校验单词拼写造成,如果出在配置文件中,一般会影响到程序的正常执行 解决方法:Window--Preferenc ...