
跟我学SpringCloud | 第五篇:熔断监控Hystrix Dashboard和Turbine
SpringCloud系列教程 | 第五篇:熔断监控Hystrix Dashboard和Turbine
Springboot: 2.1.6.RELEASE
SpringCloud: Greenwich.SR1
如无特殊说明,本系列教程全采用以上版本
Hystrix-dashboard是一款针对Hystrix进行实时监控的工具,通过Hystrix Dashboard我们可以在直观地看到各Hystrix Command的请求响应时间, 请求成功率等数据。但是只使用Hystrix Dashboard的话, 你只能看到单个应用内的服务信息, 这明显不够。我们需要一个工具能让我们汇总系统内多个服务的数据并显示到Hystrix Dashboard上, 这个工具就是Turbine。
1. Hystrix Dashboard
创建一个新的项目hystrix-dashboard,延用上一篇文章提到的eureka和producer两个项目。
1. hystrix-dashboard pom.xml 依赖包管理
<?xml version="1.0" encoding="UTF-8"?>

<project xmlns="http://maven.apache.org/POM/4.0.0" xmlns:xsi="http://www.w3.org/2001/XMLSchema-instance"

	xsi:schemaLocation="http://maven.apache.org/POM/4.0.0 http://maven.apache.org/xsd/maven-4.0.0.xsd">

	<modelVersion>4.0.0</modelVersion>

	<parent>

		<groupId>org.springframework.boot</groupId>

		<artifactId>spring-boot-starter-parent</artifactId>

		<version>2.1.6.RELEASE</version>

		<relativePath/> <!-- lookup parent from repository -->

	</parent>

	<groupId>com.springcloud</groupId>

	<artifactId>hystrix-dashboard</artifactId>

	<version>0.0.1-SNAPSHOT</version>

	<name>hystrix-dashboard</name>

	<description>Demo project for Spring Boot</description>

	<properties>

		<java.version>1.8</java.version>

		<spring-cloud.version>Greenwich.SR1</spring-cloud.version>

	</properties>

	<dependencies>

		<dependency>

			<groupId>org.springframework.boot</groupId>

			<artifactId>spring-boot-starter-actuator</artifactId>

		</dependency>

		<dependency>

			<groupId>org.springframework.boot</groupId>

			<artifactId>spring-boot-starter-web</artifactId>

		</dependency>

		<dependency>

			<groupId>org.springframework.cloud</groupId>

			<artifactId>spring-cloud-starter-netflix-eureka-client</artifactId>

		</dependency>

		<dependency>

			<groupId>org.springframework.cloud</groupId>

			<artifactId>spring-cloud-starter-netflix-hystrix</artifactId>

		</dependency>

		<dependency>

			<groupId>org.springframework.cloud</groupId>

			<artifactId>spring-cloud-starter-netflix-hystrix-dashboard</artifactId>

		</dependency>

		<dependency>

			<groupId>org.springframework.cloud</groupId>

			<artifactId>spring-cloud-starter-openfeign</artifactId>

		</dependency>

		<dependency>

			<groupId>org.springframework.boot</groupId>

			<artifactId>spring-boot-starter-test</artifactId>

			<scope>test</scope>

		</dependency>

	</dependencies>

	<dependencyManagement>

		<dependencies>

			<dependency>

				<groupId>org.springframework.cloud</groupId>

				<artifactId>spring-cloud-dependencies</artifactId>

				<version>${spring-cloud.version}</version>

				<type>pom</type>

				<scope>import</scope>

			</dependency>

		</dependencies>

	</dependencyManagement>

	<build>

		<plugins>

			<plugin>

				<groupId>org.springframework.boot</groupId>

				<artifactId>spring-boot-maven-plugin</artifactId>

			</plugin>

		</plugins>

	</build>

</project>
前面介绍过的包我这里不再多说,讲几个前面没有见过的包:
- actuator: 这个包是用来做服务监控的,很多监控相关的功能都会用到这个包,具体的内容我这里先不讲,后面会专门有一篇来讲这个。
- hystrix-dashboard: 这个是今天的主角,hystrix-dashboard帮我们封装好了hystrix的监控面板。
2. 启动类 HystrixDashboardApplication.java
package com.springcloud.hystrixdashboard;

import com.netflix.hystrix.contrib.metrics.eventstream.HystrixMetricsStreamServlet;

import org.springframework.boot.SpringApplication;

import org.springframework.boot.autoconfigure.SpringBootApplication;

import org.springframework.boot.web.servlet.ServletRegistrationBean;

import org.springframework.cloud.client.circuitbreaker.EnableCircuitBreaker;

import org.springframework.cloud.netflix.eureka.EnableEurekaClient;

import org.springframework.cloud.netflix.hystrix.dashboard.EnableHystrixDashboard;

import org.springframework.cloud.openfeign.EnableFeignClients;

import org.springframework.context.annotation.Bean;

@SpringBootApplication

@EnableEurekaClient

@EnableFeignClients

@EnableHystrixDashboard

@EnableCircuitBreaker

public class HystrixDashboardApplication {

	public static void main(String[] args) {

		SpringApplication.run(HystrixDashboardApplication.class, args);

	}

	@Bean

	public ServletRegistrationBean getServlet(){

		HystrixMetricsStreamServlet streamServlet = new HystrixMetricsStreamServlet();

		ServletRegistrationBean registrationBean = new ServletRegistrationBean(streamServlet);

		registrationBean.setLoadOnStartup(1);

		registrationBean.addUrlMappings("/hystrix.stream");

		registrationBean.setName("HystrixMetricsStreamServlet");

		return registrationBean;

	}

}
启动类添加启用Hystrix Dashboard和熔断器
注意: 各位看官这里一定要注意,我在这里注册了HystrixMetricsStreamServlet,在springboot1.x版本下,这里是无需注册的,在2.x版本后,这里才需要注册HystrixMetricsStreamServlet,并且显示的给出访问路径。
3. 配置文件
server:

  port: 8081

spring:

  application:

    name: spring-cloud-hystrix-dashboard

eureka:

  client:

    service-url:

      defaultZone: http://localhost:8761/eureka/

feign:

  hystrix:

    enabled: true
4. 测试
又到了测试时间,我们先把昨天的eureka和producer CV到今天的工作目录下,顺次启动服务,HystrixDashboard最后启动,启动完成后我们访问:http://localhost:8081/hystrix,将会看到如下界面:
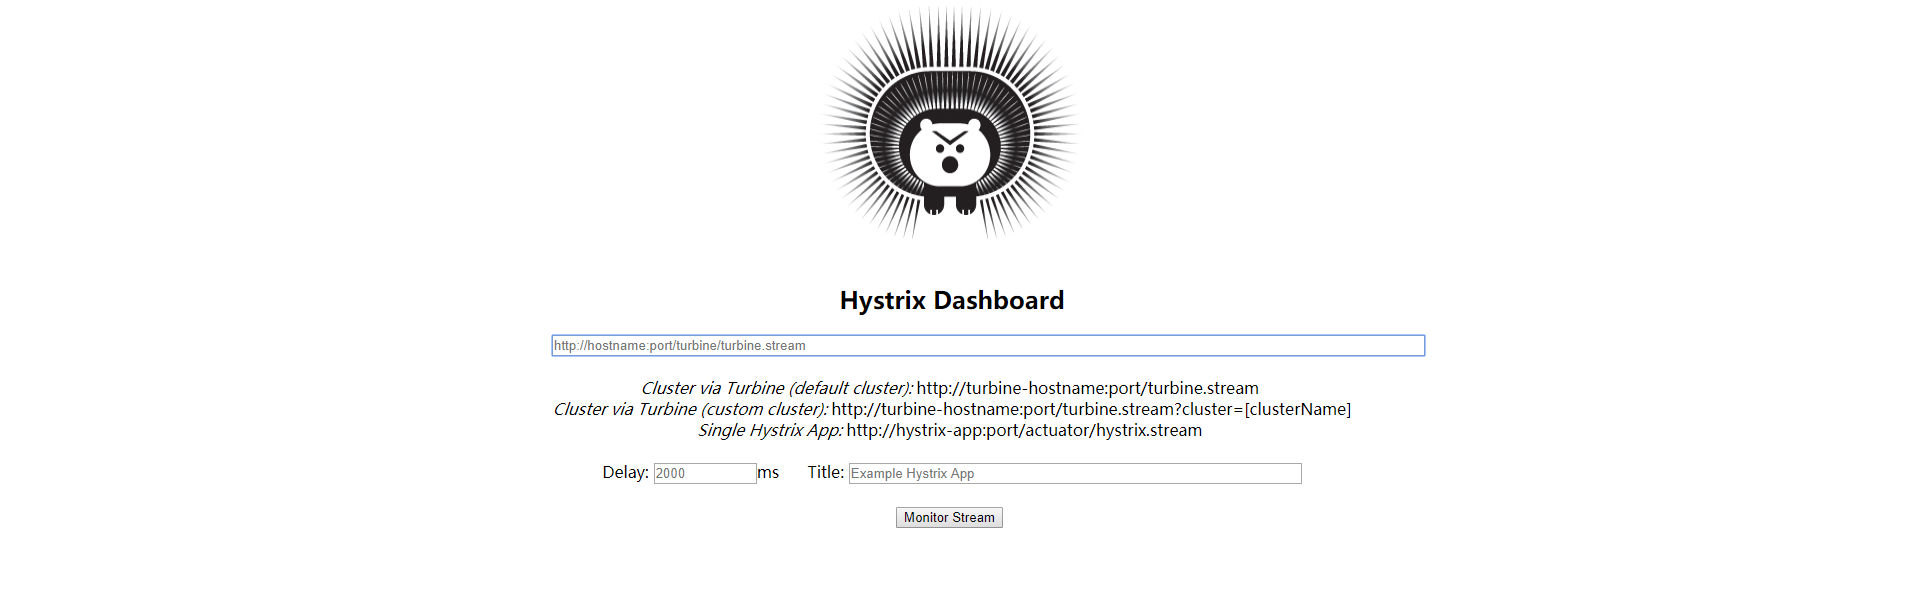
图中会有一些提示:
Cluster via Turbine (default cluster): http://turbine-hostname:port/turbine.stream
Cluster via Turbine (custom cluster): http://turbine-hostname:port/turbine.stream?cluster=[clusterName]
Single Hystrix App: http://hystrix-app:port/hystrix.stream
大致大概意思就是如果查看默认集群使用第一个url,查看指定集群使用第二个url,单个应用的监控使用最后一个,我们暂时只演示单个应用的所以在输入框中输入: http://localhost:8081/hystrix.stream ,输入之后点击 monitor,进入页面。
如果没有请求会先显示Loading ...,访问http://localhost:8081/hystrix.stream 也会不断的显示ping。
我们请求一下昨天用过的链接:http://localhost:8081/hello/spring。
马上就能看到统计信息了。
可以再访问一下http://localhost:8081/hystrix.stream,显示如下:
ping:

data: {"type":...}

data: {"type":...}
说明已经返回了监控的各项结果.
到了监控页面就会显示如下图所示:
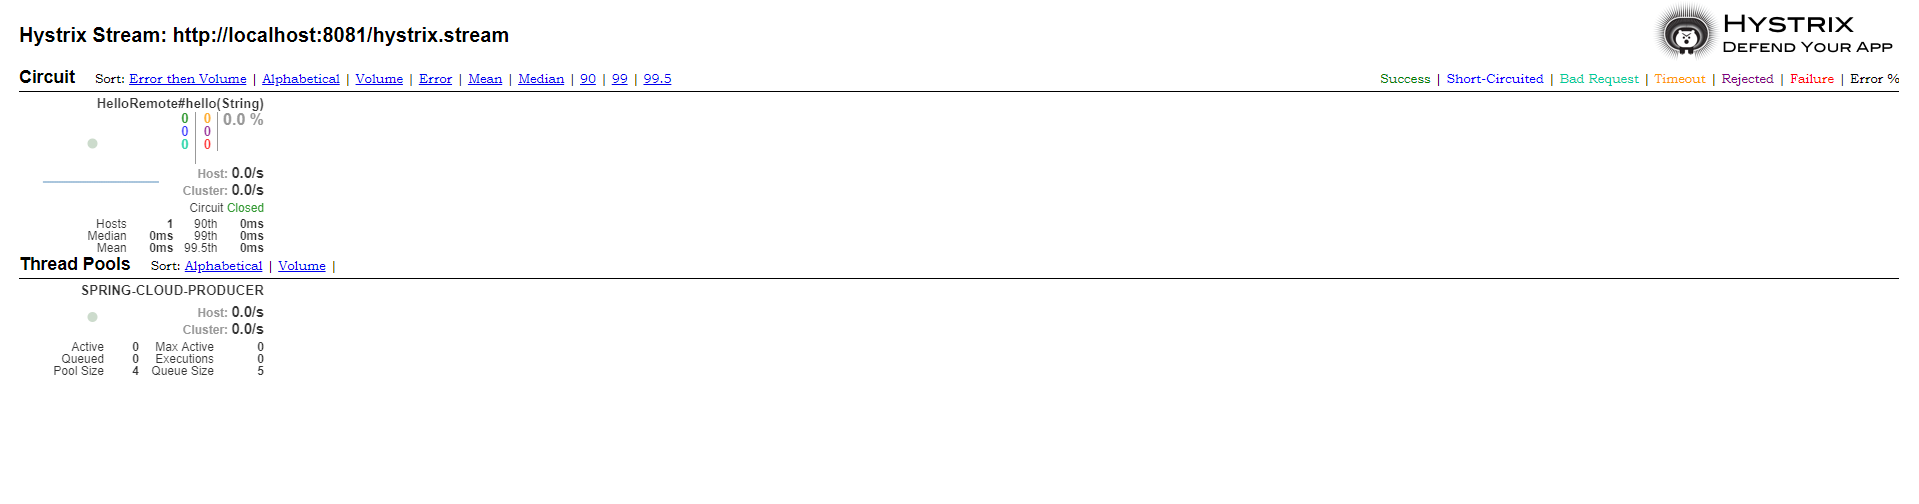
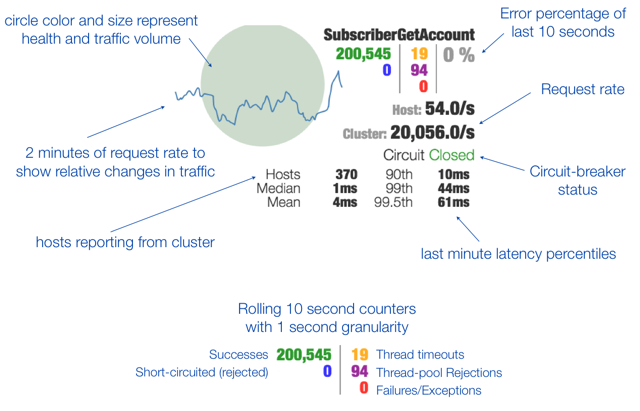
其实就是http://localhost:8081/hystrix.stream返回结果的图形化显示,Hystrix Dashboard Wiki上详细说明了图上每个指标的含义,如下图:
到此单个应用的熔断监控已经完成。
2. Turbine
在复杂的分布式系统中,相同服务的节点经常需要部署上百甚至上千个,很多时候,运维人员希望能够把相同服务的节点状态以一个整体集群的形式展现出来,这样可以更好的把握整个系统的状态。 为此,Netflix提供了一个开源项目(Turbine)来提供把多个hystrix.stream的内容聚合为一个数据源供Dashboard展示。
1. Turbine pom.xml
<?xml version="1.0" encoding="UTF-8"?>

<project xmlns="http://maven.apache.org/POM/4.0.0" xmlns:xsi="http://www.w3.org/2001/XMLSchema-instance"

	xsi:schemaLocation="http://maven.apache.org/POM/4.0.0 http://maven.apache.org/xsd/maven-4.0.0.xsd">

	<modelVersion>4.0.0</modelVersion>

	<parent>

		<groupId>org.springframework.boot</groupId>

		<artifactId>spring-boot-starter-parent</artifactId>

		<version>2.1.6.RELEASE</version>

		<relativePath/> <!-- lookup parent from repository -->

	</parent>

	<groupId>com.springcloud</groupId>

	<artifactId>turbine</artifactId>

	<version>0.0.1-SNAPSHOT</version>

	<name>turbine</name>

	<description>Demo project for Spring Boot</description>

	<properties>

		<java.version>1.8</java.version>

		<spring-cloud.version>Greenwich.SR1</spring-cloud.version>

	</properties>

	<dependencies>

		<dependency>

			<groupId>org.springframework.boot</groupId>

			<artifactId>spring-boot-starter-actuator</artifactId>

		</dependency>

		<dependency>

			<groupId>org.springframework.cloud</groupId>

			<artifactId>spring-cloud-starter-netflix-hystrix-dashboard</artifactId>

		</dependency>

		<dependency>

			<groupId>org.springframework.cloud</groupId>

			<artifactId>spring-cloud-starter-netflix-turbine</artifactId>

		</dependency>

		<dependency>

			<groupId>org.springframework.boot</groupId>

			<artifactId>spring-boot-starter-test</artifactId>

			<scope>test</scope>

		</dependency>

	</dependencies>

	<dependencyManagement>

		<dependencies>

			<dependency>

				<groupId>org.springframework.cloud</groupId>

				<artifactId>spring-cloud-dependencies</artifactId>

				<version>${spring-cloud.version}</version>

				<type>pom</type>

				<scope>import</scope>

			</dependency>

		</dependencies>

	</dependencyManagement>

	<build>

		<plugins>

			<plugin>

				<groupId>org.springframework.boot</groupId>

				<artifactId>spring-boot-maven-plugin</artifactId>

			</plugin>

		</plugins>

	</build>

</project>
2. 配置文件
server:

  port: 8888

spring:

  application:

    name: hystrix-dashboard-turbine

turbine:

  app-config: node01,node02

  aggregator:

    cluster-config: default

  cluster-name-expression: new String("default")

  combine-host-port: true

eureka:

  client:

    service-url:

      defaultZone: http://localhost:8761/eureka/
- turbine.appConfig: 配置Eureka中的serviceId列表,表明监控哪些服务
- turbine.aggregator.clusterConfig: 指定聚合哪些集群,多个使用”,”分割,默认为default。可使用http://.../turbine.stream?cluster={clusterConfig之一}访问
- turbine.clusterNameExpression: 1. clusterNameExpression指定集群名称,默认表达式appName;此时:turbine.aggregator.clusterConfig需要配置想要监控的应用名称;2. 当clusterNameExpression: default时,turbine.aggregator.clusterConfig可以不写,因为默认就是default;3. 当clusterNameExpression: metadata[‘cluster’]时,假设想要监控的应用配置了eureka.instance.metadata-map.cluster: ABC,则需要配置,同时turbine.aggregator.clusterConfig: ABC
3. 启动类
启动类添加@EnableTurbine,激活对Turbine的支持
package com.springcloud.turbine;

import org.springframework.boot.SpringApplication;

import org.springframework.boot.autoconfigure.SpringBootApplication;

import org.springframework.cloud.netflix.hystrix.dashboard.EnableHystrixDashboard;

import org.springframework.cloud.netflix.turbine.EnableTurbine;

@SpringBootApplication

@EnableHystrixDashboard

@EnableTurbine

public class TurbineApplication {

	public static void main(String[] args) {

		SpringApplication.run(TurbineApplication.class, args);

	}

}
4. 创建消费者集群
将昨天的消费者copy2份到今天的文件路径下,修改名称为consumers-node01,consumers-node02
增加依赖包
<dependency>

	<groupId>org.springframework.cloud</groupId>

	<artifactId>spring-cloud-starter-netflix-hystrix-dashboard</artifactId>

</dependency>
启动类增加HystrixMetricsStreamServlet注册
package com.springcloud.consumers;

import com.netflix.hystrix.contrib.metrics.eventstream.HystrixMetricsStreamServlet;

import org.springframework.boot.SpringApplication;

import org.springframework.boot.autoconfigure.SpringBootApplication;

import org.springframework.boot.web.servlet.ServletRegistrationBean;

import org.springframework.cloud.netflix.eureka.EnableEurekaClient;

import org.springframework.cloud.openfeign.EnableFeignClients;

import org.springframework.context.annotation.Bean;

@SpringBootApplication

@EnableEurekaClient

@EnableFeignClients

public class ConsumersApplication {

	public static void main(String[] args) {

		SpringApplication.run(ConsumersApplication.class, args);

	}

	@Bean

	public ServletRegistrationBean getServlet(){

		HystrixMetricsStreamServlet streamServlet = new HystrixMetricsStreamServlet();

		ServletRegistrationBean registrationBean = new ServletRegistrationBean(streamServlet);

		registrationBean.setLoadOnStartup(1);

		registrationBean.addUrlMappings("/actuator/hystrix.stream");

		registrationBean.setName("HystrixMetricsStreamServlet");

		return registrationBean;

	}

}
注意: 这里注册的HystrixMetricsStreamServlet访问路径是"/actuator/hystrix.stream",这是因为Turbine默认访问的是这个路径。
两个配置文件大家自行修改启动端口号,spring.application.name分别修改为node01和node02
5. 测试
现在依次启动注册中心,两个消费者和Turbine,顺次访问两个消费者,并访问 http://localhost:8888/turbine.stream, 会返回和上面一样的一穿ping的信息。
并且会不断刷新以获取实时的监控数据,说明和单个的监控类似,返回监控项目的信息。
进行图形化监控查看,输入:http://localhost:8888/hystrix,返回酷酷的小熊界面,输入: http://localhost:8888/turbine.stream,然后点击 Monitor Stream ,可以看到出现了俩个监控列表(这是理论情况)
注意,这里本地环境无法测试成功,本地环境只能显示一个服务,Turbine日志中会报错
你的主机中的软件中止了一个已建立的连接。
原因目前不明,已经在github上提Issues。
跟我学SpringCloud | 第五篇:熔断监控Hystrix Dashboard和Turbine的更多相关文章
- springcloud(五):熔断监控Hystrix Dashboard和Turbine
Hystrix-dashboard是一款针对Hystrix进行实时监控的工具,通过Hystrix Dashboard我们可以在直观地看到各Hystrix Command的请求响应时间, 请求成功率等数 ...
- Spring Cloud(五):熔断监控Hystrix Dashboard和Turbine
Hystrix-dashboard是一款针对Hystrix进行实时监控的工具,通过Hystrix Dashboard我们可以在直观地看到各Hystrix Command的请求响应时间, 请求成功率等数 ...
- spring cloud(五)熔断监控Hystrix Dashboard和Turbine
Hystrix-dashboard是一款针对Hystrix进行实时监控的工具,通过Hystrix Dashboard我们可以在直观地看到各Hystrix Command的请求响应时间, 请求成功率等数 ...
- 微服务SpringCloud之熔断监控Hystrix Dashboard和Turbine
Hystrix-dashboard是一款针对Hystrix进行实时监控的工具,通过Hystrix Dashboard我们可以在直观地看到各Hystrix Command的请求响应时间, 请求成功率等数 ...
- spring cloud熔断监控Hystrix Dashboard和Turbine
参考: http://blog.csdn.net/ityouknow/article/details/72625646 完整pom <?xml version="1.0" e ...
- spring cloud深入学习(六)-----熔断监控Hystrix Dashboard和Turbine
Hystrix-dashboard是一款针对Hystrix进行实时监控的工具,通过Hystrix Dashboard我们可以在直观地看到各Hystrix Command的请求响应时间, 请求成功率等数 ...
- spring-cloud:熔断监控Hystrix Dashboard和Turbine的示例
1.运行环境 开发工具:intellij idea JDK版本:1.8 项目管理工具:Maven 4.0.0 2.GITHUB地址 https://github.com/nbfujx/springCl ...
- 跟我学SpringCloud | 第四篇:熔断器Hystrix
跟我学SpringCloud | 第四篇:熔断器Hystrix 1. 熔断器 服务雪崩 在正常的微服务架构体系下,一个业务很少有只需要调用一个服务就可以返回数据的情况,这种比较常见的是出现在demo中 ...
- Spring Cloud(五)断路器监控(Hystrix Dashboard)
在上两篇文章中讲了,服务提供者 Eureka + 服务消费者 Feign,服务提供者 Eureka + 服务消费者(rest + Ribbon),本篇文章结合,上两篇文章中代码进行修改加入 断路器监控 ...
随机推荐
- EBS OAF 发展 URL商标、加密和编码
EBS OAF 发展 URL商标.加密和编码 (版权声明.我原来的或翻译的文章,如需转载,转载的个人学习,转载请注明出处:否则,请与我联系.版权所有) 马克 当您指定页面定义声明URL参数,文本也能够 ...
- python 教程 第十三章、 特殊的方法
第十三章. 特殊的方法 1) 特殊的方法 __init__(self,...) 这个方法在新建对象恰好要被返回使用之前被调用. __del__(self) 恰好在对象要被删除之前调用. __st ...
- Windows下一个curl使用
一.简介 在上一篇中我们涉及到了一个在Ubuntu下使用的curl命令,而且使用这个命令来模拟server的功能来向谷歌的C2DMserver发送数据. 以下简单的来说下在Windows下相同的使用c ...
- 让你的sublime text写C代码 (sublime text 2 配置构建C开发环境)
原则 1. 首先你要配置能够编译C++/C环境 2. window中配置该执行环境的环境变量,能够全局使用 3. sublime Text创建新的构建机制.并设置用改全局编译环境 具体过程 能够编译C ...
- Qt SQLite 批量插入优化(SQLite默认将每条语句看成单独的事务)good
使用SQLite存储数据时发现插入速度太慢,程序跑了将近五分钟才插入了不到三千条.上网查资料才发现,SQLite这种文件数据库与MySql机制不一样,每条事务都有打开和关闭文件的步骤,SQLite默认 ...
- WPF控件深拷贝:序列化/反序列化
原文:WPF控件深拷贝:序列化/反序列化 今天DebugLZQ在做WPF拖动总结的时候,遇到了这个问题.baidu了下,貌似没有解决这个问题的权威答案,遂写下这篇博文. 我想做的事情是:拖动一个窗体内 ...
- Java FTP 基本操作
最近工作中用到了 FTP 相关的操作,所以借此机会了解了下具体内容. FTP基础 关于 FTP 基础推荐阅读<使用 Socket 通信实现 FTP 客户端程序>,其中需要特别注意的是主动模 ...
- Win8 Metro(C#)数字图像处理--2.48Canny边缘检测算法
原文:Win8 Metro(C#)数字图像处理--2.48Canny边缘检测算法 [算法说明] Canny边缘检测算法可以分为4步:高斯滤波器平滑处理.梯度计算.非极大值抑制.双阈值边缘检 测和 ...
- c#代码安装字体文件
public class FontOperate { [DllImport("kernel32.dll", SetLastError = true)] static extern ...
- android x86 7.0 32bit调试apk时出现的错误
detected problems with app native libraries libavcodec.so:text relocationslibavutil.solibswresample. ...