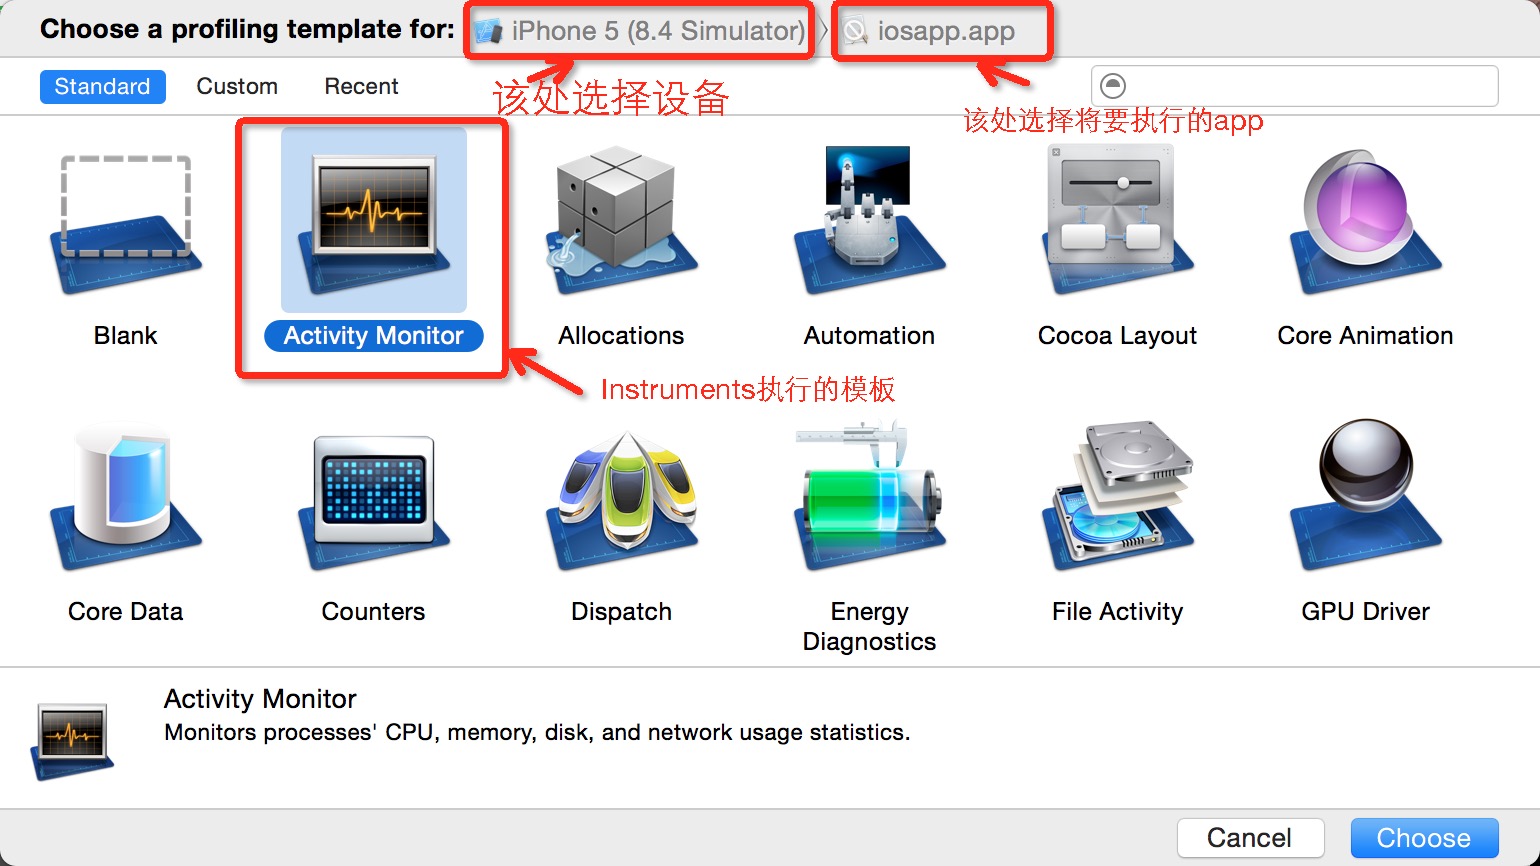
Instruments_Activity Monitor使用入门
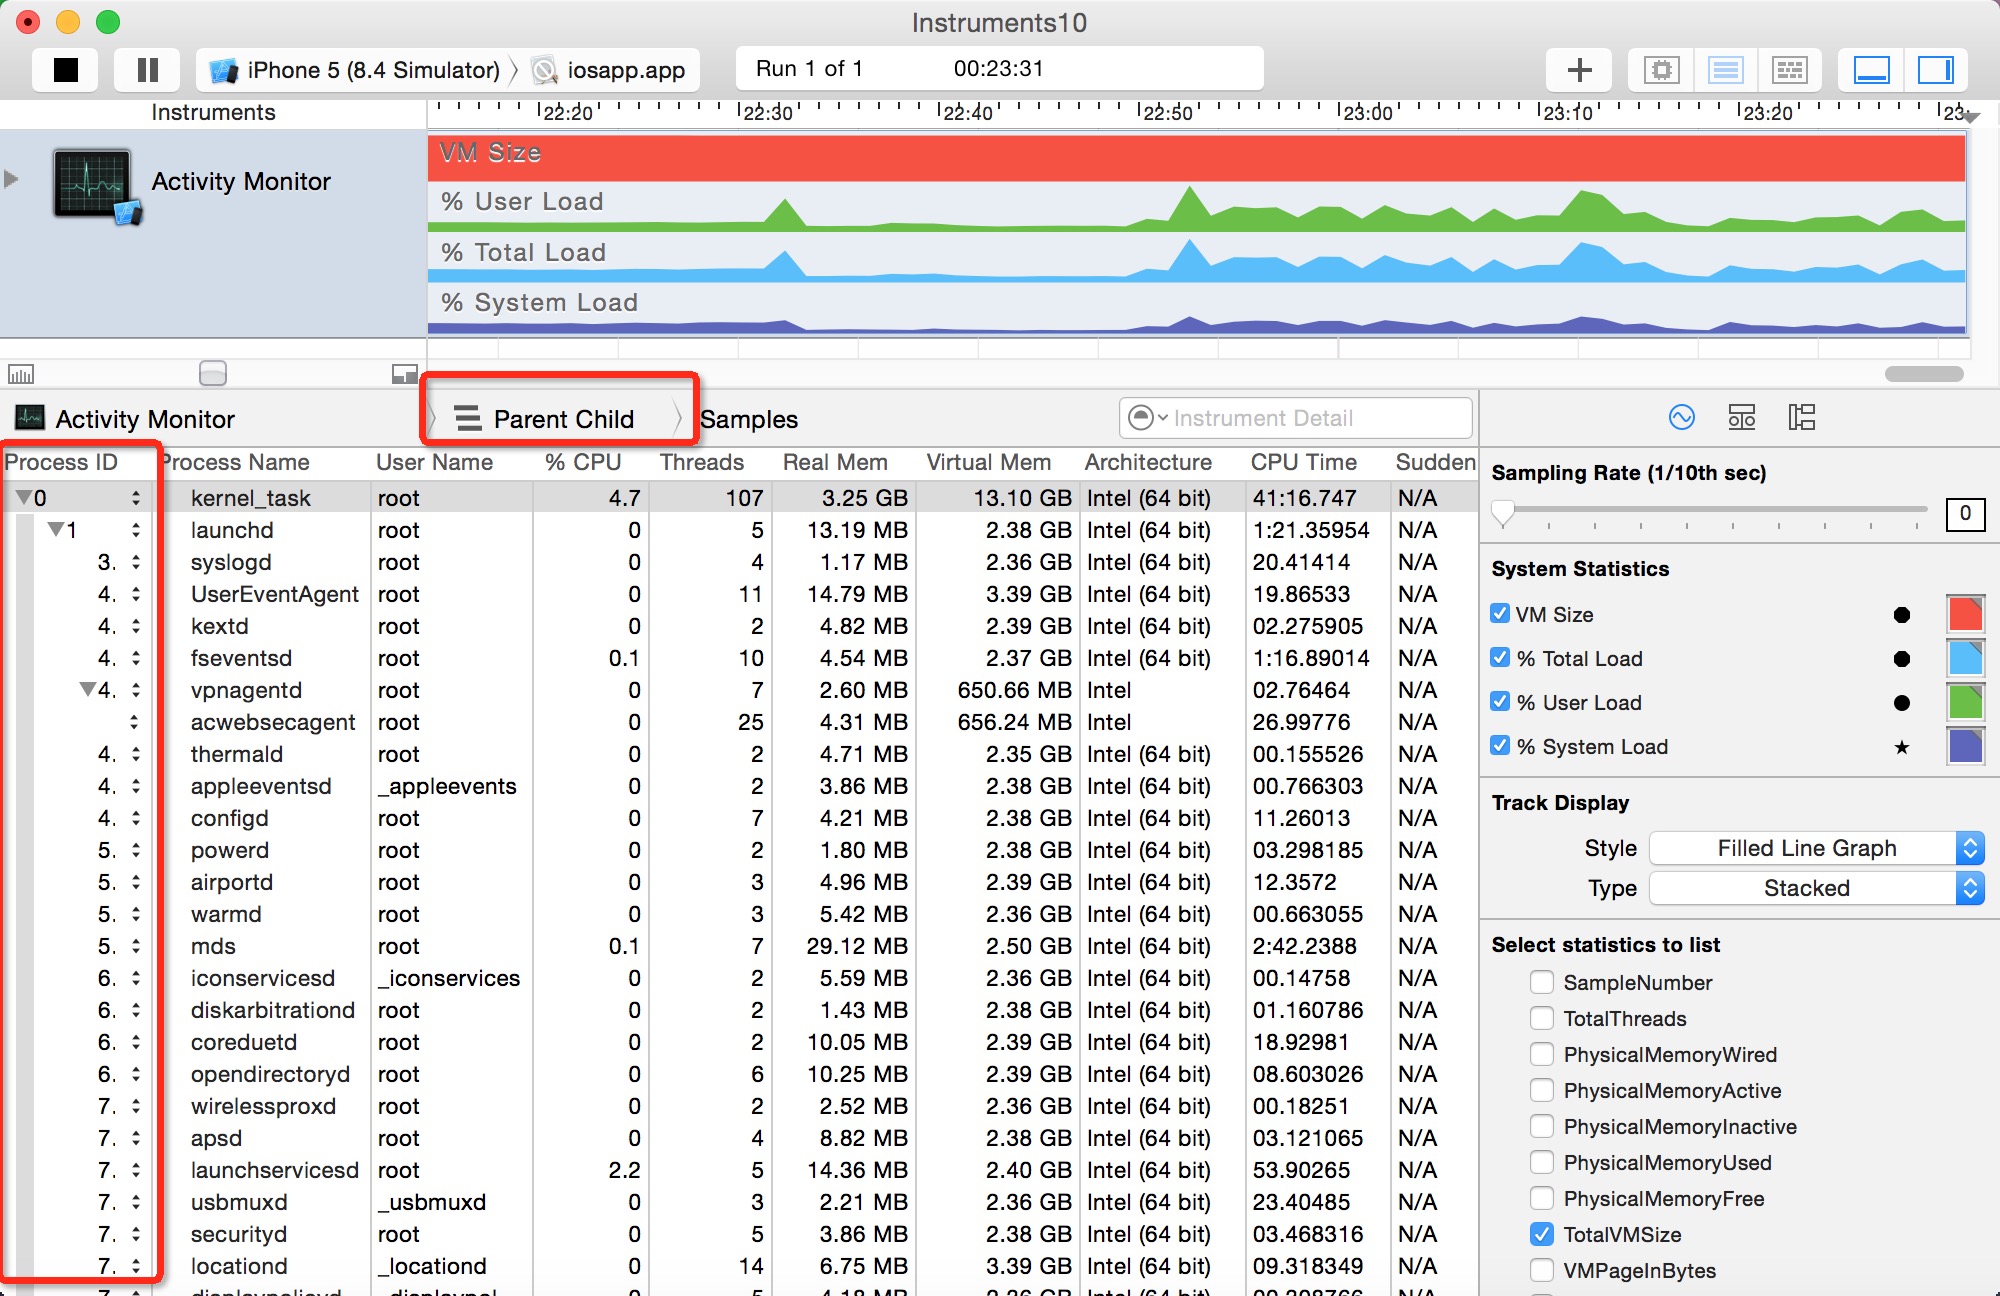
parent child information)-----父进程和子进程的关系,以及各个进程的概要信息

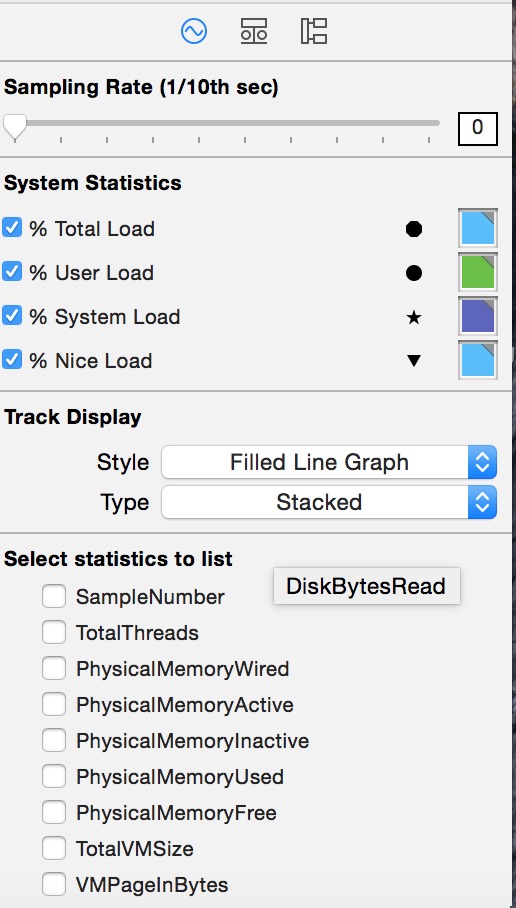
- Physical Memory Wired——操作系统占用的内存
- Physical Memory Active——除操作系统外其它进程占用的内存
- Physical Memory Inactive——最近被释放的内存
- Physical Memory Used——profiling当前进程时使用的总内存
- Physical Memory Free——当前的可用内存
- Total VM Size——虚拟内存的占用量
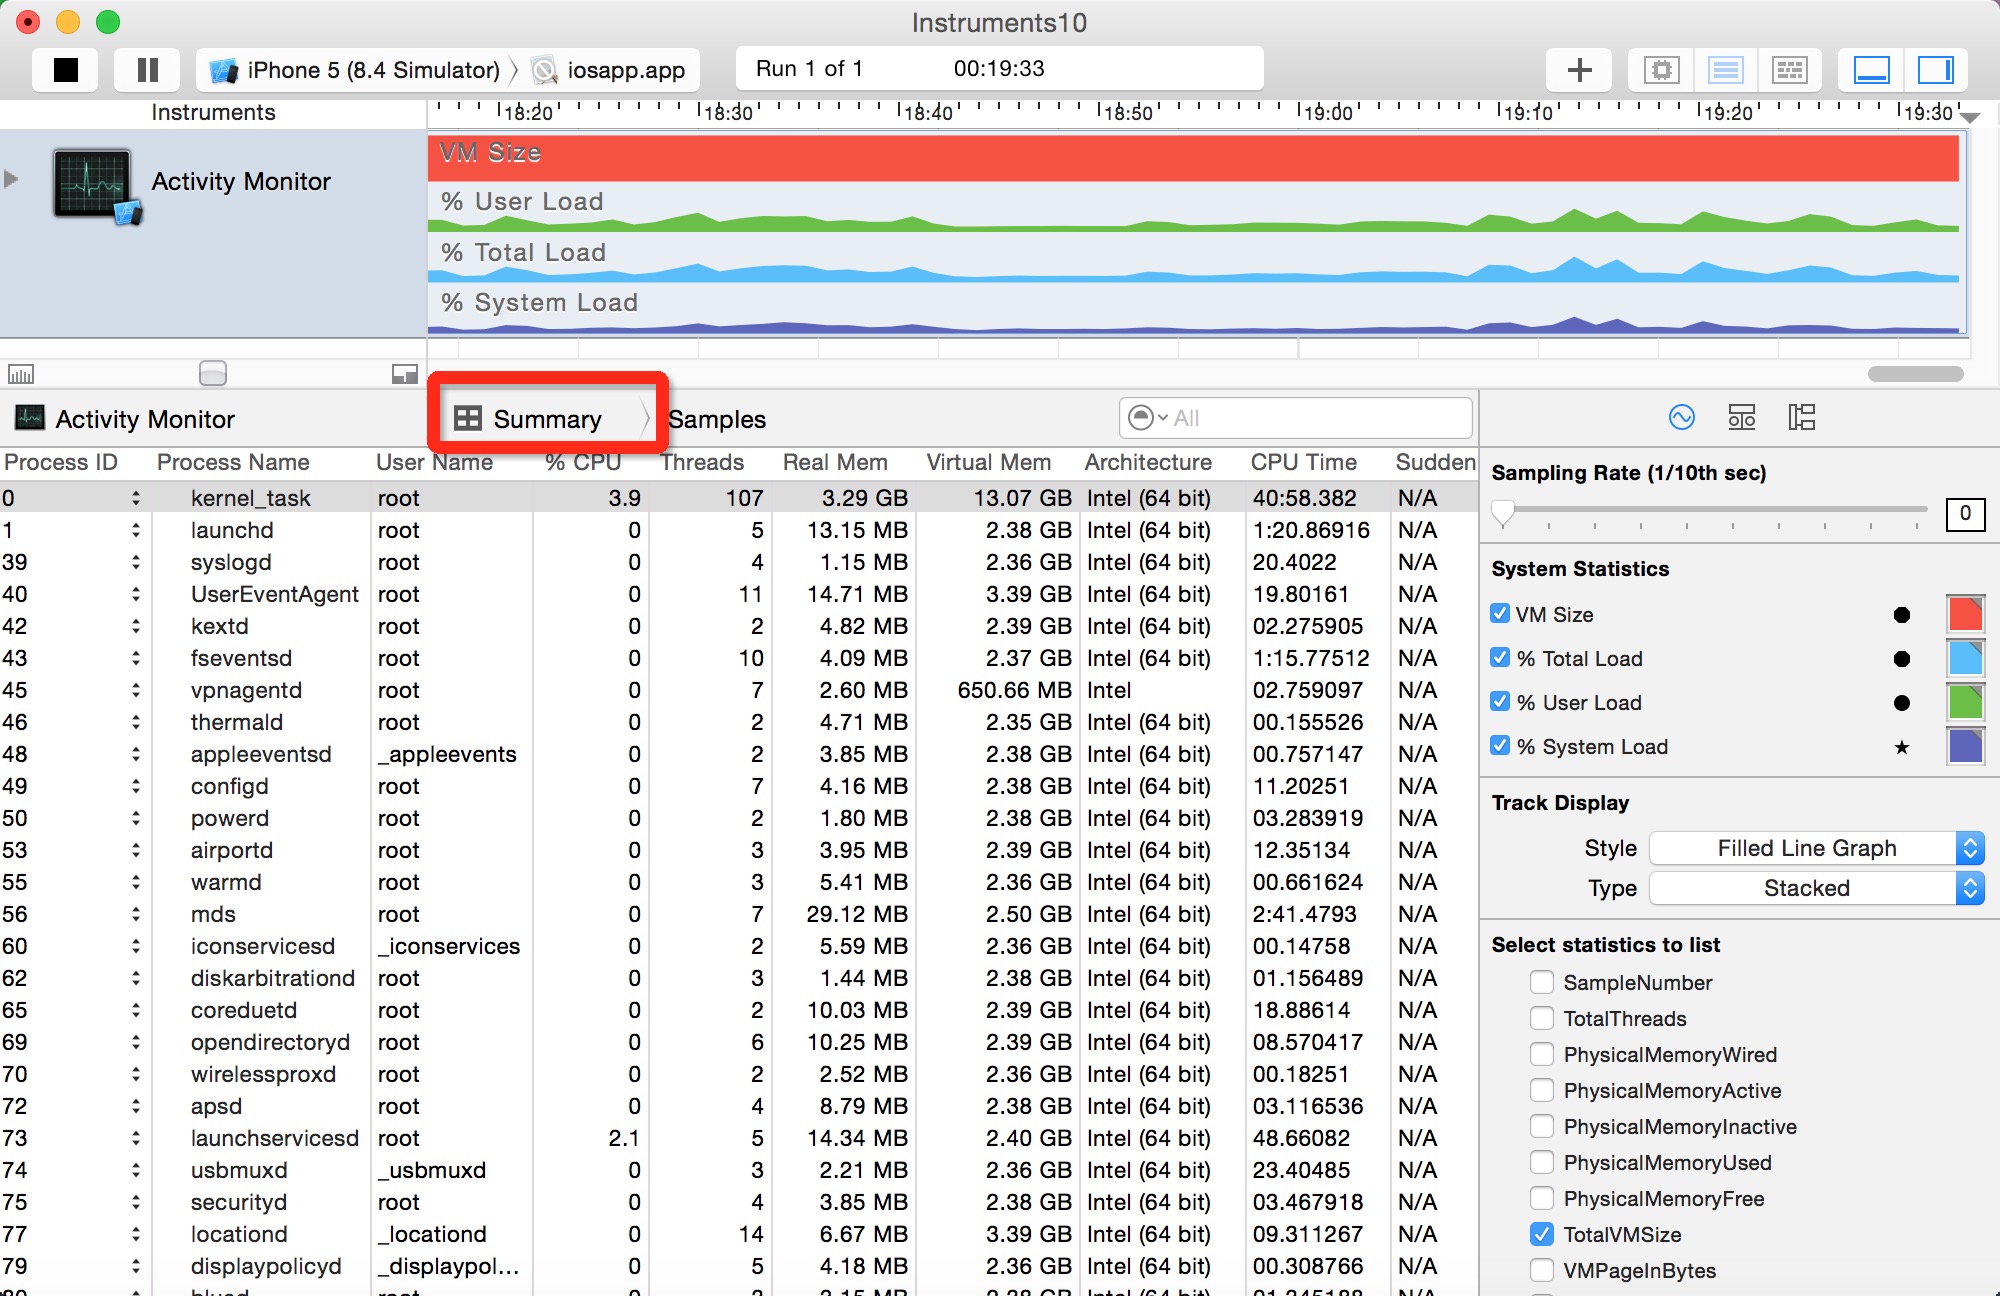
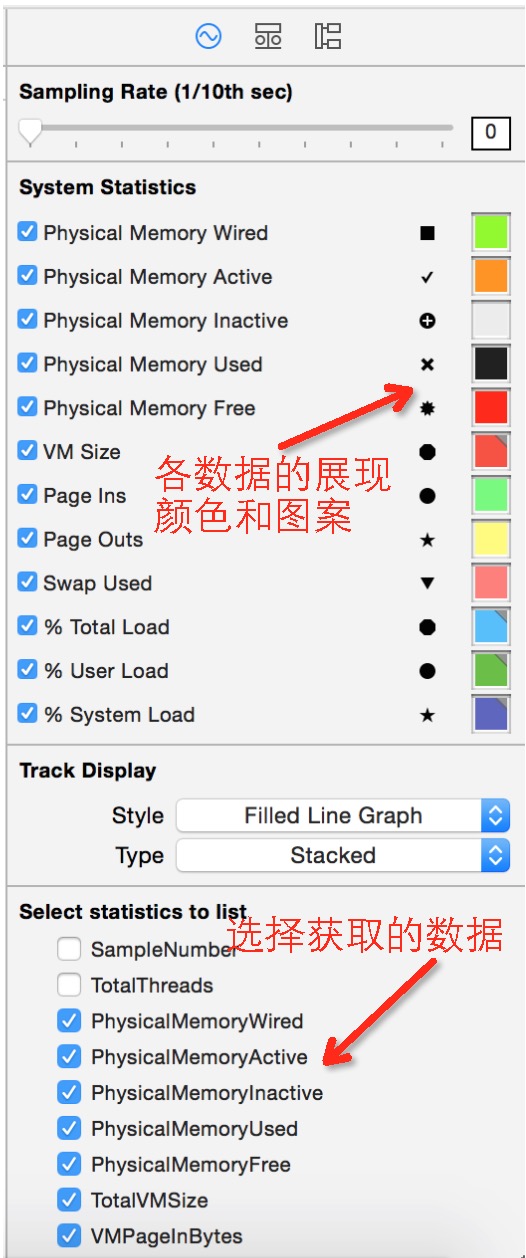
TotalVMSize、CPUTotalLoad、CPUUserLoad、CPUSystemLoad,在使用时可以根据自己的需要选择相关的分析内容进行显示,并且不同的内存使用部分可以使用不同的颜色加以区分,下面就是Activity Monitor在使用过程中的界面截图,在右下角可选择内存相关的分析内容。
Examining Memory Usage with the Activity Monitor Trace Template
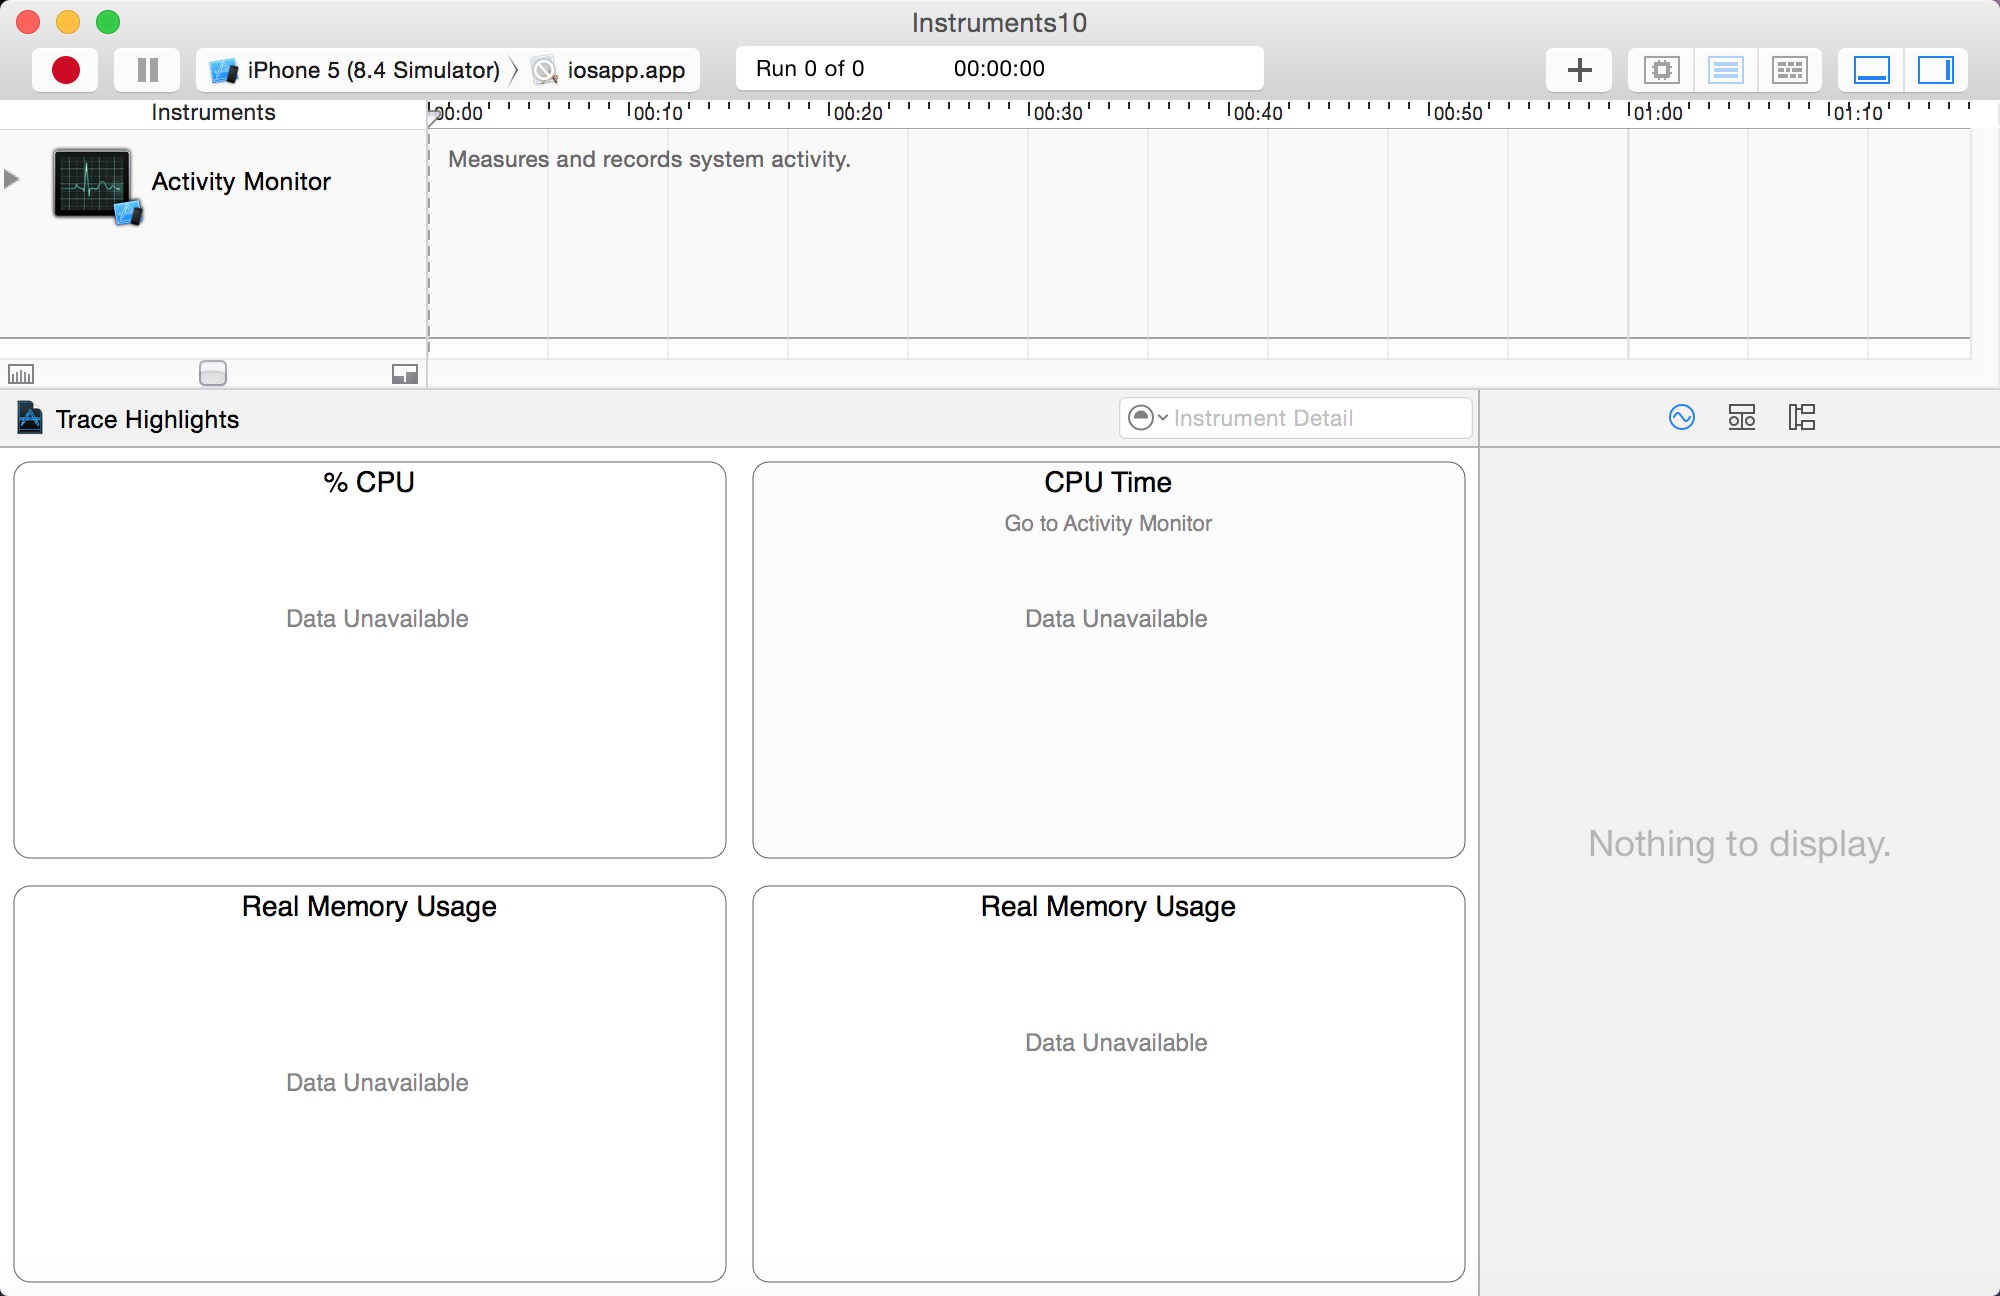
The Activity Monitor trace template monitors overall system activity and statistics, including CPU, memory, disk, and network. It consists of the Activity Monitor instrument only, although you can add additional instruments to a trace document you’ve created with the template, if you desire. You’ll see later that the Activity Monitor is also used to monitor network activity on iOS devices.
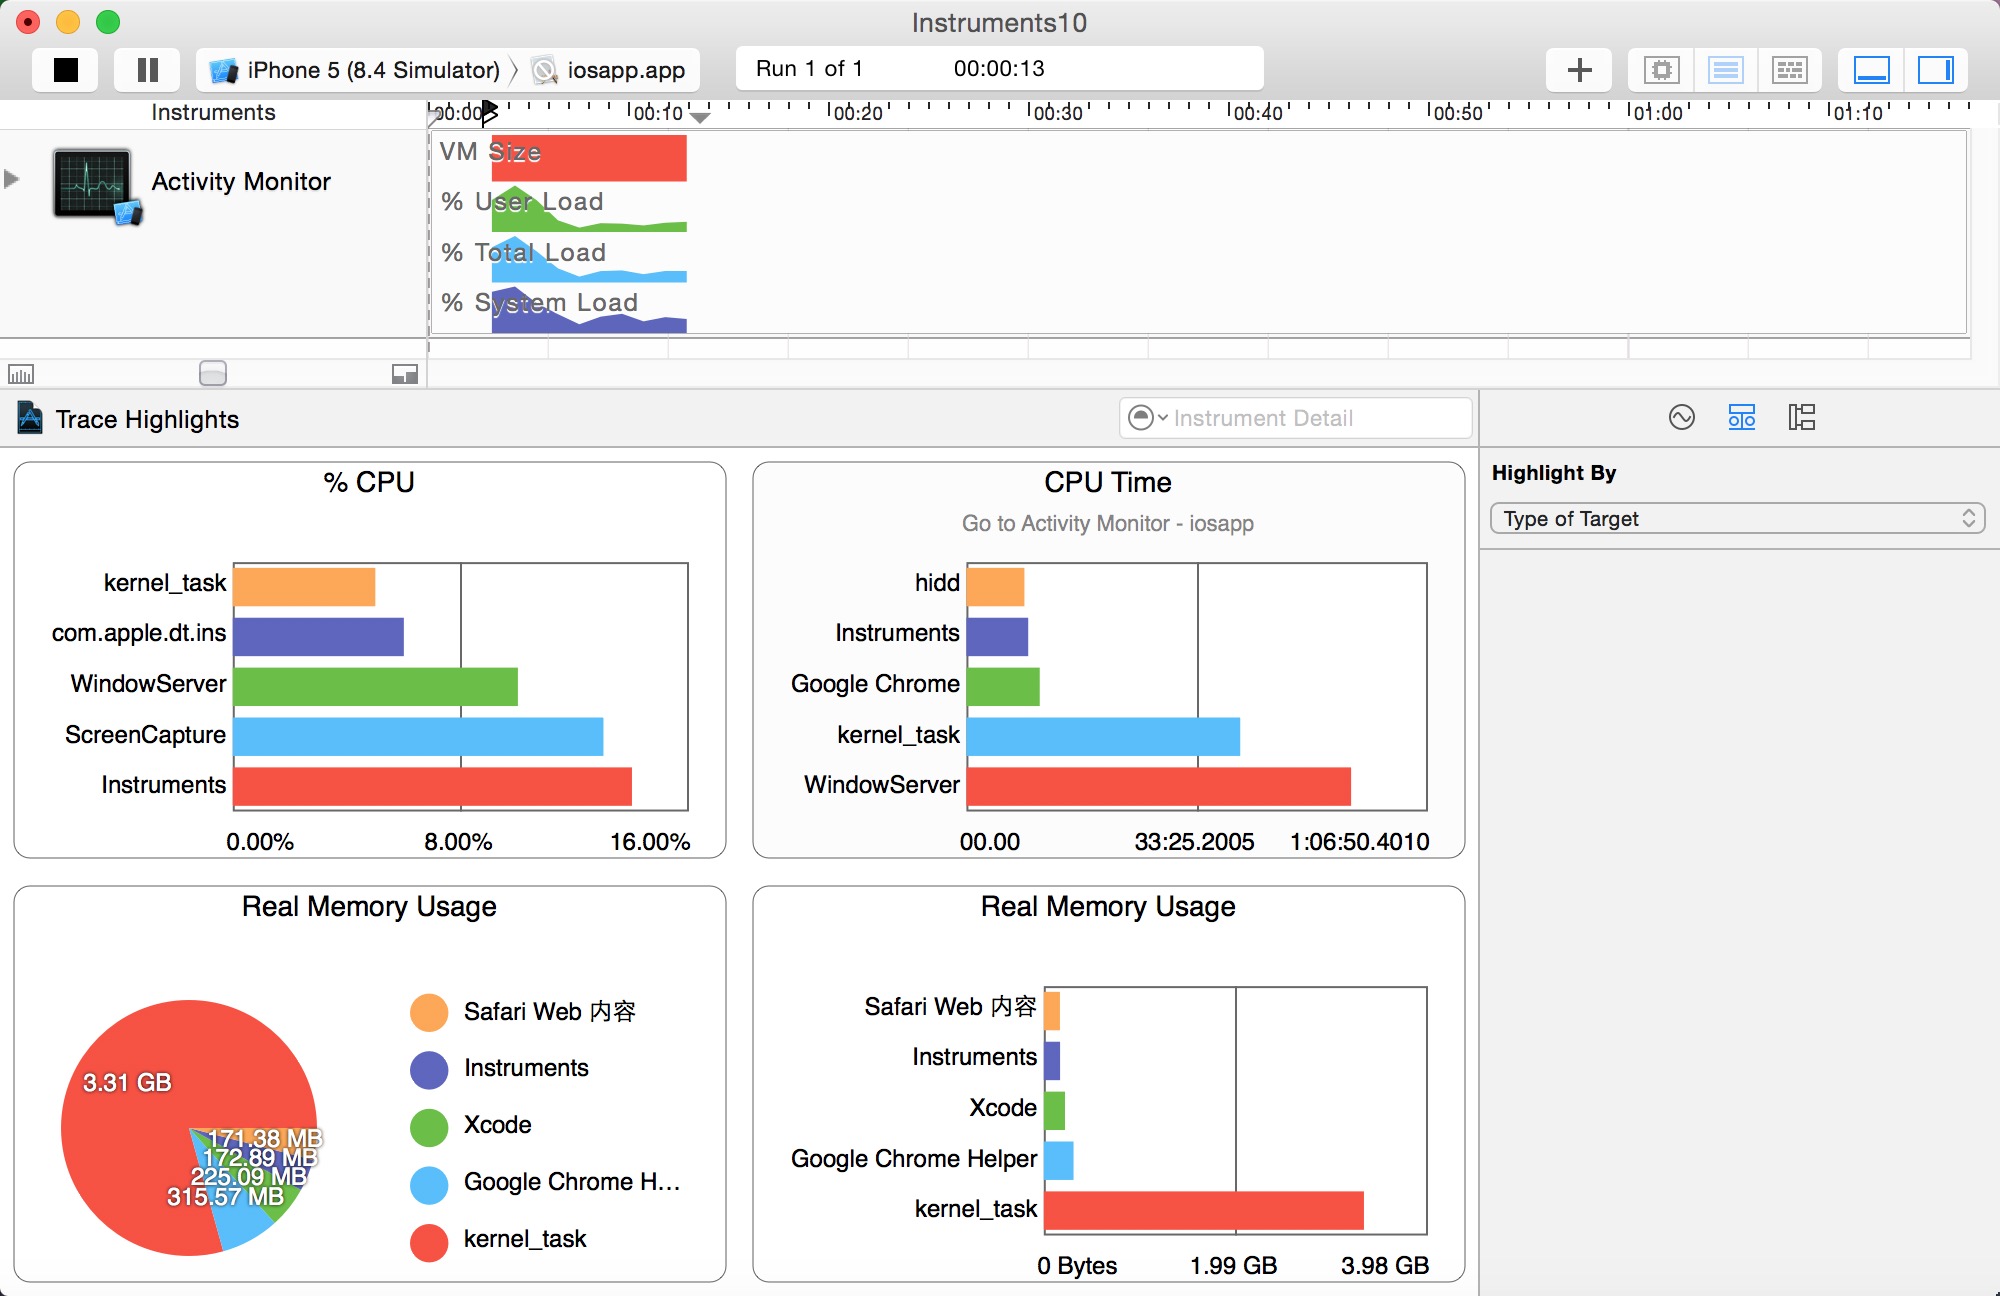
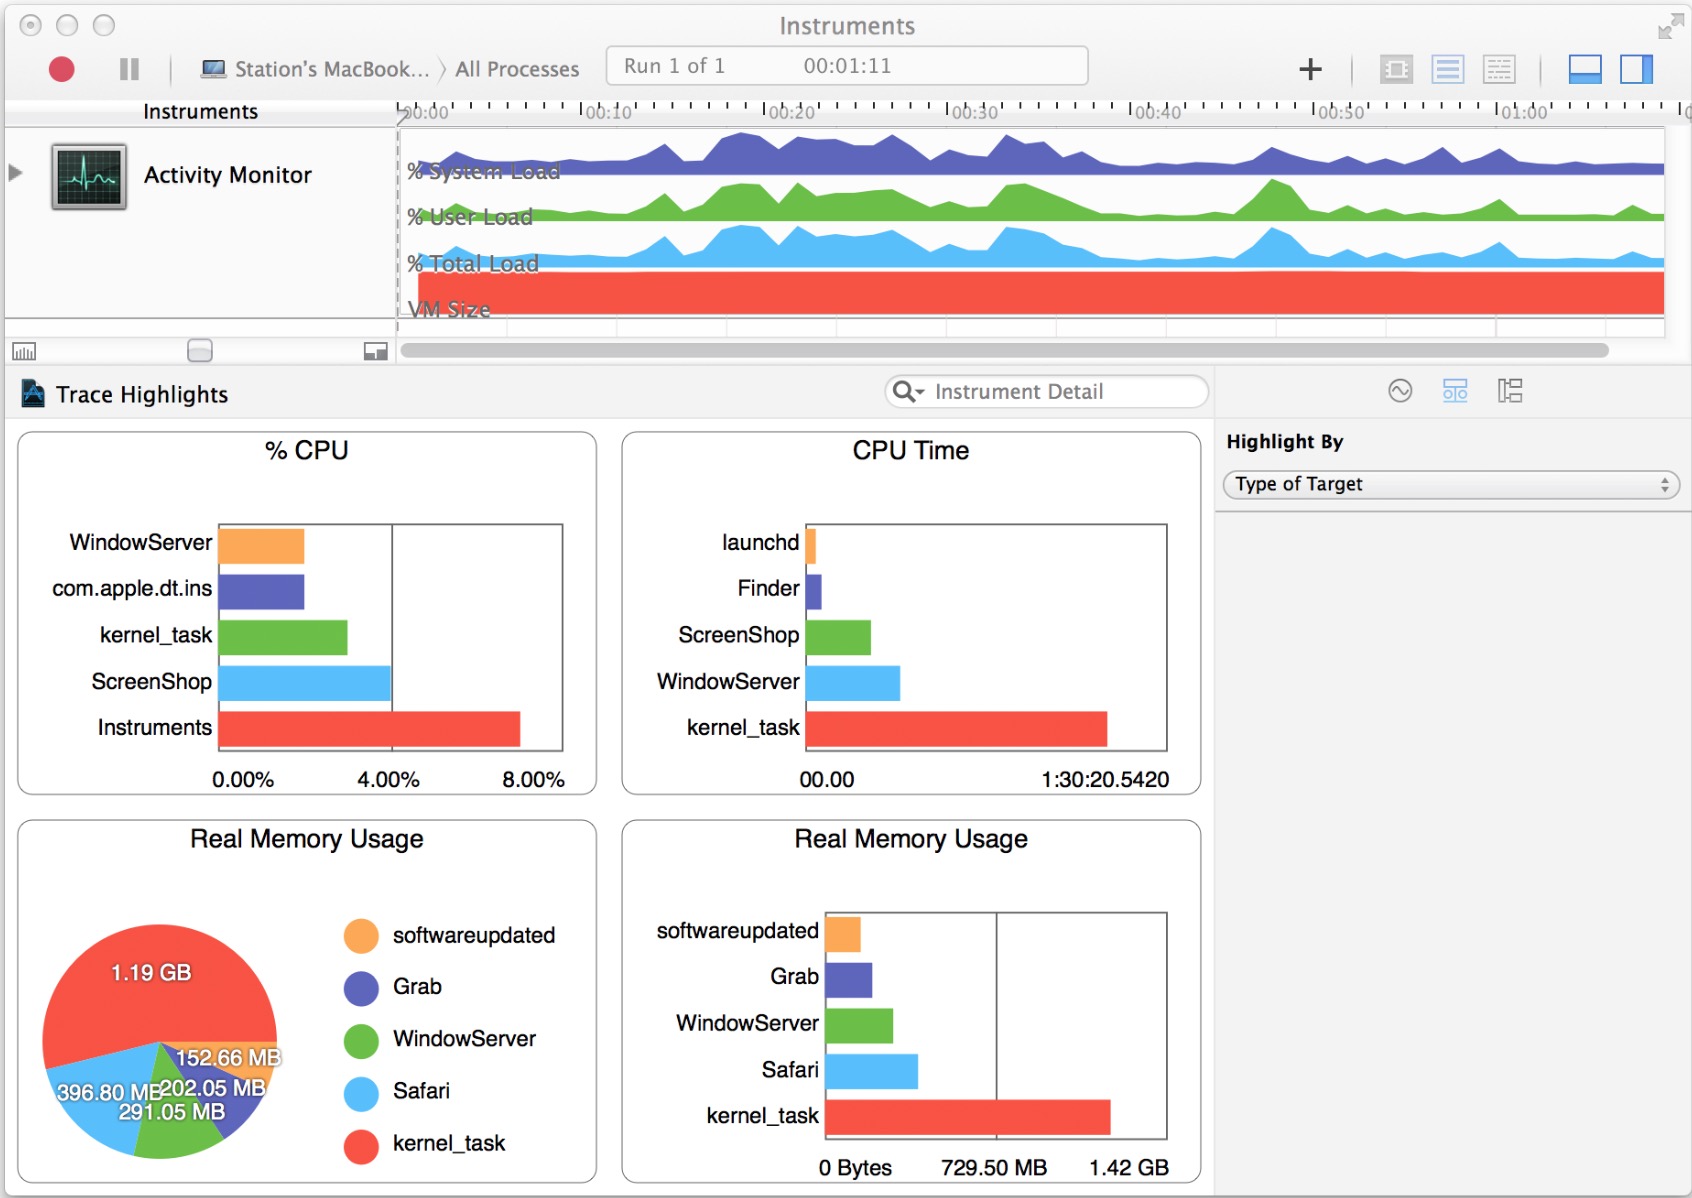
The Activity Monitor instrument captures information about the load on the system measured against the virtual memory size. It can record information from a single process or from all processes running on the system. The Activity Monitor instrument provides you with four convenient charts for a quick, visual representation of the collected information. The two charts that specifically describe memory usage are:
Real Memory Usage (bar graph). Shows the top five real memory users in a bar graph.
Real Memory Usage (pie chart). Shows the top five real memory users with the total memory used displayed.
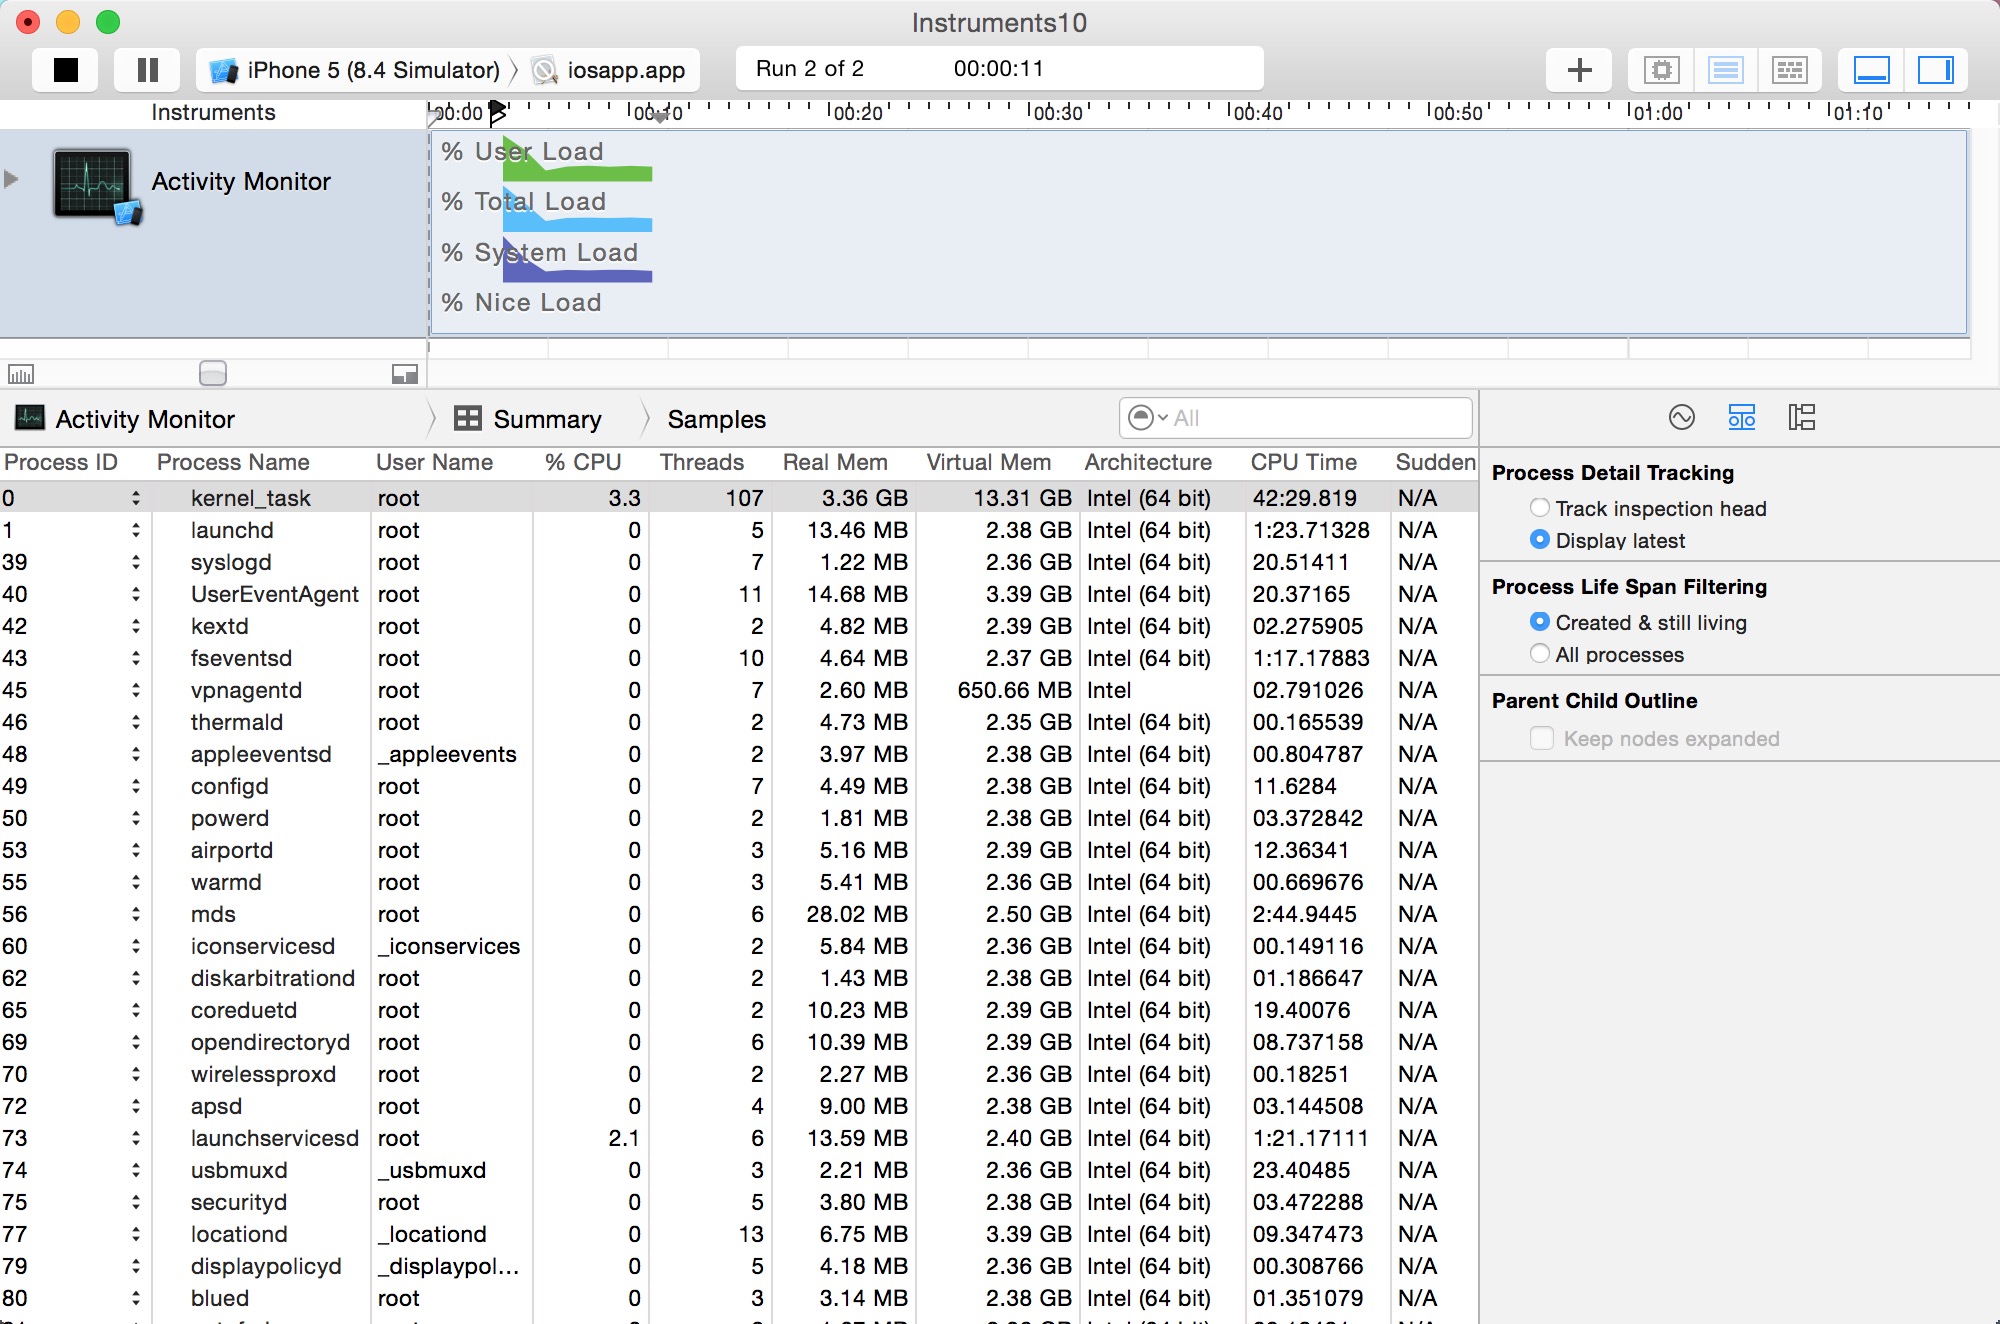
下图为Activity Monitor instrument with charts
The Record Settings area in the inspector sidebar includes a list of system statistics, which can be configured to appear in the track pane and graphically represent collected data. Select a statistic’s checkbox to see it graphed in the track pane. Click the shape or the color well to change how a statistic appears in the track pane.
There are a number of statistics the Activity Monitor instrument supports, but the following ones are memory-specific:
Physical Memory Wired
Physical Memory Active
Physical Memory Inactive
Physical Memory Used
Physical Memory Free
Total VM Size
VM Page In Bytes
VM Page Out Bytes
VM Swap Used
If one of the statistics above doesn’t appear under System Statistics, locate it under “Select statistics to list” and click its checkbox to include it in the list.
CPUTtotalLoad
CPUUserLoad
CPUSystemLoad
CPUNiceLoad
By default, the Activity Monitor template isn’t set up to display network activity. Therefore, you need to enable the desired network-related statistics in the Record Settings area in the inspector sidebar for the Activity Monitor instrument to see which processes are sending and receiving information.
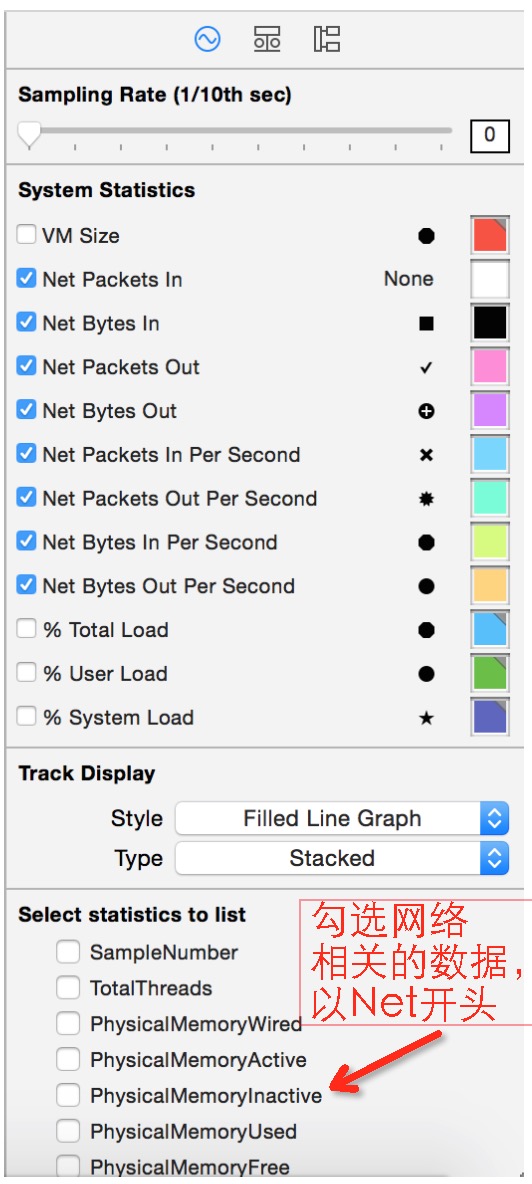
There are a number of statistics the Activity Monitor instrument supports, but the following ones are network-specific:
Net Packets In
Net Bytes In
Net Packets Out
Net Bytes Out
Net Packets In Per Second
Net Packets Out Per Second
Net Bytes In Per Second
Net Bytes Out Per Second
If one of the statistics above doesn’t appear under System Statistics in the Record Settings inspector, locate it
under “Select statistics to list” and click its checkbox to include it in the list.
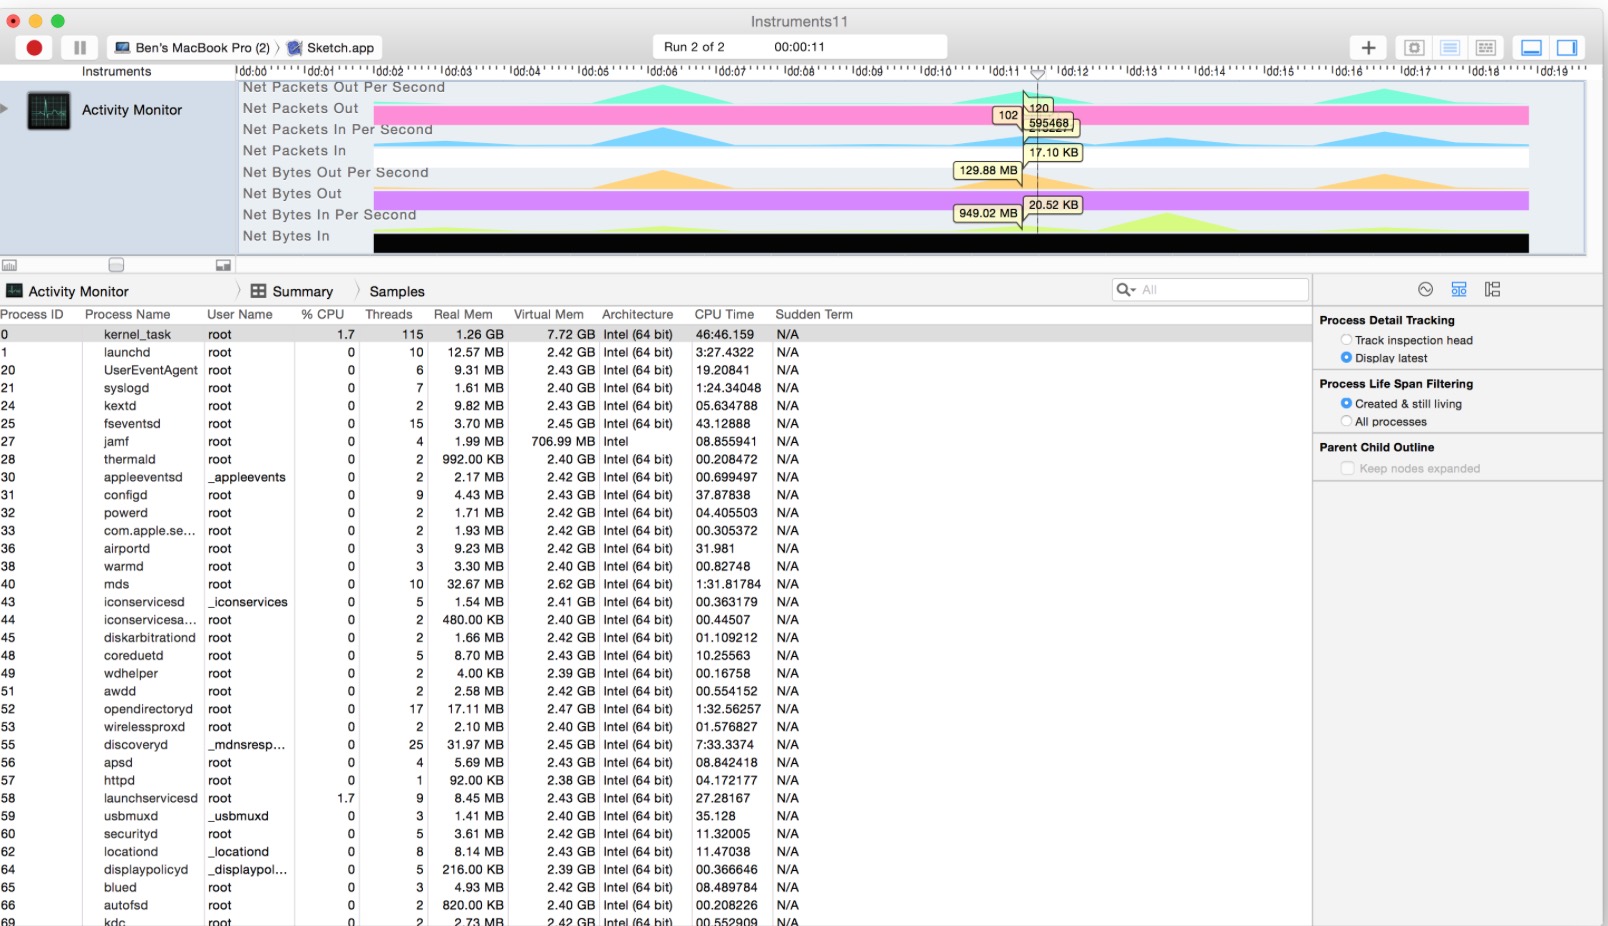
Once you have gathered network activity for your app, examine it carefully to pinpoint areas where your app is sending out excessive amounts of information and therefore tying up valuable device resources. When you minimize the amount of information sent and received, you can benefit from increased performance and response times in your app.
下图为Activity Monitor instrument tracing network packets
Instruments_Activity Monitor使用入门的更多相关文章
- Instruments之Activity Monitor使用入门
Activity Monitor,官方解释为:(活动监视器)即实时显示CPU.内存和网络的使用情况,记录由虚拟内存大小测量的系统负载.用一句大白话来说,Activity Monitor类似Window ...
- Monitor HDU6514 二维差分入门学习
Monitor HDU 6514 二维差分入门学习 题意 小腾有\(n*m\)的田地,但是有小偷来偷东西,在一片矩形区域上,有一部分区域是监控可以覆盖到的,这部分区域由一个或多个包含于该矩形区域的小矩 ...
- Linux入门(17)——Ubuntu16.04显示内存CPU网速等(System Monitor)
终端查看内存状况有两个命令 top htop 如果系统没有安装htop的话,那就安装一下. 然而这样比较麻烦,System Monitor是个不错的选择,System Monitor可以显示网速,内存 ...
- 分布式学习系列【dubbo入门实践】
分布式学习系列[dubbo入门实践] dubbo架构 组成部分:provider,consumer,registry,monitor: provider,consumer注册,订阅类似于消息队列的注册 ...
- 快速入门MySQL教程【转自:http://xpleaf.blog.51cto.com/9315560/1712821】
当时入门MySQL的时候,连数据库是什么都不知道,后来参考了一些网友的博客文章和论坛的帖子,才开始慢慢了解它.下面也是以一种可实际操作的方式来说明MySQL最最基本的使用了. 本篇文章的索引如下: 一 ...
- 21分钟 MySQL 入门教程(转载!!!)
21分钟 MySQL 入门教程 目录 一.MySQL的相关概念介绍 二.Windows下MySQL的配置 配置步骤 MySQL服务的启动.停止与卸载 三.MySQL脚本的基本组成 四.MySQL中的数 ...
- Intel VT入门
前言 传说中的VT貌似很神秘的样子,关于VT入门的资料又很少,于是研究了一番 由于资源有限,自身水平亦有限,并且是闭门造车之作,如有错误的地方请指正,不胜感激! 关于VT可以先参考海风月影写的 ...
- 30分钟带你快速入门MySQL教程
这是一篇真正适合初学者的MySQL数据库入门文章,哪怕你从来没有接触过数据库,或者说你从来没有听说过有数据库这东西,请一定要相信我,我当时就是这么过来的. 如果你刚开始接触MySQL数据库,或者你需要 ...
- salesforce 零基础开发入门学习(一)Salesforce功能介绍,IDE配置以及资源下载
目前国内已经有很多公司做salesforce,但是国内相关的资料确是少之又少.上个月末跳槽去了新公司,主要做的就是salesforce,不过当时想要看一些相关资料确实比较难.为了避免想要零基础学习的人 ...
随机推荐
- Integer.valueOf(String) 方法之惑
本文由 ImportNew - 靳禹 翻译自 stackoverflow.欢迎加入翻译小组.转载请见文末要求. 有个仁兄在 StackOverflow 上发起了一个问题,是这么问的: “ 我被下面的代 ...
- 微信公众平台开发接口PHP SDK完整版
<?php /* 方倍工作室 http://www.fangbei.org/ CopyRight 2015 All Rights Reserved */ define("TOKEN&q ...
- Idea 添加lib文件夹,并添加至项目Libary
在WEB-INF文件夹下新建lib文件夹,在lib文件夹上右键选择Add as Libary...,然后填写library名称,选择作用级别,选择作用项目,OK 注意:lib文件夹下需要有jar包后才 ...
- Java初学(六)
一.final(最终)可以修饰类.方法.变量 特点:final修饰类,该类不能被继承 final修饰方法,该方法不能被重写(覆盖.重载.复写) final修饰变量,该变量不能被重新赋值. ...
- 设置button不同状态下的背景色,即把这个颜色变成图片设置成,背景图片
- (void)setBackgroundColor:(UIColor *)backgroundColor forState:(UIControlState)state { [self setBack ...
- 网站性能Web压力测试工具webbench
webbench最多可以模拟3万个并发连接去测试网站的负载能力,个人感觉要比Apache自带的ab压力测试工具好,安装使用也特别方便. 1.适用系统:Linux 2.编译安装: wget http:/ ...
- Egret命令行小结
1. build 构建指定项目,编译指定项目的TypeScript文件2. create 创建新项目3. create_app 从h5游戏生成app4. create_mainfest 在工程目录下生 ...
- Linux 下安装配置 JDK7
Linux 下安装配置 JDK7 配置环境(debian 7) 自从从Oracle收购Sun近三年来,已经有很多变化.早在8月,甲骨文将“Operating System Distributor Li ...
- C++中析构函数的作用,
如果构造函数打开了一个文件,最后不需要使用时文件就要被关闭.析构函数允许类自动完成类似清理工作,不必调用其他成员函数.析构函数也是特殊的类成员函数.简单来说,析构函数与构造函数的作用正好相反,它用来完 ...
- PHP访问,增删改查,小结
PHP访问数据,增,删,改,查 增: 1,add.php 显示页面,利用 <form> 表单添加数据,数据添加到 name 中. 2,addchuli.php 处理页面,定义变量接受 $_ ...