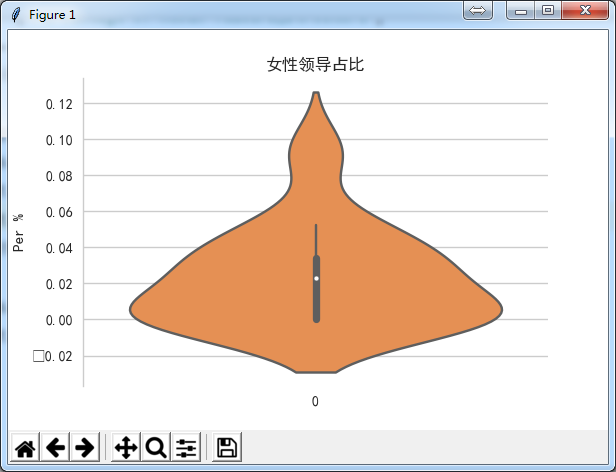
使用seaborn制图(小提琴图)
import numpy as np

import pandas as pd

import matplotlib.pyplot as plt

import seaborn as sns

# 设置风格,seaborn有5种基本风格,context表示环境

sns.set(style="white", context="notebook")

# 处理中文问题

sns.set_style('whitegrid', {'font.sans-serif':['simhei', 'Arial']})

data = pd.read_csv('D:\\myfiles\\study\\python\\analyse\\数据团\\城市数据团_数据分析师_体验课_课程资料\\数据资料\\地市级党委书记数据库(2000-10).csv', encoding='gbk')

data_gender2 = data[['省级政区名称','性别']]

data_gender2_re = data_gender2[data_gender2['性别'].notnull()]

pt = pd.crosstab(data_gender2_re['省级政区名称'], data_gender2_re['性别'])

pt['女性占比'] =  pt['女'] / (pt['女'] + pt['男'])

pt2 = pt.sort_values(by = ['女性占比'], ascending = False)

x = ['Percentage of Women leaders_structure']

y = pt2['女性占比'].tolist()

# 设定x,y值

x = ['Percentage of Women leaders_structure']

y = pt2['女性占比'].tolist()

# 设定x,y值

fig = plt.figure(figsize=(6,4))

sns.violinplot(data = y,palette="Oranges")

plt.title('Percentage of Women leaders')

plt.ylabel('Per %')

# 数据可视化:小提琴图

sns.despine(bottom=True)

plt.show()
使用seaborn制图(小提琴图)的更多相关文章
- Python图表数据可视化Seaborn:2. 分类数据可视化-分类散点图|分布图(箱型图|小提琴图|LV图表)|统计图(柱状图|折线图)
1. 分类数据可视化 - 分类散点图 stripplot( ) / swarmplot( ) sns.stripplot(x="day",y="total_bill&qu ...
- 人工智能-机器学习之seaborn(读取xlsx文件,小提琴图)
我们不止可以读取数据库的内容,还可以读取xlsx文件的内容,这个库有在有些情况还是挺实用的 首先我们想读取这个文件的时候必须得现有个seaborn库 下载命令就是: pip install seab ...
- seaborn分类数据可视化:散点图|箱型图|小提琴图|lv图|柱状图|折线图
一.散点图stripplot( ) 与swarmplot() 1.分类散点图stripplot( ) 用法stripplot(x=None, y=None, hue=None, data=None, ...
- seaborn学习笔记(四):箱型图、小提琴图
html { font-family: sans-serif; -ms-text-size-adjust: 100%; -webkit-text-size-adjust: 100% } body { ...
- 多变量分析绘图(hue参数)以及盒图和小提琴图
1,函数stipplot() stipplot()函数用来画散点图,其x轴是离散型的变量 直接上代码 import seaborn as sns import numpy as np import p ...
- R语言学习 - 箱线图(小提琴图、抖动图、区域散点图)
箱线图 箱线图是能同时反映数据统计量和整体分布,又很漂亮的展示图.在2014年的Nature Method上有2篇Correspondence论述了使用箱线图的好处和一个在线绘制箱线图的工具.就这样都 ...
- ArcMap 制图出图
在这里用的数据是:台湾2018年6月人口统计数据来做展示数据. ArcMap 里面主要用到的是:符号系统使用.布局视图等 一.属性中设置元素符号 ArcMap 初次加载数据,默认的是“单一符号”,就是 ...
- 使用seaborn制图(箱型图)
import numpy as np import pandas as pd import matplotlib.pyplot as plt import seaborn as sns # 设置风格, ...
- Matplotlib学习---用seaborn画矩阵图(pair plot)
矩阵图非常有用,人们经常用它来查看多个变量之间的联系. 下面用著名的鸢尾花数据来画一个矩阵图.从sklearn导入鸢尾花数据,然后将其转换成pandas的DataFrame类型,最后用seaborn画 ...
随机推荐
- DOS命令下使用sqlite3 命令中文乱码的解决办法
windows cmd窗口无法显示中文,不一定数据库中存储的就是乱码——多数情况只是显示问题,可以通过以下方式解决: 1.退出dos 或者重新开启在CMD窗口,输下:chcp 65001 然后回车确定 ...
- LeetCode Pascal's Triangle && Pascal's Triangle II Python
Pascal's Triangle Given numRows, generate the first numRows of Pascal's triangle. For example, given ...
- apache flink kubernetes 运行试用
类似docker-compose 运行模式,使用的是deploy 的模式 deploy yaml 文件 deploy-k8s-yaml apiVersion: extensions/v1beta1 k ...
- bootstrap modal模态框的运用
http://www.ziqiangxuetang.com/bootstrap/bootstrap-modal-plugin.html 方法 下面是一些可与 modal() 一起使用的有用的方法. 方 ...
- 【转】每天一个linux命令(12):more命令
原文网址:http://www.cnblogs.com/peida/archive/2012/11/02/2750588.html more命令,功能类似 cat ,cat命令是整个文件的内容从上到下 ...
- TopCoder客户端安装
参考:https://blog.csdn.net/github_39353095/article/details/76165940 首先,下载 Java 环境. https://www.java.co ...
- ser2net的编译及测试
1. 将ser2net编译进内核 1.1 make menuconfig 1.2 选上ser2net NetWork——>ser2net 2. 烧写固件 3.ser2net配置文件: 修改/et ...
- 【spring框架】spring获取webapplicationcontext,applicationcontext几种方法详解--(转)
方法一:在初始化时保存ApplicationContext对象代码:ApplicationContext ac = new FileSystemXmlApplicationContext(" ...
- 【精】Linux磁盘I/O性能监控之iostat详解
[精]Linux磁盘I/O性能监控之iostat详解 Linux命令详解----iostat 使用iostat分析IO性能
- Work01
7101:我是最酷的张绥:我的爱是弹吉他,唱歌,游泳,打篮球...: 我的博客是:https://www.cnblogs.com/Mrzs/ 我的码云个人主页是:https://gitee.com/s ...