[Debug] Diagnose a Slow Page Using Developer Tools
Your page is showing high CPU usage and spinning up your laptop fan, but nothing is visibly happening. What is it doing, and why is it so slow?
This lesson is a real-world performance diagnosis of this very page, right here on egghead. Two infinite (but hidden) animations were causing CPU usage to spike, and Chrome's Task Manager and Performance tools helped uncover the elements causing the problem. You'll see how to use the profiler to record a snapshot, and learn a trick for discovering animations running in the background.
There numbers of things you can do to detect a slow page
1. Check the CPU usage
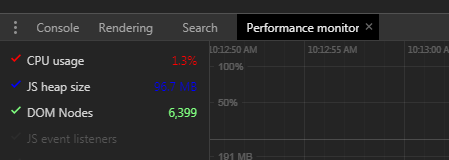
2. Bring up the chrome dev tool, performance monitor, pretty much you can say above 10% CPU usage is high
3. Record the Performance in dev tool to see any 'Layout' event, usually Layout event cause the DOM re-render, so we need to be carefully about this.
If there is such, check which element it is and try to solve the problem. For example, a hidden svg loading spinner, can cause the problem, we can set it to 'display: none', so it remove from the DOM
4. If there is any animation happens, we can do:
window.onanimationiteration = console.log
It will prints out when animation happens, so we can know that whether there is any unnecessary animation in the background.
[Debug] Diagnose a Slow Page Using Developer Tools的更多相关文章
- Can I prevent the Firefox developer tools network panel from clearing on page reload?
Can I prevent the Firefox developer tools network panel from clearing on page reload? I couldn't fin ...
- Developer tools
20. Developer tools Spring Boot includes an additional set of tools that can make the application de ...
- How to Build Office Developer Tools Projects with TFS Team Build 2012
Introduction Microsoft Visual Studio 2012 provides a new set of tools for developing apps for Office ...
- Chrome的开发者工具(Chrome Developer Tools)
Chrome的开发者工具(Chrome Developer Tools) 按F12 https://developer.chrome.com/devtools/index http://www.w3s ...
- 浏览器开发调试工具的秘密 - Secrets of the Browser Developer Tools
来源:GBin1.com 如果你是一个前端开发人员的话,正确的了解和使用浏览器开发工具是一个必须的技能. Secrets of the Browser Developer Tools是一个帮助大家了解 ...
- Chrome调试工具Developer Tools——前端必备神器
本文链接:https://blog.csdn.net/u012542647/article/details/79401485 今天要给大家介绍一个神器,就是谷歌浏览器(Chorme)自带的前端调试工具 ...
- Chrome Developer Tools:Network Panel说明
官方资料:Chrome Developer Tools: Network Panel 一.chrome Developer Tools:Network Panel 从网络面板中可以获取很多有用信息,如 ...
- eclipse中jsp文档无语法着色,安装Eclipse Java Web Developer Tools插件
一.安装Eclipse Java Web Developer Tools插件 1.eclipse菜单:help/install New Software,打开Available Software窗体: ...
- React Developer Tools 安装小提示
1,在google市场里边,安装React Developer Tools之后,发现是开启的,但是按下F12后,并没有发现react选项 2,后来通过查资料,发现必须是运行react项目的时候,才出现 ...
随机推荐
- maven使用nexus服务器
1.找到maven的安装路径,例如:C:\apache-maven-3.3.9 打开conf目录下的settings.xml文件 2.在<servers>节点下,配置 <server ...
- shortcut(NOIP模拟赛)(裸的排序)
原题: Description Mirek有一条每天从他家去大学工作的最喜欢的路.这个路径由若干个部分组成,且每个部分是10米长的直线.每一个部分是直线连接(没有拐弯)上一个部分或垂直连接上一个部分. ...
- 阿里云服务器上使用apt-get install出现404 Not Found
阿里云服务器上使用apt-get install出现404 Not Found 刚申请了的阿里云服务器,在其Ubuntu上用apt-get install安装软件时,会遇到 Failed to fet ...
- 【C语言】复杂类型声明
原文地址: http://blog.csdn.net/wangweixaut061/article/details/6549768 原文不让转载,但实在是有用,就拷贝了一小部分过来.全文请点开链接. ...
- hdu 1162(最小生成树)
Eddy's picture Time Limit: 2000/1000 MS (Java/Others) Memory Limit: 65536/32768 K (Java/Others)To ...
- ros navigation stack---move_base
大部分内容参考自: ros_by_example_hydro_volume_1.pdf 主要是讲如何让先锋机器人在空白地图上运动 上面图是navigation框架图,可以看到move_base处在核心 ...
- 使用sqlplus执行sql时,发现有中文有乱码解决方法
https://blog.csdn.net/fyyinjing/article/details/77877239
- 图文详解前端CSS中的Grid布局,你真的可以5分钟掌握
前言 网站的布局是一个网站设计的根本,CSS的Grid布局已经成为了未来网站布局的基本方式. 今天这篇文章我们通过图文,一起看看如何自己实现Grid布局方式. CSS 第一个Grid布局 首先我们看看 ...
- SpringMVC + Hibernate + MySQL 的简易网页搭建(Dao层 实现篇)
首先在搭建一个网站后台前,需要明确出一个合理的网页搭建的结构框架,即从DB ==> Dao层 ==>Service层 ==>Control层 ==>View层(该层严格意义 ...
- (2)WPF XAML
一.创建一个空白界面 <Window x:Class="WpfApp1.MainWindow" xmlns="http://schemas.microsoft.co ...