
Blktrace原理简介及使用
Blktrace是一个用户态的工具,用来收集磁盘IO信息中当IO进行到块设备层(block层,所以叫blk trace)时的详细信息(如IO请求提交,入队,合并,完成等等一些列的信息)。
块设备层处于下图(借用褚霸的图)中的 “block layer”
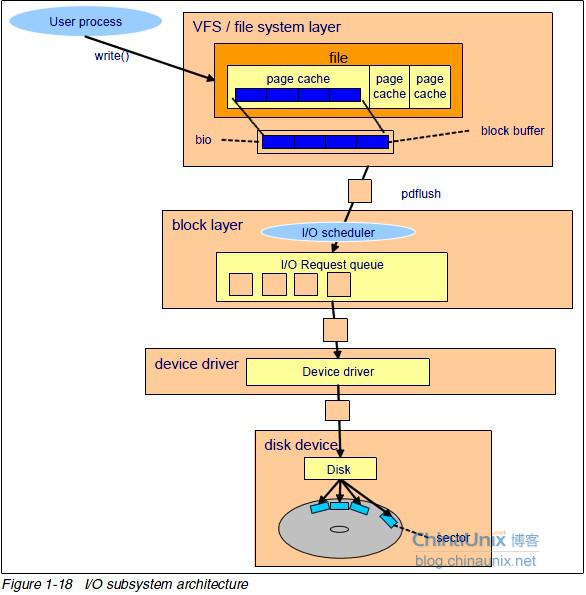
(1) blktrace测试的时候,会分配物理机上逻辑cpu个数个线程,并且每一个线程绑定一个逻辑cpu来收集数据
(2) blktrace在debugfs挂载的路径(默认是/sys/kernel/debug )下每个线程产生一个文件(就有了对应的文件描述符),然后调用ioctl函数(携带文件描述符, _IOWR(0x12,115,struct blk_user_trace_setup),& blk_user_trace_setup三个参数),产生系统调用将这些东西给内核去调用相应函数来处理,由内核经由debugfs文件系统往此文件描述符写入数据
(3) blktrace需要结合blkparse来使用,由blkparse来解析blktrace产生的特定格式的二进制数据
(4) blkparse仅打开blktrace产生的文件,从文件里面取数据做展示以及最后做per cpu的统计输出,但blkparse中展示的数据状态(如 A,U,Q,详细见下)是blkparse在t->action & 0xffff之后自己把数值转换为“A,Q,U之类的状态”来展示的。
1. yum install blktrace
2. 源码获取(你也可以从源码安装)
git clone git://git.kernel.org/pub/scm/linux/kernel/git/axboe/blktrace.git bt
cd bt
make
make install
由之前的blktrace工作原理可知,blktrace需要借助内核经由debugfs文件系统(debugfs文件系统在内存中)来输出信息
所以用blktrace工具之前需要先挂载debugfs文件系统
mount –t debugfs debugfs /sys/kernel/debug
或者在/etc/fstab中添加下面一行以便在开机启动的时候自动挂载
debug /sys/kernel/debug debugfs default 0 0
blktrace具体语法man blktrace,这里讲常用的
mkdir test #blktrace生成的数据默认会在当前目录,如之前在blktrace原理中提到,每个逻辑cpu都有一个线程,产生一个文件,故会产生cpu数目个文件
blktrace –d /dev/sda –o test1
#对 /dev/sda的trace,输出文件名为test1. Blktrace.[0-cpu数-1] (文件里面存的是二进制数据,需要blkparse来解析)
Blktrace –d /dev/sda –o - |blkparse -i –
输出到终端用“-”表示,可是都是一堆二进制东西,没法看,所以需要实时blkparse来解析
Blkparse 的“-i”后加文件名,blktrace输出为“-“代表终端(代码里面写死了,就是用这个符号来代表终端),blkparse也用“-”来代表终端解析
blkparse具体语法man blkparse,这里讲常用的
blkparse -i test1 #对test1.blktrace. [0-cpu数-1]都解析(只统计有数据的),
实时数据的解析即上blktrace的“终端输出”
终端1:
blktrace /dev/sda -o - |blkparse -i – 跑着
终端2:
dd if=/dev/zero of=/root/a1 bs=4k count=1000
终端1显示
8,0 16 3041 94.435078912 891 A W 72411584 + 8 <- (8,2) 71884224
8,0 16 3042 94.435079691 891 Q W 72411584 + 8 [flush-8:0]
8,0 16 3043 94.435080790 891 M W 72411584 + 8 [flush-8:0]
8,0 16 3044 94.435083089 891 A W 72411592 + 8 <- (8,2) 71884232
这是默认输出格式,代码里默认输出格式为,再按action输出或不输出后续信息
其中每个字母代表意思如下,数字代表占几个字符,和printf里的数字输出一样的
如
8,0 16 3042 94.435079691 891 Q W 72411584 + 8 [flush-8:0]
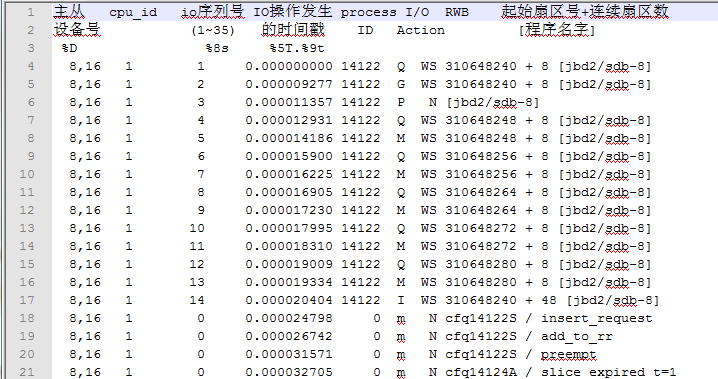
由于默认格式为先输出–f "%D %2c %8s %5T.%9t %5p %2a %3d "
(1)8,0 按默认输出对应%D,主从设备号
(2)16 按默认输出对应%2c,表示cpu id
(3)3042 按默认输出对应%8s,表示序列号(序列号是blkparse自己产生的一个序号,实际IO里没有这个号)
(4)94.435079691 按默认对应%5T.%9t,表示”秒.纳秒”
(5)891对应%5p,表示,进程id
(6)Q对应%2a,表示Action,Action表格如下(如Q表示IO handled by request queue code),更详细的含义见附录action表
The following table shows the various actions which may be output.
Act Description
A IO was remapped to a different device
B IO bounced
C IO completion
D IO issued to driver
F IO front merged with request on queue
G Get request
I IO inserted onto request queue
M IO back merged with request on queue
P Plug request
Q IO handled by request queue code
S Sleep request
T Unplug due to timeout
U Unplug request
X Split
(7)W 对应%3d,表示RWBS域(W表示写操作),各字母含义如下
至少包含“RWD“( R 读,W写,D块被忽略)中的1个字符
还可以附加“BS“(B barrier,S同步)
switch (act[0]) {
case 'R': /* Requeue */
case 'C': /* Complete */
if (t->action & BLK_TC_ACT(BLK_TC_PC)) {
char *p = dump_pdu(pdu_buf, pdu_len);
if (p)
fprintf(ofp, "(%s) ", p);
fprintf(ofp, "[%d]n", t->error);
} else {
if (elapsed != -1ULL) {
if (t_sec(t))
fprintf(ofp, "%llu + %u (%8llu) [%d]n",
(unsigned long long) t->sector,
t_sec(t), elapsed, t->error);
else
fprintf(ofp, "%llu (%8llu) [%d]n",
(unsigned long long) t->sector,
elapsed, t->error);
} else {
if (t_sec(t))
fprintf(ofp, "%llu + %u [%d]n",
(unsigned long long) t->sector,
t_sec(t), t->error);
else
fprintf(ofp, "%llu [%d]n",
(unsigned long long) t->sector,
t->error);
}
}
break;
case 'D': /* Issue */
case 'I': /* Insert */
case 'Q': /* Queue */
case 'B': /* Bounce */
if (t->action & BLK_TC_ACT(BLK_TC_PC)) {
char *p;
fprintf(ofp, "%u ", t->bytes);
p = dump_pdu(pdu_buf, pdu_len);
if (p)
fprintf(ofp, "(%s) ", p);
fprintf(ofp, "[%s]n", name);
} else {
if (elapsed != -1ULL) {
if (t_sec(t))
fprintf(ofp, "%llu + %u (%8llu) [%s]n",
(unsigned long long) t->sector,
t_sec(t), elapsed, name);
else
fprintf(ofp, "(%8llu) [%s]n", elapsed,
name);
} else {
if (t_sec(t))
fprintf(ofp, "%llu + %u [%s]n",
(unsigned long long) t->sector,
t_sec(t), name);
else
fprintf(ofp, "[%s]n", name);
}
}
break;
case 'M': /* Back merge */
case 'F': /* Front merge */
case 'G': /* Get request */
case 'S': /* Sleep request */
if (t_sec(t))
fprintf(ofp, "%llu + %u [%s]n",
(unsigned long long) t->sector, t_sec(t), name);
else
fprintf(ofp, "[%s]n", name);
break;
case 'P': /* Plug */
fprintf(ofp, "[%s]n", name);
break;
case 'U': /* Unplug IO */
case 'T': /* Unplug timer */
fprintf(ofp, "[%s] %un", name, get_pdu_int(t));
break;
case 'A': /* remap */
get_pdu_remap(t, &r);
fprintf(ofp, "%llu + %u <- (%d,%d) %llun",
(unsigned long long) t->sector, t_sec(t),
MAJOR(r.device_from), MINOR(r.device_from),
(unsigned long long) r.sector_from);
break;
case 'X': /* Split */
fprintf(ofp, "%llu / %u [%s]n", (unsigned long long) t->sector,
get_pdu_int(t), name);
break;
case 'm': /* Message */
fprintf(ofp, "%*sn", pdu_len, pdu_buf);
break;
default:
fprintf(stderr, "Unknown action %cn", act[0]);
break;
}
所以
8,0 16 3042 94.435079691 891 Q W 72411584 + 8 [flush-8:0]
中的act[0]=’Q’,后面的72411584是(8,0即sda)相对8:0的扇区起始号,+8,为后面连续的8个扇区(默认一个扇区512byte,所以8个扇区就是4K),后面的[flush-8:0]是程序的名字。
8,0 16 3041 94.435078912 891 A W 72411584 + 8 <- (8,2) 71884224
Action[0]=’A’, 72411584是相对8:0(即sda)的起始扇区号,(8,2)是相对/dev/sda2分区的扇区号为71884224,(由于/dev/sda2分区时sda磁盘上面的一个分区,故sda2上面的起始位置要先映射到sda磁盘上面去)
由于扇区号在磁盘上面是连续的,磁盘又被格式化成很多块,一个块里包含多个扇区,所以,扇区号/块大小=块号,
根据块号你就可以找到对应的inode,
debugfs -R 'icheck 块号' 具体磁盘或分区
如你的扇区号是相对sda2上面算出来的块号,那debugfs –R ‘icheck 块号’ /dev/sda2就可以找到对应的inode
根据inode你就可以找到对应的文件是什么了
find / -inum your_inode
有一个例子见淘宝牛人写的一篇链接地址
C – complete A previously issued request has been completed. The output
will detail the sector and size of that request, as well as the success or
failure of it.
D – issued A request that previously resided on the block layer queue or in
the io scheduler has been sent to the driver.
I – inserted A request is being sent to the io scheduler for addition to the
internal queue and later service by the driver. The request is fully formed
at this time.
Q – queued This notes intent to queue io at the given location. No real requests
exists yet.
B – bounced The data pages attached to this bio are not reachable by the
hardware and must be bounced to a lower memory location. This causes
a big slowdown in io performance, since the data must be copied to/from
kernel buffers. Usually this can be fixed with using better hardware -
either a better io controller, or a platform with an IOMMU.
m – message Text message generated via kernel call to blk add trace msg.
M – back merge A previously inserted request exists that ends on the boundary
of where this io begins, so the io scheduler can merge them together.
F – front merge Same as the back merge, except this io ends where a previously
inserted requests starts.
G – get request To send any type of request to a block device, a struct request
container must be allocated first.
S – sleep No available request structures were available, so the issuer has to
wait for one to be freed.
P – plug When io is queued to a previously empty block device queue, Linux
will plug the queue in anticipation of future ios being added before this
data is needed.
U – unplug Some request data already queued in the device, start sending
requests to the driver. This may happen automatically if a timeout period
has passed (see next entry) or if a number of requests have been added to
the queue.
T – unplug due to timer If nobody requests the io that was queued after
plugging the queue, Linux will automatically unplug it after a defined
period has passed.
X – split On raid or device mapper setups, an incoming io may straddle a
device or internal zone and needs to be chopped up into smaller pieces
for service. This may indicate a performance problem due to a bad setup
of that raid/dm device, but may also just be part of normal boundary
conditions. dm is notably bad at this and will clone lots of io.
A – remap For stacked devices, incoming io is remapped to device below it in
the io stack. The remap action details what exactly is being remapped to
what.
外带一张图,可能看得更清楚
Blktrace原理简介及使用的更多相关文章
- storm 原理简介及单机版安装指南——详细版【转】
storm 原理简介及单机版安装指南 本文翻译自: https://github.com/nathanmarz/storm/wiki/Tutorial 原文链接自:http://www.open-op ...
- Java进阶(二十四)Java List集合add与set方法原理简介
Java List集合add与set方法原理简介 add方法 add方法用于向集合列表中添加对象. 语法1 用于在列表的尾部插入指定元素.如果List集合对象由于调用add方法而发生更改,则返回 tr ...
- kafka原理简介并且与RabbitMQ的选择
kafka原理简介并且与RabbitMQ的选择 kafka原理简介,rabbitMQ介绍,大致说一下区别 Kafka是由LinkedIn开发的一个分布式的消息系统,使用Scala编写,它以可水平扩展和 ...
- InheritableThreadLocal类原理简介使用 父子线程传递数据详解 多线程中篇(十八)
上一篇文章中对ThreadLocal进行了详尽的介绍,另外还有一个类: InheritableThreadLocal 他是ThreadLocal的子类,那么这个类又有什么作用呢? 测试代码 p ...
- Nginx 负载均衡原理简介与负载均衡配置详解
Nginx负载均衡原理简介与负载均衡配置详解 by:授客 QQ:1033553122 测试环境 nginx-1.10.0 负载均衡原理 客户端向反向代理发送请求,接着反向代理根据某种负载机制 ...
- Nginx 反向代理工作原理简介与配置详解
Nginx反向代理工作原理简介与配置详解 by:授客 QQ:1033553122 测试环境 CentOS 6.5-x86_64 nginx-1.10.0 下载地址:http://nginx. ...
- Linux DNS原理简介及配置
Linux DNS原理简介及配置 DNS简介 DNS原理 域名解析的过程 资源记录 DNS BIND安装配置 一.简介 一般来讲域名比IP地址更加的有含义.也更容易记住,所以通常用户更习惯输入域名来访 ...
- Oracle Golden Gate原理简介
Oracle Golden Gate原理简介 http://www.askoracle.org/oracle/HighAvailability/20140109953.html#6545406-tsi ...
- Linux SSH基于密钥交换的自动登陆原理简介及配置说明
一.原理简介 SSH证书认证登录的基础是一对唯一匹配密钥: 私钥(private key)和公钥(public key).公钥用于对数据进行加密,而且只能用于加密.而私钥只能对使用所匹配的公钥,所加密 ...
随机推荐
- drupal7,注册成功之后想跳转到指定页面,该怎么破?
1.hook sigup form alter,修改跳转地址 .还没试过 2.安装一下logintoboggan模块,里面有个注册后跳转到哪个页面的设置 这个对于不写代码的是比较方便的方法 3 ...
- OpenGL学习--05--纹理立方体--代码
1.tutorial05.cpp // Include standard headers #include <stdio.h> #include <stdlib.h> // I ...
- MVP+Dagger2+Rxjava+Retrofit+GreenDao 小应用,包含新闻、图片、视频3个大模块,代码整洁干练
练习MVP架构开发的App,算是对自己学过的知识做一个总结,做了有一段时间,界面还算挺多的,代码量还是有的,里面做了大量封装,整体代码整理得很干净,这个我已经尽力整理了.不管是文件(Java.xml. ...
- 【Android】Retrofit 2.0 的使用
一.概述 Retrofit是Square公司开发的一个类型安全的Java和Android 的REST客户端库.来自官网的介绍: A type-safe HTTP client for Android ...
- 单位换算 M、Mb、MB
硬盘单位和存储单位 硬盘单位 存储空间 K M G Kb Mb Gb 1k =1000 bytes 1m = 1000000 bytes 1g = 1000000000 bytes 1kb ...
- Jmeter入门--元件作用域和执行顺序
一.元件作用域 8类可被执行的元件(测试计划于线程组不属于可执行元件),这些元件中,取样器(Sampler)是典型的不与其他元件发生交互作用的元件,逻辑控制器只对其子节点的取样器有效,而其他元件(配置 ...
- flask的g对象
故名思议我们可以理解这个g对象是一个全局的对象,这个对象存储的是我们这一次请求的所有的信息,只是存储这一次的请求 g:global 1. g对象是专门用来保存用户的数据的. 2. g对象在一次请求中 ...
- [翻译] NMBottomTabBarController
NMBottomTabBarController A customisable tab bar controller for iOS written in Objective C. It uses a ...
- 【转载】http和socket之长连接和短连接
TCP/IP TCP/IP是个协议组,可分为三个层次:网络层.传输层和应用层. 在网络层有IP协议.ICMP协议.ARP协议.RARP协议和BOOTP协议. 在传输层中有TCP协议与UDP协议. 在应 ...
- Beautifulsoup模块安装之pip命令
1.在python引用 BeautifulSoup >>>from bs4 import BeautifulSoup 发现没有该模块 2.Linux输入 # pip install ...