【原创】大数据基础之Logstash(5)监控
有两种方式来监控logstash:
- api
- ui(xpack)
When you run Logstash, it automatically captures runtime metrics that you can use to monitor the health and performance of your Logstash deployment.
You can use the basic monitoring APIs provided by Logstash to retrieve these metrics. These APIs are available by default without requiring any extra configuration.
Alternatively, you can configure X-Pack monitoring to send data to a monitoring cluster.
1 api
Node Info API
The node info API retrieves information about the node.
# curl http://127.0.0.1:9600/_node?pretty

{

  "host" : "server-05",

  "version" : "6.5.4",

  "http_address" : "127.0.0.1:9600",

  "id" : "d9f6ac1d-26ab-442e-9353-c0fe3f0fe8cf",

  "name" : "server-05",

  "pipelines" : {

    "main" : {

      "workers" : 8,

      "batch_size" : 125,

      "batch_delay" : 50,

      "config_reload_automatic" : false,

      "config_reload_interval" : 3000000000,

      "dead_letter_queue_enabled" : false

    }

  },

  "os" : {

    "name" : "Linux",

    "arch" : "amd64",

    "version" : "3.10.0-957.5.1.el7.x86_64",

    "available_processors" : 8

  },

  "jvm" : {

    "pid" : 23133,

    "version" : "1.8.0_141",

    "vm_version" : "1.8.0_141",

    "vm_vendor" : "Oracle Corporation",

    "vm_name" : "Java HotSpot(TM) 64-Bit Server VM",

    "start_time_in_millis" : 1553667245630,

    "mem" : {

      "heap_init_in_bytes" : 536870912,

      "heap_max_in_bytes" : 518979584,

      "non_heap_init_in_bytes" : 2555904,

      "non_heap_max_in_bytes" : 0

    },

    "gc_collectors" : [ "ParNew", "ConcurrentMarkSweep" ]

  }

}
Plugins Info API
The plugins info API gets information about all Logstash plugins that are currently installed. This API basically returns the output of running the bin/logstash-plugin list --verbose command.
# curl http://127.0.0.1:9600/_node/plugins?pretty

{

  "host" : "server-05",

  "version" : "6.5.4",

  "http_address" : "127.0.0.1:9600",

  "id" : "d9f6ac1d-26ab-442e-9353-c0fe3f0fe8cf",

  "name" : "server-05",

  "total" : 99,

  "plugins" : [ {

    "name" : "logstash-codec-cef",

    "version" : "5.0.6"

  }, {

    "name" : "logstash-codec-collectd",

    "version" : "3.0.8"

  }, {

    "name" : "logstash-codec-dots",

    "version" : "3.0.6"

  },

...
Node Stats API
The node stats API retrieves runtime stats about Logstash.
# curl http://127.0.0.1:9600/_node/stats?pretty

{

  "host" : "server-05",

  "version" : "6.5.4",

  "http_address" : "127.0.0.1:9600",

  "id" : "d9f6ac1d-26ab-442e-9353-c0fe3f0fe8cf",

  "name" : "server-05",

  "jvm" : {

    "threads" : {

      "count" : 35,

      "peak_count" : 36

    },

    "mem" : {

      "heap_used_percent" : 50,

      "heap_committed_in_bytes" : 518979584,

      "heap_max_in_bytes" : 518979584,

      "heap_used_in_bytes" : 261155016,

      "non_heap_used_in_bytes" : 178053152,

      "non_heap_committed_in_bytes" : 218259456,

      "pools" : {

        "survivor" : {

          "peak_used_in_bytes" : 17891328,

          "used_in_bytes" : 8614928,

          "peak_max_in_bytes" : 17891328,

          "max_in_bytes" : 17891328,

          "committed_in_bytes" : 17891328

        },

        "old" : {

          "peak_used_in_bytes" : 163566944,

          "used_in_bytes" : 163566944,

          "peak_max_in_bytes" : 357957632,

          "max_in_bytes" : 357957632,

          "committed_in_bytes" : 357957632

        },

        "young" : {

          "peak_used_in_bytes" : 143130624,

          "used_in_bytes" : 88973144,

          "peak_max_in_bytes" : 143130624,

          "max_in_bytes" : 143130624,

          "committed_in_bytes" : 143130624

        }

      }

    },

    "gc" : {

      "collectors" : {

        "old" : {

          "collection_time_in_millis" : 151,

          "collection_count" : 2

        },

        "young" : {

          "collection_time_in_millis" : 11958,

          "collection_count" : 1255

        }

      }

    },

    "uptime_in_millis" : 1049304126

  },

  "process" : {

    "open_file_descriptors" : 103,

    "peak_open_file_descriptors" : 104,

    "max_file_descriptors" : 4096,

    "mem" : {

      "total_virtual_in_bytes" : 5936197632

    },

    "cpu" : {

      "total_in_millis" : 7796970,

      "percent" : 0,

      "load_average" : {

        "1m" : 0.0,

        "5m" : 0.04,

        "15m" : 0.05

      }

    }

  },

  "events" : {

    "in" : 9135,

    "filtered" : 9135,

    "out" : 9135,

    "duration_in_millis" : 11314,

    "queue_push_duration_in_millis" : 0

  },

  "pipelines" : {

    "main" : {

      "events" : {

        "duration_in_millis" : 11314,

        "in" : 9135,

        "out" : 9135,

        "filtered" : 9135,

        "queue_push_duration_in_millis" : 0

      },

      "plugins" : {

        "inputs" : [ {

          "id" : "0117e36c20fc4824ffb286255d03535acb0d462b00c0294651d48e2028315a6f",

          "events" : {

            "out" : 9135,

            "queue_push_duration_in_millis" : 0

          },

          "name" : "jdbc"

        } ],

        "filters" : [ ],

        "outputs" : [ {

          "id" : "791eb5d509a6269e6cbcbf1a8a6ffbbd12aab2924fee6e35fc70f79938534e76",

          "events" : {

            "duration_in_millis" : 10136,

            "in" : 9135,

            "out" : 9135

          },

          "name" : "kafka"

        }, {

          "id" : "3b968b786147f8809c823ca797ff6b78e60f6615794fc4716a0f52bb619bffc8",

          "events" : {

            "duration_in_millis" : 185,

            "in" : 9135,

            "out" : 9135

          },

          "name" : "stdout"

        } ]

      },

      "reloads" : {

        "last_error" : null,

        "successes" : 0,

        "last_success_timestamp" : null,

        "last_failure_timestamp" : null,

        "failures" : 0

      },

      "queue" : {

        "type" : "memory"

      }

    }

  },

  "reloads" : {

    "successes" : 0,

    "failures" : 0

  },

  "os" : {

    "cgroup" : {

      "cpuacct" : {

        "usage_nanos" : 58556486084501,

        "control_group" : "/system.slice/sshd.service"

      },

      "cpu" : {

        "cfs_quota_micros" : -1,

        "control_group" : "/system.slice/sshd.service",

        "stat" : {

          "number_of_times_throttled" : 0,

          "time_throttled_nanos" : 0,

          "number_of_elapsed_periods" : 0

        },

        "cfs_period_micros" : 100000

      }

    }

  }

}
Hot Threads API
The hot threads API gets the current hot threads for Logstash. A hot thread is a Java thread that has high CPU usage and executes for a longer than normal period of time.
# curl http://127.0.0.1:9600/_node/hot_threads?pretty

{

  "host" : "server-05",

  "version" : "6.5.4",

  "http_address" : "127.0.0.1:9600",

  "id" : "d9f6ac1d-26ab-442e-9353-c0fe3f0fe8cf",

  "name" : "server-05",

  "hot_threads" : {

    "time" : "2019-04-08T17:42:53+08:00",

    "busiest_threads" : 3,

    "threads" : [ {

      "name" : "Ruby-0-Thread-10",

      "thread_id" : 32,

      "percent_of_cpu_time" : 0.05,

      "state" : "timed_waiting",

      "path" : ":1",

      "traces" : [ "sun.misc.Unsafe.park(Native Method)", "java.util.concurrent.locks.LockSupport.parkNanos(LockSupport.java:215)", "java.util.concurrent.locks.AbstractQueuedSynchronizer$ConditionObject.awaitNanos(AbstractQueuedSynchronizer.java:2078)" ]

    }, {

      "name" : "Ruby-0-Thread-11",

      "thread_id" : 33,

      "percent_of_cpu_time" : 0.05,

      "state" : "timed_waiting",

      "path" : ":1",

      "traces" : [ "sun.misc.Unsafe.park(Native Method)", "java.util.concurrent.locks.LockSupport.parkNanos(LockSupport.java:215)", "java.util.concurrent.locks.AbstractQueuedSynchronizer$ConditionObject.awaitNanos(AbstractQueuedSynchronizer.java:2078)" ]

    }, {

      "name" : "Ruby-0-Thread-6",

      "thread_id" : 28,

      "percent_of_cpu_time" : 0.05,

      "state" : "timed_waiting",

      "path" : ":1",

      "traces" : [ "sun.misc.Unsafe.park(Native Method)", "java.util.concurrent.locks.LockSupport.parkNanos(LockSupport.java:215)", "java.util.concurrent.locks.AbstractQueuedSynchronizer$ConditionObject.awaitNanos(AbstractQueuedSynchronizer.java:2078)" ]

    } ]

  }

}
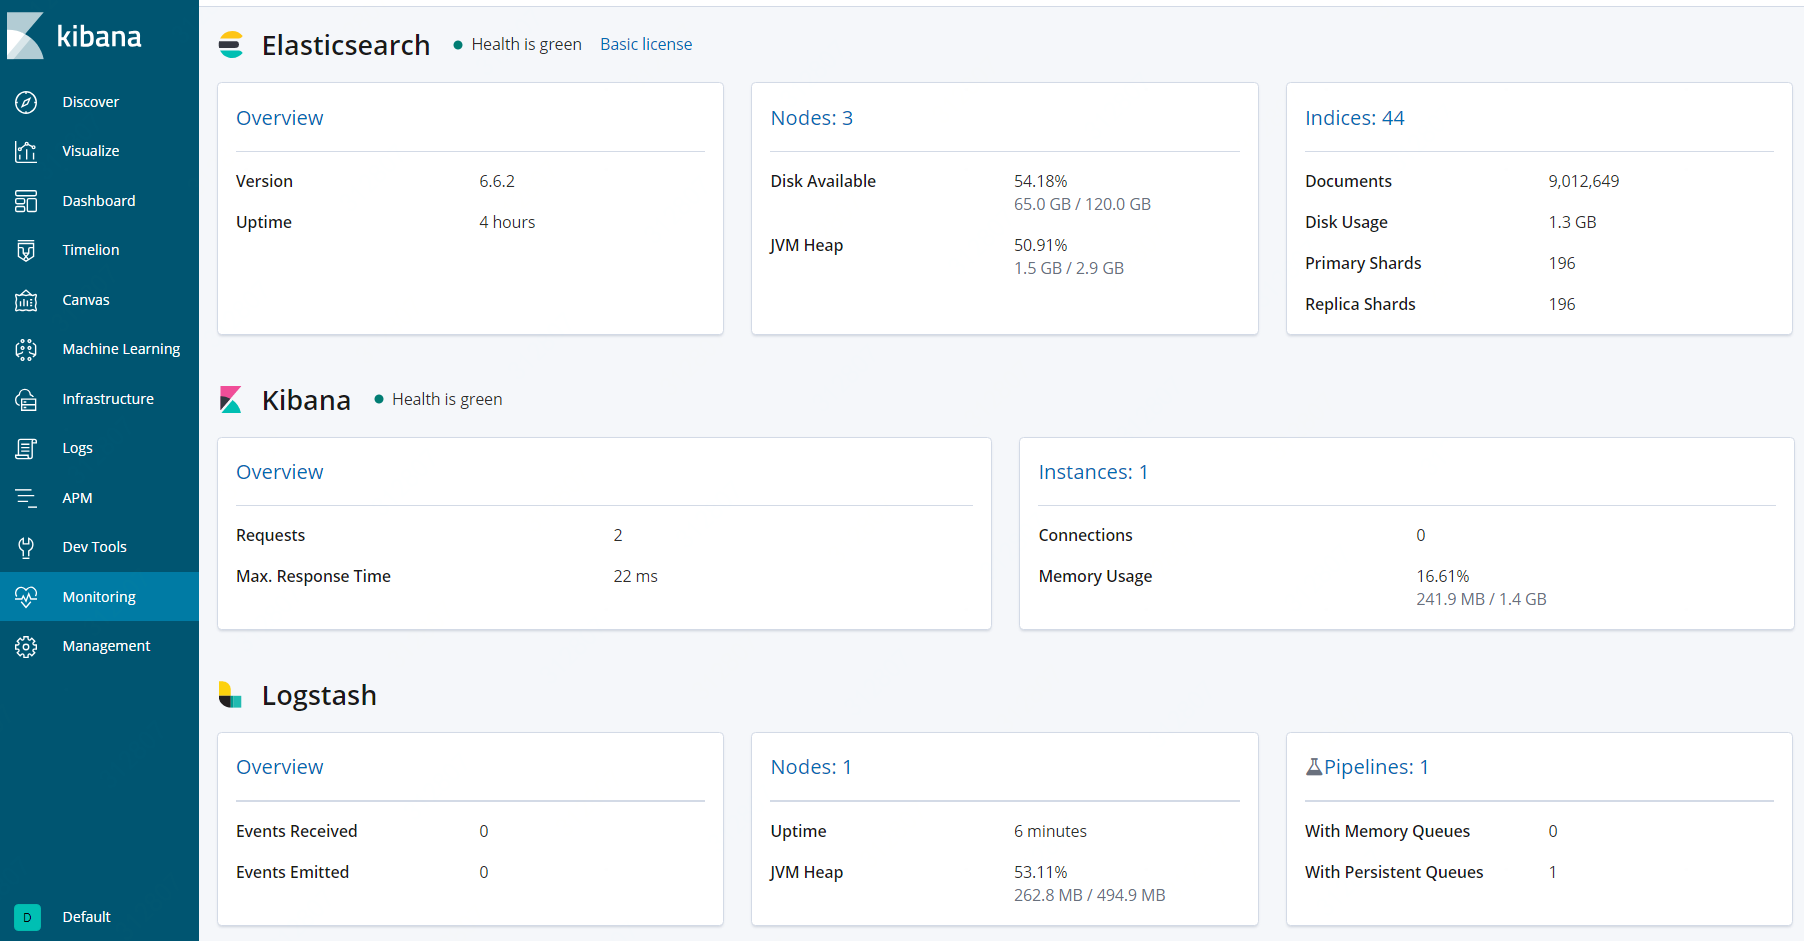
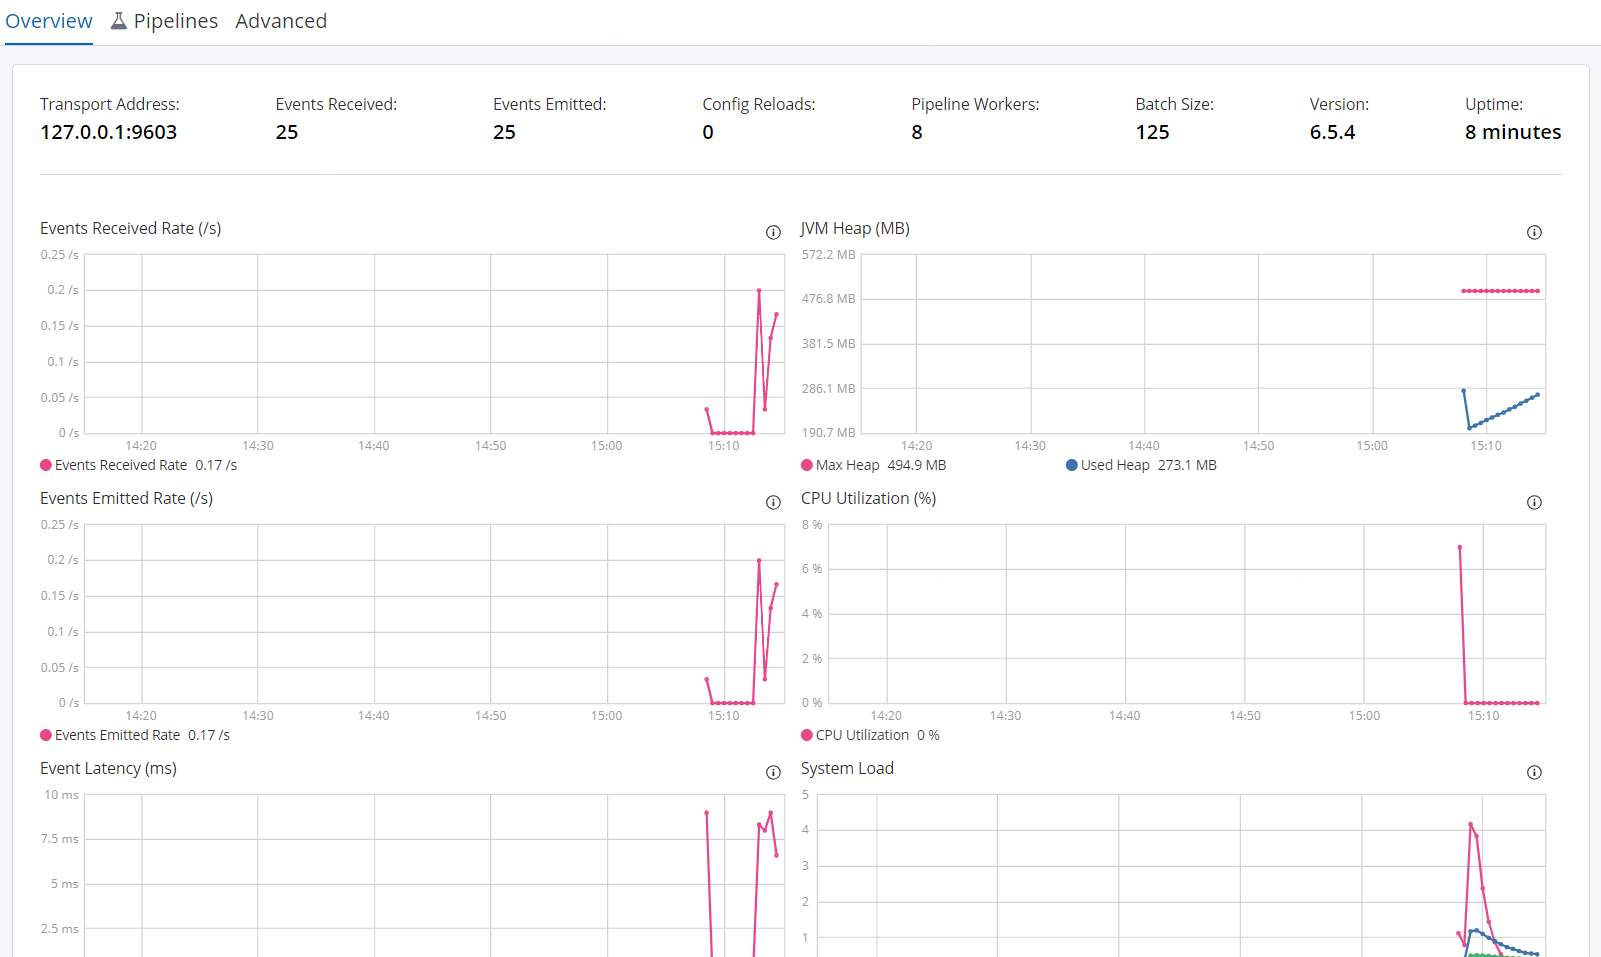
2 ui(xpack)
You can use the monitoring UI in X-Pack to view the metrics and gain insight into how your Logstash deployment is running.
Monitoring is an X-Pack feature under the Basic License and is therefore free to use.
The pipeline viewer in X-Pack offers additional visibility into the behavior and performance of complex pipeline configurations. It shows a graph representation of the overall pipeline topology, data flow, and branching logic, overlaid with important metrics, like events per second, for each plugin in the view.
配置
1)logstash
xpack.monitoring.enabled: true
xpack.monitoring.elasticsearch.hosts: ["http://es-prod-node-1:9200", "http://es-prod-node-2:9200"]
开启security或ssl会有更多配置
2)elasticsearch
xpack.monitoring.enabled: true
xpack.monitoring.collection.enabled: true
3)kibana
xpack.monitoring.enabled: true
Unlike X-Pack monitoring for Elasticsearch and Kibana, there is no xpack.monitoring.collection.enabled setting on Logstash. You must use the xpack.monitoring.enabled setting to enable and disable data collection.
kibana
A Logstash node is considered unique based on its persistent UUID, which is written to the path.data directory when the node starts.
参考:
https://www.elastic.co/guide/en/logstash/current/monitoring-logstash.html
https://www.elastic.co/guide/en/logstash/current/monitoring.html
https://www.elastic.co/guide/en/logstash/current/configuring-logstash.html
https://www.elastic.co/guide/en/logstash/current/logstash-monitoring-ui.html
https://www.elastic.co/guide/en/elasticsearch/reference/current/monitoring-settings.html
https://www.elastic.co/guide/en/kibana/current/monitoring-settings-kb.html
【原创】大数据基础之Logstash(5)监控的更多相关文章
- 【原创】大数据基础之Logstash(4)高可用
logstash高可用体现为不丢数据(前提为服务器短时间内不可用后可恢复比如重启服务器或重启进程),具体有两个方面: 进程重启(服务器重启) 事件消息处理失败 在logstash中对应的解决方案为: ...
- 【原创】大数据基础之Logstash(1)简介、安装、使用
Logstash 6.6.2 官方:https://www.elastic.co/products/logstash 一 简介 Centralize, Transform & Stash Yo ...
- 【原创】大数据基础之Logstash(3)应用之http(in和out)
一个logstash很容易通过http打断成两个logstash实现跨服务器或者跨平台间数据同步,比如原来的流程是 logstash: nginx log -> kafka 打断成两个是 log ...
- 【原创】大数据基础之Logstash(2)应用之mysql-kafka
应用一:mysql数据增量同步到kafka 1 准备mysql测试表 mysql> create table test_sync(id int not null auto_increment, ...
- 【原创】大数据基础之Logstash(3)应用之file解析(grok/ruby/kv)
从nginx日志中进行url解析 /v1/test?param2=v2¶m3=v3&time=2019-03-18%2017%3A34%3A14->{'param1':' ...
- 【原创】大数据基础之Logstash(6)mongo input
logstash input插件之mongodb是第三方的,配置如下: input { mongodb { uri => 'mongodb://mongo_server:27017/db' pl ...
- 【原创】大数据基础之Zookeeper(2)源代码解析
核心枚举 public enum ServerState { LOOKING, FOLLOWING, LEADING, OBSERVING; } zookeeper服务器状态:刚启动LOOKING,f ...
- 【原创】大数据基础之词频统计Word Count
对文件进行词频统计,是一个大数据领域的hello word级别的应用,来看下实现有多简单: 1 Linux单机处理 egrep -o "\b[[:alpha:]]+\b" test ...
- 【原创】大数据基础之Impala(1)简介、安装、使用
impala2.12 官方:http://impala.apache.org/ 一 简介 Apache Impala is the open source, native analytic datab ...
随机推荐
- Java的selenium代码随笔(8)
Selenium截图方法一: Selenium中截图类TakeScreenshout,这个类主要是获取浏览器窗体内的内容,不包括浏览器的菜单和桌面的任务栏区域,我们用百度首页来截图,看看截图效果. F ...
- NodeJs之服务搭建与数据库连接
NodeJs之服务搭建与数据库连接 一,介绍与需求分析 1.1,介绍 Node.js 是一个基于 Chrome V8 引擎的 JavaScript 运行环境. Node.js 使用了一个事件驱动.非阻 ...
- Flutter获取点击元素的位置与大小
使用 WidgetsBindingObserver获取 class CloseTap extends StatefulWidget { @override _CloseTapTapState crea ...
- jsonp原理,封装,应用(vue项目)
jsonp原理 JSON是一种轻量级的数据传输格式. JSONP(JSON with Padding)是JSON的一种“使用模式”,可用于解决主流浏览器的跨域数据访问的问题.由于同源策略,一般来说位于 ...
- AVIER Racing Drone App Privacy Policy
Personal Data collected for the following purposes and using the following services: Device permissi ...
- windows无法完成安装,若要在此计算机上安装,请重新启动安装
当出现如上提示的时候,不要重启,按下shift+f10 会打开命令窗口,先输入cd oobe 进入到C:\windows\system32\oobe文件夹,输入msoobe回车然后输入msoobe即可 ...
- Xilinx FPGA 移位寄存器IP延时问题
软件版本:Vivado2016.1 在使用移位寄存器IP时,对于不同延时拍数的使能延时可能会有问题. (1)32深度的可变长度移位寄存器,IP生成界面如下图所示. (2)128深度的可变长度移位寄存器 ...
- BZOJ 1010: 玩具装箱toy (斜率优化dp)
Description P教授要去看奥运,但是他舍不下他的玩具,于是他决定把所有的玩具运到北京.他使用自己的压缩器进行压缩,其可以将任意物品变成一堆,再放到一种特殊的一维容器中.P教授有编号为1... ...
- Tomcat 配置文件 server.xml
Tomcat隶属于Apache基金会,是开源的轻量级Web应用服务器,使用非常广泛.server.xml是Tomcat中最重要的配置文件,server.xml的每一个元素都对应了Tomcat中的一个组 ...
- [面试]volatile类型修饰符/内存屏障/处理器缓存
volatile类型修饰符 本篇文章的目的是为了自己梳理面试知识点, 在这里做一下笔记. 绝大部分内容是基于这些文章的内容进行了copy+整理: 1. http://www.infoq.com/cn/ ...