Hystrix-Dashboard仪表盘
Hystrix Dashboard,它主要用来实时监控Hystrix的各项指标信息。通过Hystrix Dashboard反馈的实时信息,可以帮助我们快速发现系统中存在的问题。下面通过一个例子来学习。
一、新建一个Spring Cloud 项目,命名为hystrix-dashboard
1.1在pom.xml引入相关的依赖
<dependency>

    <groupId>org.springframework.cloud</groupId>

    <artifactId>spring-cloud-starter-hystrix</artifactId>

</dependency>

<dependency>

    <groupId>org.springframework.cloud</groupId>

    <artifactId>spring-cloud-starter-hystrix-dashboard</artifactId>

</dependency>

<dependency>

    <groupId>org.springframework.boot</groupId>

    <artifactId>spring-boot-starter-actuator</artifactId>

</dependency>
1.2在spring boot 的启动类上面引入注解@EnableHystrixDashboard,启用Hystrix Dashboard功能。
package org.hope.hystrix.dashboard;

import org.springframework.boot.SpringApplication;

import org.springframework.cloud.client.SpringCloudApplication;

import org.springframework.cloud.netflix.hystrix.dashboard.EnableHystrixDashboard;

@EnableHystrixDashboard

@SpringCloudApplication

public class HystrixDashboardApplication {

    public static void main(String[] args) {

        SpringApplication.run(HystrixDashboardApplication.class, args);

    }

}
1.3修改配置文件application.properties
spring.application.name=hystrix-dashboard

server.port=2001
1.4启动应用,然后再浏览器中输入http://localhost:2001/hystrix可以看到如下界面
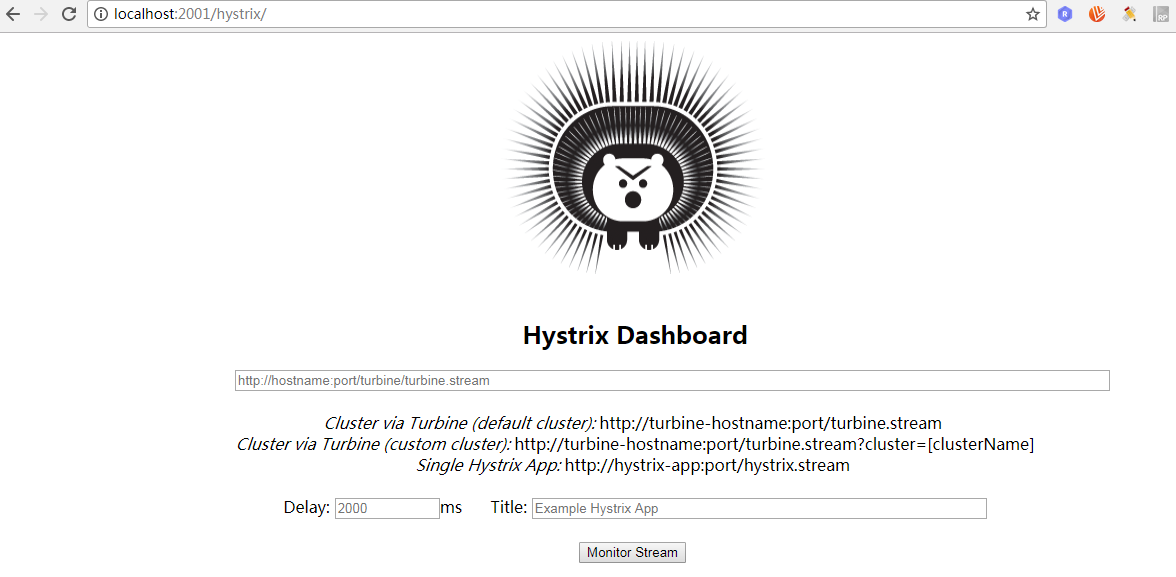
通过Hystrix Dashboard主页面的文字介绍,我们可以知道,Hystrix Dashboard共支持三种不同的监控方式
☞默认的集群监控:通过URL:http://turbine-hostname:port/turbine.stream开启,实现对默认集群的监控。
☞指定的集群监控:通过URL:http://turbine-hostname:port/turbine.stream?cluster=[clusterName]开启,实现对clusterName集群的监控。
☞单体应用的监控:通过URL:http://hystrix-app:port/hystrix.stream开启,实现对具体某个服务实例的监控。
☞Delay:控制服务器上轮询监控信息的延迟时间,默认为2000毫秒,可以通过配置该属性来降低客户端的网络和CPU消耗。
☞Title:该参数可以展示合适的标题。
二、要有一个eureka-server用来提供eureka的服务注册中心,在码云上有,可以作为参考。此处不再粘代码。
三、要有一个eureka-service来提供服务,工程名为hello-service,项目地址同上。
四、新建一个服务被监控的工程,工程名为ribbon-customer。
4.1pom.xml引入相关依赖
<dependency>

    <groupId>org.springframework.boot</groupId>

    <artifactId>spring-boot-starter-actuator</artifactId>

</dependency>

<dependency>

    <groupId>org.springframework.cloud</groupId>

    <artifactId>spring-cloud-starter-hystrix</artifactId>

</dependency>
4.2在启动类上添加@EnableCircuitBreaker 开启断路器功能
package com.didispace;

import org.springframework.boot.SpringApplication;

import org.springframework.boot.autoconfigure.SpringBootApplication;

import org.springframework.cloud.client.circuitbreaker.EnableCircuitBreaker;

import org.springframework.cloud.client.discovery.EnableDiscoveryClient;

import org.springframework.cloud.client.loadbalancer.LoadBalanced;

import org.springframework.context.annotation.Bean;

import org.springframework.web.client.RestTemplate;

@EnableCircuitBreaker //开启断路器功能

@EnableDiscoveryClient

@SpringBootApplication

public class ConsumerApplication {

    @Bean

    @LoadBalanced

    RestTemplate restTemplate() {

        return new RestTemplate();

    }

    public static void main(String[] args) {

        SpringApplication.run(ConsumerApplication.class, args);

    }

}
4.3 RestController
package com.didispace.web;

import org.springframework.beans.factory.annotation.Autowired;

import org.springframework.web.bind.annotation.RequestMapping;

import org.springframework.web.bind.annotation.RequestMethod;

import org.springframework.web.bind.annotation.RestController;

@RestController

public class ConsumerController {

    @Autowired

    HelloService helloService;

    @RequestMapping(value = "/ribbon-consumer", method = RequestMethod.GET)

    public String helloConsumer() {

        return helloService.hello();

    }

}
4.4 application.properties配置文件
spring.application.name=ribbon-consumer

server.port=9000

eureka.client.serviceUrl.defaultZone=http://localhost:1111/eureka/

hystrix.command.default.execution.isolation.thread.timeoutInMilliseconds=2000
通过上面的步骤,已经基本完成了准备工作,下面我们进行测试。
1.启动eureka-server
2.启动hello-service
3.启动ribbon-customer
4.启动hystrix-dashboard
5.在浏览器输入http://localhost:2001/hystrix
6.在浏览器的新窗口输入http://localhost:9000/ribbon-consumer
7.在Hystrix-Dashboard的主界面上输入: http://localhost:9000/hystrix.stream然后点击 Monitor Stream按钮
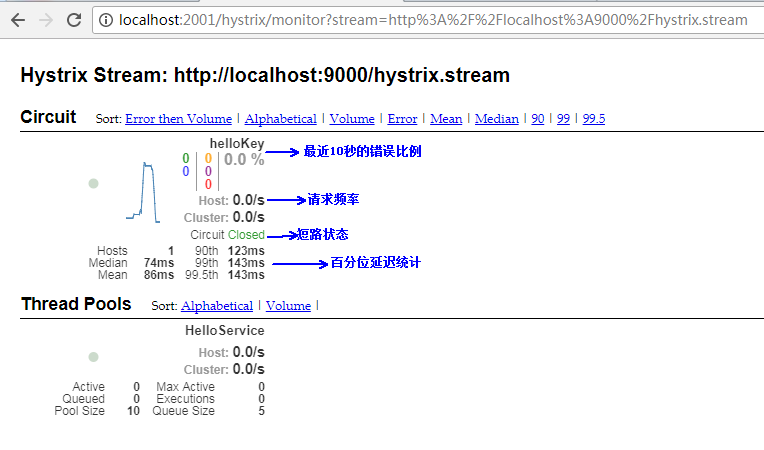
在监控的界面有两个重要的图形信息:一个实心圆和一条曲线。
▪实心圆:1、通过颜色的变化代表了实例的健康程度,健康程度从绿色、黄色、橙色、红色递减。2、通过大小表示请求流量发生变化,流量越大该实心圆就越大。所以可以在大量的实例中快速发现故障实例和高压实例。
▪曲线:用来记录2分钟内流浪的相对变化,可以通过它来观察流量的上升和下降趋势。
注意:当使用Hystrix Board来监控Spring Cloud Zuul构建的API网关时,Thread Pool信息会一直处于Loading状态。这是由于Zuul默认会使用信号量来实现隔离,只有通过Hystrix配置把隔离机制改成为线程池的方式才能够得以展示。
参考:
[1]《Spring Cloud微服务实战》,翟永超
[2]博客,纯洁的微笑,http://blog.csdn.net/ityouknow/article/details/72625646
Hystrix-Dashboard仪表盘的更多相关文章
- 【spring cloud】spring cloud2.X spring boot2.0.4调用feign配置Hystrix Dashboard 和 集成Turbine 【解决:Hystrix仪表盘Unable to connect to Command Metric Stream】【解决:Hystrix仪表盘Loading...】
环境: <java.version>1.8</java.version><spring-boot.version>2.0.4.RELEASE</spring- ...
- Spring Cloud第六篇 | Hystrix仪表盘监控Hystrix Dashboard
本文是Spring Cloud专栏的第六篇文章,了解前五篇文章内容有助于更好的理解本文: Spring Cloud第一篇 | Spring Cloud前言及其常用组件介绍概览 Spring Cloud ...
- hystrix dashboard Unable to connect to Command Metric Stream解决办法
spring cloud 在初次使用 hystrix dashboard仪表盘的时候很容易出现hystrix dashboard Unable to connect to Command Metric ...
- Spring Cloud 2-Hystrix DashBoard仪表盘(五)
Spring Cloud Hystrix DashBoard 1.监控系统配置 pom.xml application.yml Application.java 2.被监控服务配置 pom.xml ...
- Spring Cloud 入门教程(八): 断路器指标数据监控Hystrix Dashboard 和 Turbine
1. Hystrix Dashboard (断路器:hystrix 仪表盘) Hystrix一个很重要的功能是,可以通过HystrixCommand收集相关数据指标. Hystrix Dashboa ...
- 【六】Hystrix Dashboard
除了隔离依赖服务的调用以外,Hystrix还提供了准实时的调用监控(Hystrix Dashboard) , Hystrix会持续地记录所有通过 Hystrix发起的请求的执行信息,并以统计报表和图形 ...
- springcloud-知识点总结(三):Hystrix & Dashboard & turbine & Zuul & SpringCloud Config
1.Hystrix断路器简介 Hystrix断路器简介 hystrix对应的中文名字是“豪猪”,豪猪周身长满了刺,能保护自己不受天敌的伤害,代表了一种防御机制,这与hystrix本身的功能不谋而合,因 ...
- 服务容错保护断路器Hystrix之三:断路器监控(Hystrix Dashboard)-单体监控
turbine:英 [ˈtɜ:baɪn] 美 [ˈtɜ:rbaɪn] n.汽轮机;涡轮机;透平机 一.Hystrix Dashboard简介 在微服务架构中为了保证程序的可用性,防止程序出错导致网络阻 ...
- SpringCloud (十) Hystrix Dashboard单体监控、集群监控、与消息代理结合
一.前言 Dashboard又称为仪表盘,是用来监控项目的执行情况的,本文旨在Dashboard的使用 分别为单体监控.集群监控.与消息代理结合. 代码请戳我的github 二.快速入门 新建一个Sp ...
- springcloud系列九 整合Hystrix Dashboard
Hystrix Dashboard是Hystrix的仪表盘组件,主要用来实时监控Hystrix的各项指标信息,通过界面反馈的信息可以快速发现系统中存在的问题. 整合快速体验: pom.xml(这个是F ...
随机推荐
- 【Python3的函数初识】
一.函数 1.什么是函数? 函数是组织好的,可重复使用的,用来实现单一,或相关联功能的代码段. 函数能提高应用的模块性,和代码的重复利用率,可扩展性强. 2.函数的分类 在python中函数分两类:内 ...
- Linux 配置163yum源epel 源
今天一个小伙伴询问博主,想换个163源(阿里源.亚马逊应该都是一样,博主没有一一验证)怎么换!博主当然兴致勃勃的准备好了指点小伙伴...但是,你没猜错,打脸了.而且最后还是和小伙伴一起配置好的,所以就 ...
- Docker三十分钟快速入门(上)
一.背景 最近,Docker技术真是一片火热,它的出现也弥补了虚拟机资源消耗过高的问题,直接让虚拟化技术有了质的飞跃.那么本文我们来聊一聊Docker,和大家一起认识Docker,简单入门Dock ...
- Oracle 存储过程以及存储函数
以下的一些例子是基于scott用户下的emp表的数据,一和二使用的均为in,out参数,最后一个综合练习使用了 in out参数 一.存储过程 1.创建无参的存储过程示例 ------ hello ...
- python 豆瓣采集
新手今天刚学python~~~ 有点凌乱~勉强看吧 只能算是给新手看看,见谅 简单版本的 豆瓣采集美图~~~~~~ 美女天天有 有木有~~~ python 3.4 sqlite3 BeautifulS ...
- HTML知识点总结之div、section标签
div元素 div是块级元素,相当于一个容器,在语义上不代表任何特定类型的内容.主要用作大的框架布局,也就是说网页的骨架主要通过div来架设的,而网页的血肉则是有span.p或者ul等元素完成. se ...
- 如何使用 Q#
Q# 是微软的量子语言,很厉害,所以本文告诉大家如何入门,如何配置. 介绍 很多新的计数机技术都在很多年前就有人提出,量子计算就是其中一个.量子计算在 1980 年就被 Richard Feynman ...
- PHP错误与异常
请一定要注意,没有特殊说明:本例 PHP Version < 7 说起PHP异常处理,大家首先会想到try-catch,那好,我们先看一段程序吧:有一个test.php文件,有一段简单的PHP程 ...
- ionic滑动框 ---轮播图(ion-slide-box) 的使用
1. html : <ion-slide-box auto-play="true" slide-interval=3000 show-pager="false&qu ...
- Lottie的使用
一.简介 Lottie是Airbnb开源的一个面向IOS.Android.React Native的动画库,能分析Adobe After Effects导出的动画,并且能让原生App像使用静态素材一样 ...