Grafana+Prometheus 监控 MySQL
转自:Grafana+Prometheus 监控 MySQL
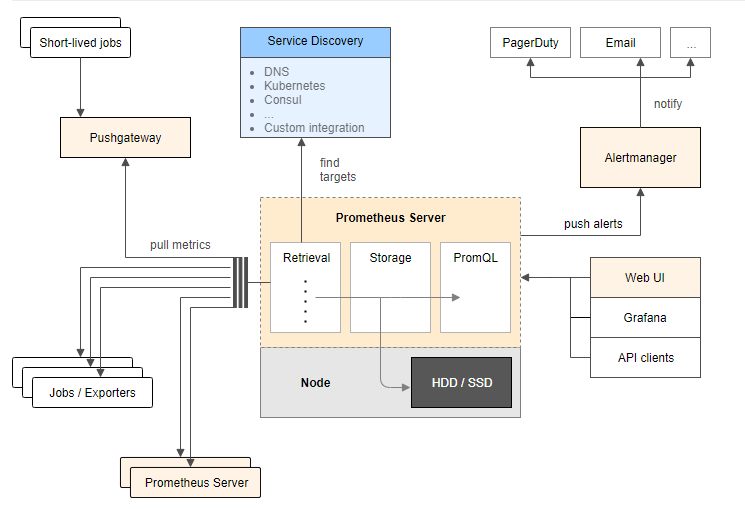
架构图
环境
| IP | 环境 | 需装软件 |
|---|---|---|
| 192.168.0.237 | mysql-5.7.20 | node_exporter-0.15.2.linux-amd64.tar.gz mysqld_exporter-0.10.0.linux-amd64.tar.gz |
| 192.168.0.248 | grafana+prometheus | prometheus-2.1.0.linux-amd64.tar.gz node_exporter-0.15.2.linux-amd64.tar.gz grafana-4.6.3.linux-x64.tar.gz |
在 192.168.0.248 上安装 grafana prometheus
安装 prometheus
# 创建保存软件的目录
mkdir /data/software/ -p
cd /data/software/
# 解压 prometheus
tar xvf prometheus-2.1.0.linux-amd64.tar.gz -C /iba/
cd /iba/
mv prometheus-2.1.0.linux-amd64 prometheus
cd prometheus/
cp prometheus.yml /tmp/prometheus.yml.20181203
# 配置 prometheus.yml
cat prometheus.yml
# my global config
global:
scrape_interval: 15s # Set the scrape interval to every 15 seconds. Default is every 1 minute.
evaluation_interval: 15s # Evaluate rules every 15 seconds. The default is every 1 minute.
# scrape_timeout is set to the global default (10s).
# A scrape configuration containing exactly one endpoint to scrape:
# Here it's Prometheus itself.
scrape_configs:
- job_name: 'Host'
file_sd_configs:
- files:
- host.yml
metrics_path: /metrics
relabel_configs:
- source_labels: [__address__]
regex: (.*)
target_label: instance
replacement: $1
- source_labels: [__address__]
regex: (.*)
target_label: __address__
replacement: $1:9100
- job_name: 'MySQL'
file_sd_configs:
- files:
- mysql.yml
metrics_path: /metrics
relabel_configs:
- source_labels: [__address__]
regex: (.*)
target_label: instance
replacement: $1
- source_labels: [__address__]
regex: (.*)
target_label: __address__
replacement: $1:9104
- job_name: 'prometheus'
static_configs:
- targets:
- localhost:9090
cat host.yml
- labels:
service: test
targets:
- 192.168.0.248
- 192.168.0.237
cat mysql.yml
- labels:
service: test
targets:
- 192.168.0.237
# 测试 prometheus 是否可以正常启动
/iba/prometheus/prometheus --storage.tsdb.retention=30d &
ps -ef|grep prometh
kill -9 14650
# 配置 prometheus.service 文件
vi /usr/lib/systemd/system/prometheus.service
# 内容为
[Unit]
Description=Prometheus instance
Wants=network-online.target
After=network-online.target
[Service]
User=root
Group=root
Type=simple
Restart=on-failure
WorkingDirectory=/iba/prometheus/
RuntimeDirectory=prometheus
RuntimeDirectoryMode=0750
ExecStart=/iba/prometheus/prometheus --storage.tsdb.retention=30d --config.file=/iba/prometheus/prometheus.yml
LimitNOFILE=10000
TimeoutStopSec=20
[Install]
WantedBy=multi-user.target
# 启动 prometheus
systemctl start prometheus
systemctl status prometheus -l
# 开放防火墙
firewall-cmd --permanent --add-rich-rule="rule family="ipv4" source address="192.168.0.0/16" accept"
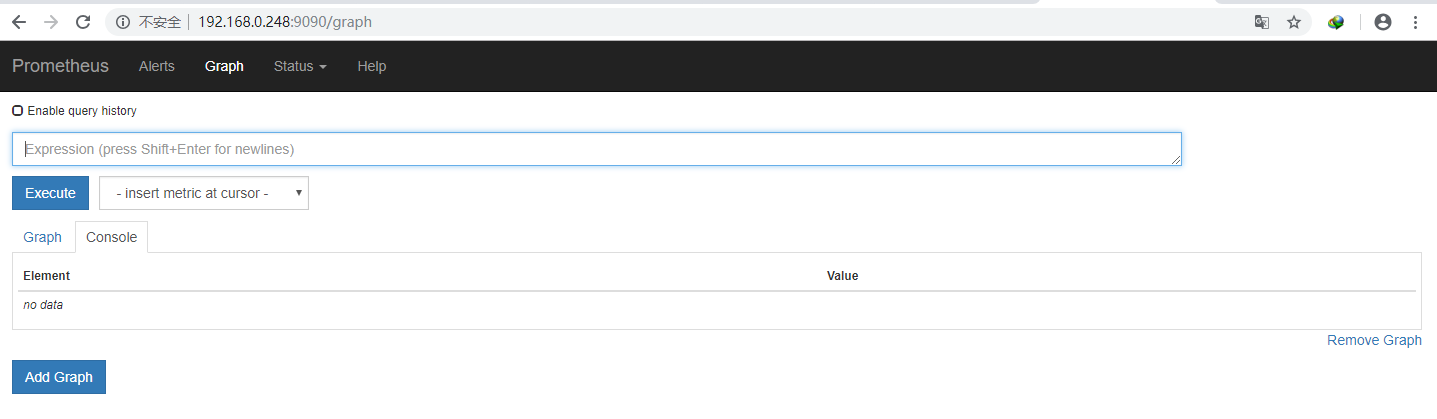
firewall-cmd --reload浏览器输入 http://192.168.0.248:9090 访问
prometheus.yml 文件参考:
https://prometheus.io/docs/prometheus/latest/configuration/configuration/
https://prometheus.io/docs/prometheus/latest/configuration/configuration/#%3Crelabel_config%3E
https://prometheus.io/docs/prometheus/latest/configuration/configuration/#%3Cfile_sd_config%3E
安装 node_exporter 获取主机信息
# 解压 node_exporter

cd /data/software/

tar xf node_exporter-0.15.2.linux-amd64.tar.gz -C /usr/local

mv node_exporter-0.15.2.linux-amd64 node_exporter

nohup ./node_exporter &
安装 grafana
cd /iba/software

# 解压

tar xf grafana-4.6.3.linux-x64.tar.gz -C /iba/prometheus/

cd /iba/prometheus/

mv grafana-4.6.3 grafana

cd grafana/

# 测试

./bin/grafana-server

# 停止

ctrl+c

cat /usr/lib/systemd/system/grafana-server.service

[Unit]

Description=Grafana instance

Documentation=http://docs.grafana.org

Wants=network-online.target

After=network-online.target

[Service]

User=root

Group=root

Type=simple

Restart=on-failure

WorkingDirectory=/iba/prometheus/grafana

RuntimeDirectory=grafana

RuntimeDirectoryMode=0750

ExecStart=/iba/prometheus/grafana/bin/grafana-server

LimitNOFILE=10000

TimeoutStopSec=20

[Install]

WantedBy=multi-user.target

# 启动

systemctl start grafana-server

systemctl status grafana-server -l
访问 http://192.168.0.248:3000,默认用户和密码是 admin/admin

配置数据源


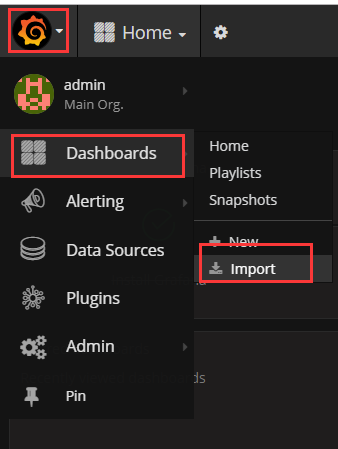
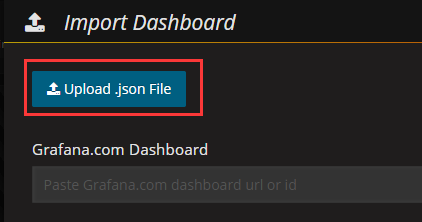
下载 grafana-dashboards-1.6.1.tar.gz,解压,使用浏览器导入 dashboard, 下载地址:https://github.com/percona/grafana-dashboards/archive/v1.6.1.tar.gz

在 192.168.0.237 安装 node_exporter 和 mysqld_exporter
cd /iba/software/

tar zxf node_exporter-0.15.2.linux-amd64.tar.gz -C /usr/local/

cd /usr/local/

mv node_exporter-0.15.2.linux-amd64 node_exporter

# 启动

cd node_exporter/

nohup ./node_exporter &
几分钟后 grafana 出现了新服务器的信息

在mysql上配置监控使用的用户
GRANT REPLICATION CLIENT, PROCESS, SELECT ON *.* TO 'mysql_monitor'@'%' IDENTIFIED BY 'mysql_monitor';

FLUSH PRIVILEGES;
cd /iba/software/
tar zxf mysqld_exporter-0.10.0.linux-amd64.tar.gz -C /usr/local/
cd /usr/local/
mv mysqld_exporter-0.10.0.linux-amd64/ mysqld_exporter
cd mysqld_exporter/
# 在 mysql 上创建一个专门用于监控的用户,
cat .my.cnf
[client]
user=mysql_monitor
password=mysql_monitor
# 启动
nohup /usr/local/mysqld_exporter/mysqld_exporter -config.my-cnf="/usr/local/mysqld_exporter/.my.cnf" &导入 dashboard: MySQL_Overview.json

Grafana+Prometheus 监控 MySQL的更多相关文章
- 使用 Docker 部署 Grafana + Prometheus 监控 MySQL 数据库
一.背景 在平时开发过程当中需要针对 MySQL 数据库进行监控,这里我们可以使用 Grafana 和 Prometheus 来实现监控功能.Grafana 是一款功能强大的仪表盘面板,支持多种数据源 ...
- Grafana+Prometheus监控mysql性能
#cmd /usr/local 今天讲一下如何监控服务器中的mysql数据库的性能 一.数据库操作 1.mysql启动 #service mysqld start #启动数据库 #service my ...
- Prometheus 监控Mysql服务器及Grafana可视化
Prometheus 监控Mysql服务器及Grafana可视化. mysql_exporter:用于收集MySQL性能信息. 使用版本 mysqld_exporter 0.11.0 官方地址 使用文 ...
- Grafan+Prometheus 监控 MySQL
架构图 环境 IP 环境 需装软件 192.168.0.237 mysql-5.7.20 node_exporter-0.15.2.linux-amd64.tar.gz mysqld_exporter ...
- 采用prometheus 监控mysql
1. prometheus 是什么 开源的系统监控和报警工具,监控项目的流量.内存量.负载量等实时数据. 它通过直接或短时jobs中介收集监控数据,在本地存储所有收集到的数据,并且通过定义好的rule ...
- Prometheus 监控MySQL
目录 0.简介 1.mysql_exporter部署 2.mysql报警规则 0.简介 文中主要监控MySQL/MySQL主从信息 版本:mysql-5.7,mysql_exporter-0.12.1 ...
- 手把手教你使用 Prometheus 监控 MySQL 与 MariaDB.md
概述 MySQL 是常用的关系型数据库,MariaDB 作为 MySQL 的分支版本,兼容 MySQL 协议,也越来越流行.在 Kubernetes 环境中如何使用 Prometheus 来对它们进行 ...
- Grafana + Prometheus 监控PostgreSQL
效果图 部署环境 服务器名称 IP地址 部署业务 备注 部署agent sht-sgmhadoopcm-01 172.16.101.54 PostgreSQL 监控服务器.被监控服务器 node_ex ...
- Grafana+Prometheus监控
添加模板一定要看说明以及依赖 监控redis https://blog.52itstyle.com/archives/2049/ http://www.cnblogs.com/sfnz/p/65669 ...
随机推荐
- Java8-Lamda和Stream原理引入
一说明 这边文章主要是带大家为什么会有lamda表达式的出现,流式思想的产生.具体的Lamda表达式操作,Stream流会在后面的文章更新,有兴趣的朋友也可以加一下我微信公众号,分享学习干货. 二ja ...
- 关于腾讯云Centos的一些操作
安装mysql wget http://dev.mysql.com/get/mysql-community-release-el7-5.noarch.rpm rpm -ivh mysql-commun ...
- Python--合并2个字典成1个新字典的9种方法
d1 = {'name': 'revotu', 'age': 99} d2 = {'age': 24, 'sex': 'male'} 输出: {'name': 'revotu', 'age': 24, ...
- iOS---OBJC_ASSOCIATION_ASSIGN可能引起的Crash
//OBJC_ASSOCIATION_ASSIGN类似于我们常用的assign,assign策略的特点就是在对象释放以后,不会主动将应用的对象置为nil,这样会有访问僵尸对象导致应用崩溃的风险.为了解 ...
- webpack 插件 ProvidePlugin 的使用方法和 eslint 配置
ProvidePlugin:自动加载模块,而不必到处 import 或 require .(点击查看官方文档) 使用方法: 配置 webpack.config.js文件里 plugins 属性 new ...
- 【Linux 命令】cp 命令详解
Linux 命令之 cp 命令详解 一.cp 命令简介 cp 命令主要用于复制文件或目录.即用来将一个或多个源文件或者目录复制到指定的目的文件或目录. cp 命令可以将单个源文件复制成一个指定文件名的 ...
- threejs 限制物件只能在指定平面上拖拽
threejs提供有 DragController.js的例子来辅助拖拽 该例子可以在基于当前屏幕的x和y轴上拖拽物体,但是它不能影响z轴. 查看代码,可以在touchStart\mousedown下 ...
- webpack4 配置
package.json 开发环境/生产环境 webpack.config.js
- Java程序员月薪三万,需要技术达到什么水平?
最近跟朋友在一起聚会的时候,提了一个问题,说 Java 程序员如何能月薪达到二万,技术水平需要达到什么程度?人回答说这只能是大企业或者互联网企业工程师才能拿到.也许是的,小公司或者非互联网企业拿二万的 ...
- js 淡入淡出的tab选项卡
代码如下 <!DOCTYPE html> <html> <head lang="en"> <meta charset="UTF- ...