Hystrix之Dashboard的常见问题
Hystrix Dashboard (断路器:Hystrix 仪表盘)只监控一个实例,而Turbine监控多个实例,要使用Turbine必须使用Hystrix,因为Turbine是为了监控断路器的状态产生的。turbine.stream来聚合hystrix.stream端点。
1、Dashboard的实质是将微服务访问的API来显示出来,所以只有访问了服务接口,Dashboard上面才会出现数据,否则是不出现的。
ribbon和feign中如何使用dashboard:
参考如下连接:http://blog.csdn.net/seapeak007/article/details/77261729
2、在使用feign整合dashboard的时候,注意:Feign整合了Hystrix,但是我们还是需要添加Hystrix的依赖。
另外,在使用监控的时候,网络要好!否则根本不行!
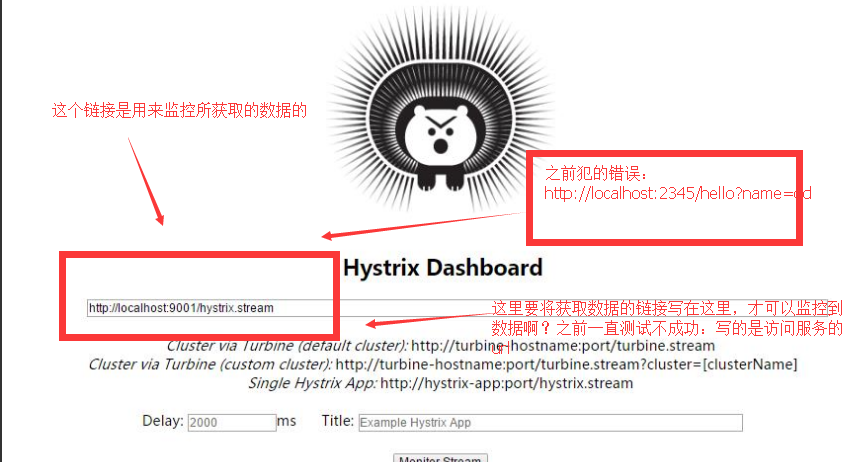
这里重点看下访问dashboard界面的url:
博客:
https://www.cnblogs.com/wangjing666/p/7049985.html
(1)查看数据:
http://localhost:2345/hystrix.stream
(2)查看dashboard:
http://localhost:2345/hystrix
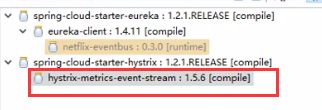
默认是上面红框的依赖,我们需要添加springcloud的Hystrix的依赖。

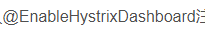
另外需要在启动类上面添加启动Hystrix的注解。
3、需要启动Hystix需要添加监控依赖:
<dependency>
<groupId>org.springframework.boot</groupId>
<artifactId>spring-boot-starter-actuator</artifactId>
</dependency>
4、Turbine(特本)的出现的原因:
生产环境中服务往往是集群部署的,我们需要监控多个服务,Turbine可以做一些监控数据的聚合,监控多个服务。
作用:汇总系统内多个服务的数据并显示到 Hystrix Dashboard 上。
Turbine的使用:

写一个Turbine的服务类,注册到Eureka上去,
在此服务中加入依赖,加入注解,配置需要监控的实例。

老版本的坑:

5、几个概念
hystrix.stream出现:
在引入spring-boot-starter-actuator依赖后,Spring Boot应用会暴露出/hystrix.stream端点以供监控工具读取该应用的Hystrix Metrics数据。
有个actuator的文章:http://blog.csdn.net/neosmith/article/details/70800663

这里监控有数据之后,我们就可以在dashboard上面看到波动。
spring-boot-starter-actuator的作用:在生产环境中,需要实时或定期监控服务的可用性。spring-boot 的actuator(监控)功能提供了很多监控所需的接口。所以说actuator即只要有监控就要使用这个依赖。http://blog.csdn.net/clementad/article/details/52045495
Turbine的使用:
创建一个单独的服务,然后添加依赖:添加注解,turbine需要注册到Eureka上面去,因为它要监控多个服务端点。
依赖:
<?xml version="1.0" encoding="UTF-8"?>

<project xmlns="http://maven.apache.org/POM/4.0.0" xmlns:xsi="http://www.w3.org/2001/XMLSchema-instance"

		 xsi:schemaLocation="http://maven.apache.org/POM/4.0.0 http://maven.apache.org/xsd/maven-4.0.0.xsd">

	<modelVersion>4.0.0</modelVersion>

	<groupId>com.springcloud.learning</groupId>

	<artifactId>hystrix-turbine</artifactId>

	<version>0.0.1-SNAPSHOT</version>

	<packaging>jar</packaging>

	<name>hystrix-turbine</name>

	<description>Demo project for Spring Boot</description>

	<parent>

		<groupId>org.springframework.boot</groupId>

		<artifactId>spring-boot-starter-parent</artifactId>

		<version>1.5.10.RELEASE</version>

		<relativePath/> <!-- lookup parent from repository -->

	</parent>

	<properties>

		<project.build.sourceEncoding>UTF-8</project.build.sourceEncoding>

		<project.reporting.outputEncoding>UTF-8</project.reporting.outputEncoding>

		<java.version>1.8</java.version>

		<spring-cloud.version>Edgware.SR1</spring-cloud.version>

	</properties>

	<dependencies>

		<dependency>

			<groupId>org.springframework.cloud</groupId>

			<artifactId>spring-cloud-starter-eureka</artifactId>

		</dependency>

		<dependency>

			<groupId>org.springframework.boot</groupId>

			<artifactId>spring-boot-starter-web</artifactId>

		</dependency>

		<dependency>

			<groupId>org.springframework.boot</groupId>

			<artifactId>spring-boot-starter-actuator</artifactId>

		</dependency>

		<dependency>

			<groupId>org.springframework.cloud</groupId>

			<artifactId>spring-cloud-starter-hystrix</artifactId>

		</dependency>

		<dependency>

			<groupId>org.springframework.cloud</groupId>

			<artifactId>spring-cloud-starter-hystrix-dashboard</artifactId>

		</dependency>

		<dependency>

			<groupId>org.springframework.cloud</groupId>

			<artifactId>spring-cloud-starter-turbine</artifactId>

		</dependency>

		<dependency>

			<groupId>org.springframework.boot</groupId>

			<artifactId>spring-boot-starter-test</artifactId>

			<scope>test</scope>

		</dependency>

	</dependencies>

	<dependencyManagement>

		<dependencies>

			<dependency>

				<groupId>org.springframework.cloud</groupId>

				<artifactId>spring-cloud-dependencies</artifactId>

				<version>${spring-cloud.version}</version>

				<type>pom</type>

				<scope>import</scope>

			</dependency>

		</dependencies>

	</dependencyManagement>

	<build>

		<plugins>

			<plugin>

				<groupId>org.springframework.boot</groupId>

				<artifactId>spring-boot-maven-plugin</artifactId>

			</plugin>

		</plugins>

	</build>

</project>
注解:

如何监控服务呢?
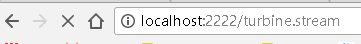
1、首先查看是否有数据:查看turbine端口是否有数据?
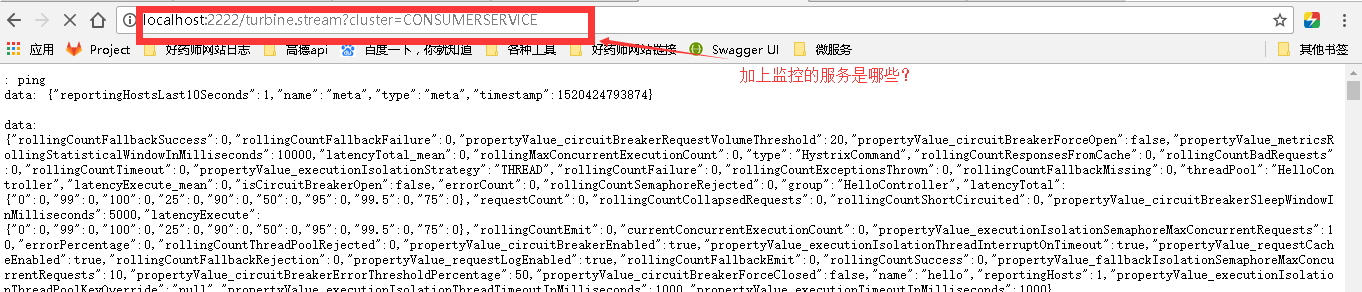
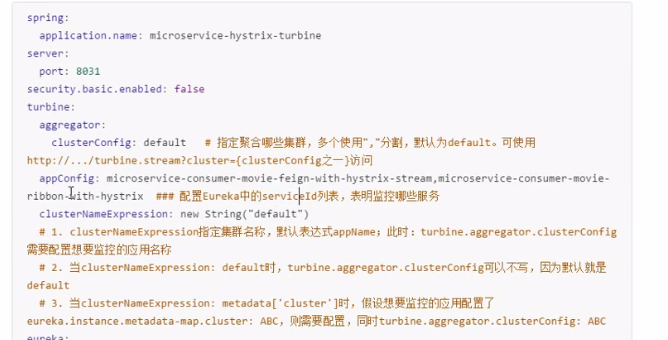
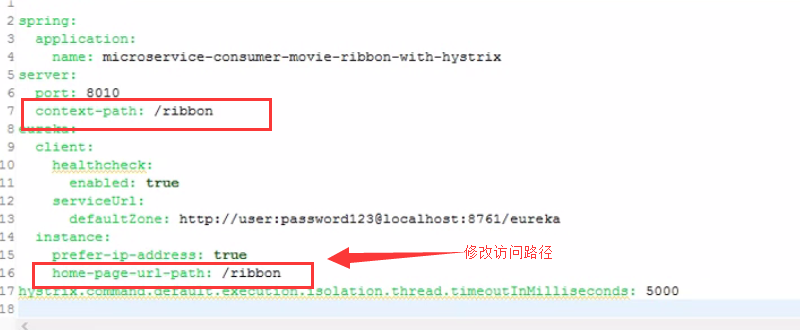
根据上面在配置文件中的配置添加配置即可,配置监控服务的名称

2、在所监控的服务路径上面查看hystrix的dashboard上面查看服务状况

结果:

如何监控多个服务呢?
配置文件:

测试:这个时候监控数据的链接已经改变:
注意这里不加后面的服务名称了,因为上面配置默认了,是由多个服务列表。
查看界面图:
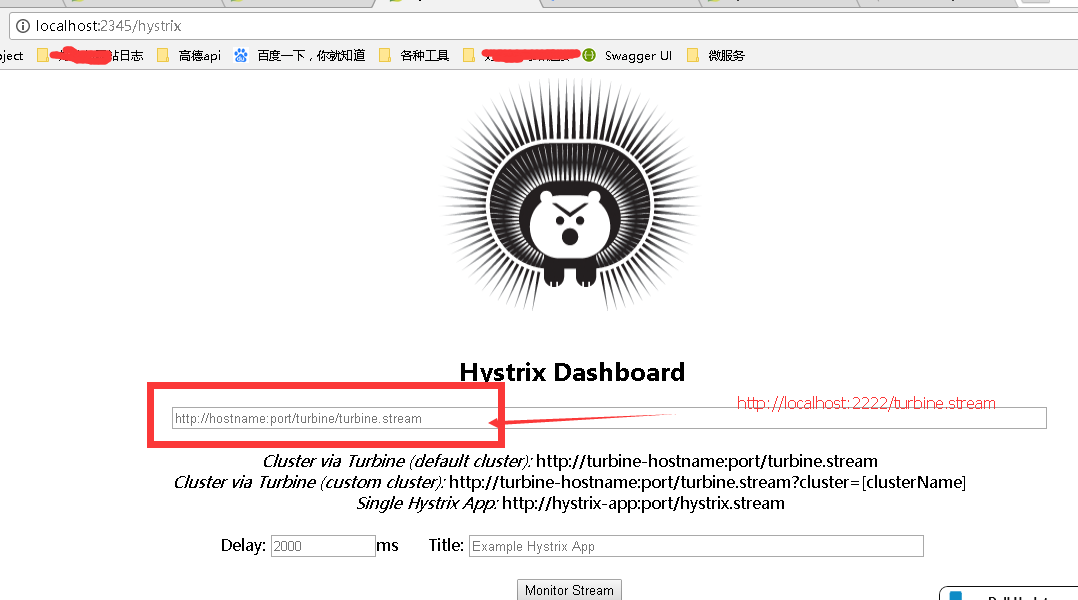
结果:

Hystrix之Dashboard的常见问题的更多相关文章
- 微服务熔断限流Hystrix之Dashboard
简介 Hystrix Dashboard是一款针对Hystrix进行实时监控的工具,通过Hystrix Dashboard可以直观地看到各Hystrix Command的请求响应时间,请求成功率等数据 ...
- hystrix的dashboard和turbine监控
当我们的应用程序使用了hystrix后,每个具体的hystrixCommand命令执行后都会产生一堆的监控数据,比如:成功数,失败数,超时数以及与之关联的线程池信息等.既然有了这些监控数据数据,那么我 ...
- spring cloud: Hystrix(七):Hystrix的断容器监控dashboard
Hystrix的断容器监控dashboard. dashboard是用来监控Hystrix的断容器监控的,图形化dashboard是如何实现指标的收集展示的. dashboard 本地端口8730 项 ...
- 服务容错保护断路器Hystrix之三:断路器监控(Hystrix Dashboard)-单体监控
turbine:英 [ˈtɜ:baɪn] 美 [ˈtɜ:rbaɪn] n.汽轮机;涡轮机;透平机 一.Hystrix Dashboard简介 在微服务架构中为了保证程序的可用性,防止程序出错导致网络阻 ...
- Spring Cloud第六篇 | Hystrix仪表盘监控Hystrix Dashboard
本文是Spring Cloud专栏的第六篇文章,了解前五篇文章内容有助于更好的理解本文: Spring Cloud第一篇 | Spring Cloud前言及其常用组件介绍概览 Spring Cloud ...
- timeout超时时长优化和hystrix dashboard可视化分布式系统
在生产环境中部署一个短路器,一开始需要将一些关键配置设置的大一些,比如timeout超时时长,线程池大小,或信号量容量 然后逐渐优化这些配置,直到在一个生产系统中运作良好 (1)一开始先不要设置tim ...
- Spring Cloud Hystrix Dashboard的使用 5.1.3
Hystrix除了可以对不可用的服务进行断路隔离外,还能够对服务进行实时监控.Hystrix可以实时.累加地记录所有关于HystrixCommand的执行信息,包括每秒执行多少.请求成功多少.失败 ...
- 开启turbine收集hystrix指标功能
使用turbine收集hystrix指标 1.pom中引入对turbin的依赖,并增加dashboard图形界面的展示 <dependencies> <dependency> ...
- spring boot 2.0.3+spring cloud (Finchley)4、熔断器Hystrix
在分布式系统中服务与服务之间的依赖错综复杂,一种不可避免的情况就是某些服务会出现故障,导致依赖于他们的其他服务出现远程调度的线程阻塞.某个服务的单个点的请求故障会导致用户的请求处于阻塞状态,最终的结果 ...
随机推荐
- can总线实现stm32的IAP
使用stm32f105rct6的can通信做IAP,实现固件的远程更新功能.IAP的实现包括两个程序:BootLoader和应用程序.启动过程先启动BootLoader,等待1s,若接收到烧写指令则开 ...
- 20145214 《网络对抗技术》 Web基础
20145214 <网络对抗技术> Web基础 1.实验后回答问题 (1)什么是表单 表单在网页中主要负责数据采集,提供了填写数据.选择数据,收集数据并提交给后台的功能 一个表单有三个基本 ...
- iOS开发学习-NSUserDefaults的介绍和用法
NSUserDefaults类提供了一个与默认系统进行交互的编程接口.NSUserDefaults对象是用来保存,恢复应用程序相关的偏好设置,配置数据等等.默认系统允许应用程序自定义它的行为去迎合用户 ...
- golang 反射
参考:|--http://blog.51cto.com/speakingbaicai/1707637 |--https://studygolang.com/articles/6324 反射是在gola ...
- 树莓派与Arduino Leonardo使用NRF24L01无线模块通信之基于RF24库 (二) 发送自定义数据
在我的项目里,树莓派主要作为中心节点,用于接收数据,Arduino作为子节点,用于发送数据,考虑到以后会有很多子节点,但又不至于使得代码过于繁琐,因此所有的传输数据添加一个头部编号用于区分不同节点. ...
- PROFIBUS-DP现场总线的结构及应用
PROFIBUS的最大优点在于具有稳定的国际标准EN50170作保证,并经实际应用验证具有普遍性.目前已广泛应用于制造业自动化.流程工业自动化和楼宇.交通电力等领域. PROFIBUS由3个兼容部分组 ...
- OSG学习:裁剪变换(1)
在OSG中,默认了6个裁剪平面以去除没有必要显示的物体.也可以自己定义其他的裁剪平面来确定裁剪. osg::ClipPlane类继承自osg::StateAttribute类,封装了OpenGL中的g ...
- JabRef学习笔记(一)
JabRef简介 JabRef is an open source bibliography reference manager. The native file format used by Jab ...
- 第九周(11.11-11.17)----Beta版本发布140字评论
1.新蜂组: 俄罗斯方块:项目有良好的用户界面,在原版的基础上可以对用户分数进行排序,增加了显示下一个方块的功能.是个很有趣的小游戏. 2.天天向上组: 连连看:完成了基本功能,增加了消除时和鼠标点击 ...
- webservice(二)简单实例
1.建立WSDL文件 建立WSDL的工具很多,eclipse.zendstudio.vs都可以,我个人建议自己写,熟悉结构,另外自动工具对xml schame类型支持在类型中可能会报错. 下 ...