Linear regression with one variable - Cost function
摘要: 本文是吴恩达 (Andrew Ng)老师《机器学习》课程,第二章《单变量线性回归》中第7课时《代价函数》的视频原文字幕。为本人在视频学习过程中逐字逐句记录下来以便日后查阅使用。现分享给大家。如有错误,欢迎大家批评指正,在此表示诚挚地感谢!同时希望对大家的学习能有所帮助。
In this video (article), we'll define something called the cost function. This will let us figure out how to fit the best possible straight line to our data.
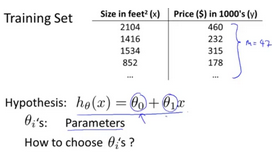
In linear regression we have a training set like that shown here. Remember our notation M was the number of training examples, so maybe M=47. And the form of hypothesis, which we use to make prediction, is this linear function. To introduce a little bit more terminology, this and
, these
are what I call the parameters of the model. What we are going to do in this video (article) is talk about how to go about choosing these two parameter values,
and
.
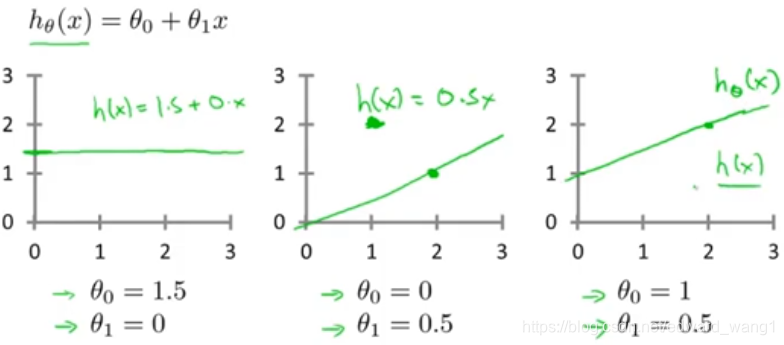
With different choices of parameters and
we get different hypotheses, different hypothesis functions. I know some of you will probably be already familiar with what I'm going to do on this slide, but just to review here are a few examples. If
and
, then the hypothesis function will look like this. Right, because your hypothesis function will be
, this is flat at 1.5. If
and
, then the hypothesis will look like this. And this should pass through this point (2,1), says you now have
which looks like that. And if
and
, then we end up with the hypothesis that looks like this. Let's see, it should pass through the
point like so. And this is my new
. All right, well you remember that this is
but as a shorthand, sometimes I just write this as
.
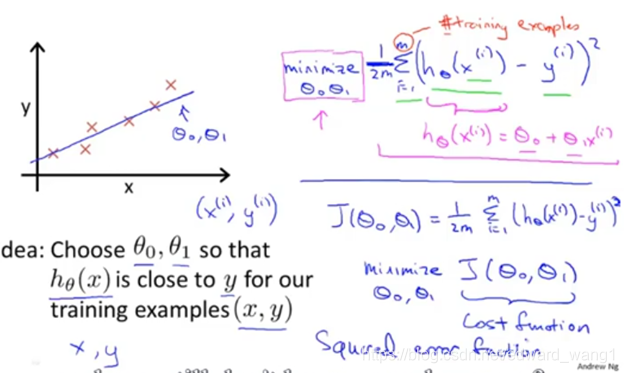
In linear regression we have a training set like maybe the one I've plotted here. What we want to do is come up with values for the parameters and
. So that the straight line we get out of this corresponds to a straight line that somehow fits the data well. Like maybe the line over there. So how do we come up with values
,
that corresponds to a good fit to the data? The idea is we're going to choose our parameters
and
so that
, meaning the value we predict on input x, that is at least close to the values y for the examples in our training set. So, in our training set we're given a number of examples where we know x decides the house and we know the actual price of what it's sold for. So, let's try to choose values for the parameters so that at least in the training set, given the x's in the training set, we make reasonably accurate predictions for the y values. Let's formalize this. So linear regression, what we're going to do is that I'm going to want to solve a minimization problem. So, I'm going to write minimize over
,
. And, I want this to be small, right, I want the difference between
and y to be small. And one thing I might do is try to minimize the square difference between the output of the hypothesis and the actual price of the house. Okay? So, let's fill in some details. Remember that I was using the notation
to represent the
training example. So, what I want really is to sum over my training set. Sum from i to M of the square difference between the prediction of my hypothesis when it is input the size of the house number i, minus the actual price that house number i was sold for and I want to minimize the sum of my training set sum from i equals 1 through M of the difference of this squared error, square difference between the predicted price of the house and the price that was actually sold for. And just remind you of your notation M here was the size of my training set, right, so the M there is my number of training examples, right? That hash sign is the abbreviation for "number" of training examples. Okay? And to make the math a little bit easier, I'm going to actually look at, you know,
times that. So, we're going to try to minimize my average error, which we're going to minimize
. Putting the 2, the constant one half, in front it just makes some of the math a little easier. So, minimizing one half of something, right, should give you the same values of the parameters
,
as minimizing that function. And just make sure this equation is clear, right? This expression in here,
, this is our usual, right? That's equal to
. And, this notation, minimize over
and
, this means find me the values of theta zero and theta one that causes this expression to be minimized. And this expression depends on
and
. Okay? So just to recap, we're posing this problem as find me the values of
and
so that the average already one over two M times the sum of square errors between my predictions on the training set minus the actual values of the houses on the training set is minimized. So, this is going to be my overall objective function for linear regression. And just to, you know rewrite this out a little bit more cleanly, what I'm going to do by convention is we usually define a cost function. Which is going to be exactly this. That formula that I have up here. And what I want to do is minimize over
and
my function
. Just write this out, this is my cost function. So, this cost function is also called the squared error function or sometimes called the square error cost function and it turns out that why do we take the square of the errors? It turns out the squared error cost function is reasonable choice and will work well for most problems, for most regression problems. There are other cost functions that will work pretty well, but the squared error cost function is probably the most common used one for regression problems. Later in this class we'll also talk about alternative cost functions as well, but this choice that we just had should be a pretty reasonable thing to try for most linear regression problems. Okay, so, that's the cost function. So far we've just seen a mathematical definition of, you know, the cost function and in case this function
seems a little bit abstract and you still don't have a good sense of what it's doing, in the next couple of videos (articles) we're actually going to go a little bit deeper into what the cost function J is doing and try to give you better intuition about what it's computing and why we want to use it.
<end>
Linear regression with one variable - Cost function的更多相关文章
- Linear regression with one variable - Cost function intuition I
摘要: 本文是吴恩达 (Andrew Ng)老师<机器学习>课程,第二章<单变量线性回归>中第8课时<代价函数的直观认识 - 1>的视频原文字幕.为本人在视频学习过 ...
- Stanford机器学习---第二讲. 多变量线性回归 Linear Regression with multiple variable
原文:http://blog.csdn.net/abcjennifer/article/details/7700772 本栏目(Machine learning)包括单参数的线性回归.多参数的线性回归 ...
- Stanford机器学习---第一讲. Linear Regression with one variable
原文:http://blog.csdn.net/abcjennifer/article/details/7691571 本栏目(Machine learning)包括单参数的线性回归.多参数的线性回归 ...
- 机器学习笔记1——Linear Regression with One Variable
Linear Regression with One Variable Model Representation Recall that in *regression problems*, we ar ...
- Machine Learning 学习笔记2 - linear regression with one variable(单变量线性回归)
一.Model representation(模型表示) 1.1 训练集 由训练样例(training example)组成的集合就是训练集(training set), 如下图所示, 其中(x,y) ...
- MachineLearning ---- lesson 2 Linear Regression with One Variable
Linear Regression with One Variable model Representation 以上篇博文中的房价预测为例,从图中依次来看,m表示训练集的大小,此处即房价样本数量:x ...
- 机器学习 (一) 单变量线性回归 Linear Regression with One Variable
文章内容均来自斯坦福大学的Andrew Ng教授讲解的Machine Learning课程,本文是针对该课程的个人学习笔记,如有疏漏,请以原课程所讲述内容为准.感谢博主Rachel Zhang的个人笔 ...
- Lecture0 -- Introduction&&Linear Regression with One Variable
Introduction What is machine learning? Tom Mitchell provides a more modern definition: "A compu ...
- machine learning (2)-linear regression with one variable
machine learning- linear regression with one variable(2) Linear regression with one variable = univa ...
随机推荐
- Codeforces Round #555 (Div. 3) C1,C2【补题】
D1:思路:L,R指针移动,每次选最小的即可. #include<bits/stdc++.h> using namespace std; #define int long long #de ...
- PHP流程控制之嵌套if...else...elseif结构
还记得本章开篇我们讲了一个王思总同学的例子: 王同学是生活极度充满娱乐化和享受生活的人.他抵达北京或者大连的时候做的事,他抵达后做的事情,如下:直线电机参数 半夜到达,先去夜店参加假面舞会 早上抵达, ...
- kalilinux MSF数据库的连接
需要自动连接数据库.如下设置.
- QShareMemory
Qt提供了一种安全的共享内存的实现QSharedMemory,以便在多线程和多进程编程中安全的使用.比如说QQ的聊天的客户端,这里有个个性头象,当点击QQ音乐播放器的时候,启动QQ音乐播放器(启动一Q ...
- 国外最受欢迎的BT-磁力网站
1.海盗湾 The Pirate Bay 2.KickAssTorrents 3.Torrentz 4.zooqle 5.SumoTorrent 6.TorrentDownloads 7.Rarbg ...
- epoll事件模型
事件模型 EPOLL事件有两种模型: Edge Triggered (ET) 边缘触发只有数据到来才触发,不管缓存区中是否还有数据. Level Triggered (LT) 水平触发只要有数据都会触 ...
- yum安装错误记录
原因:使用yum安装libvirt以后,后续没有使用yum -remove 包名去移除这个包,接着使用源码安装了libvirt服务,当我卸载源码安装的libvirt以后,通过yum重新安装libvir ...
- C语言应用--数据类型定制一结构体数组
结构体定义成功后,其实和c语言内部的类型区别也不大了,自然可以用来定义结构体类型的数组了.我们根据结构体定义的方式不同,分别用多种方式定义结构体数组:
- 感知机模型到DNN模型
参考资料 感知机模型:https://www.cnblogs.com/pinard/p/6042320.html DNN:https://www.cnblogs.com/pinard/p/641866 ...
- libmidas.so.2
libmidas.so.2 libmidas.so.2文件,使DATASNAP FOR LINUX中间件,支持OleVariant格式的序列,使TDataSetProvider+TClientData ...