Test Design Techniques - STATE BASED TESTING
Test Design Techniques - STATE BASED TESTING
-Test note of “Essential Software Test Design”
2015-08-19
Content:
13.1 The Model
13.1.1 The ATM Machine
13.2 Creating Base Test Cases
13.2.1 Ways of Covering the Graph
13.2.2 Coverage According to Chow
13.2.3 Creating Test Cases
13.2.4 Transition Pairs
13.2.4.1 Expanding the Table by one Column
13.2.4.2 Creating a Dual Graph
13.2.5 Transition Triples and More
A STATE GRAPH, or state transition testing, is a model-based technique for compiling test cases. It works with event-driven systems, often in real time, and is common in areas like digital technology and electronics in hardware.
13.1 The Model
2 type:
- Mealy Graphs, where the state is represented by nodes and the links between the nodes represent transitions.
- Moore Graphs, where the events are represented by nodes.
Mealy Graphs are simpler to work with since they:
- More closely resemble what happens on their actual implementation
- Have fewer states, and since;
- The states are stable
- You can repeat events more easily without the graph becoming more complex
We call the states nodes, and call connections between the nodes links.
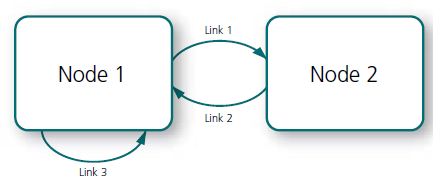
Figure 13.1: State Graphs consist of nodes and links. An arc is also called a transition. Links which start and end at the same node denote that an event does not lead to a transition, but it still undergoes some form of process.
Steps compile a graph:
- Compile the different states an object can find itself in
- Compile the transitions between the different states
- Identify the events which cause a transition to occur
- Define what happens during each transition
13.1.1 The ATM Machine
1. The different states are as follows:
a) Standby – nobody has inserted a card into the machine yet
b) Card inserted, request for PIN
c) PIN accepted – waiting for transaction
2. Draw arrows for the transitions according to the function descriptions
3. Events causing transition are:
a) Insert card
b) Enter correct PIN
c) Enter incorrect PIN
d) Enter correct transaction
e) Enter incorrect transaction
f) Choose to abort
4. What is carried out during transition is:
a) Request new PIN
b) Request new card
c) Request transaction
d) Eject money, card and receipt (execute transaction)
You have now created the picture below and the difficult work is complete.
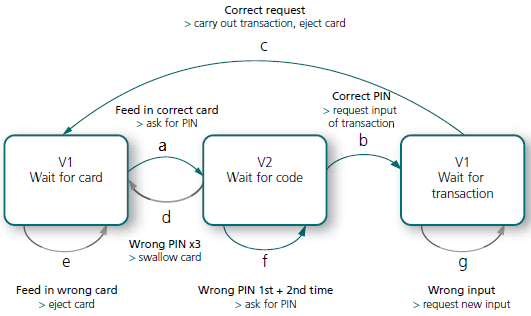
Figure 13.2: Very simple state graph for an ATM. In reality, there are more states and events that are interesting to test and should be present in a complete graph.
13.2 Creating Base Test Cases
13.2.1 Ways of Covering the Graph
There are a number of variants of how to fill in the graph you have drawn up, besides the one described above. Some of them are:
- Typical routes. The most credible combinations
- The travelling salesman’s route. All different states in one test case.
- The Chinese Postman’s route. All transitions in the same test case, if there is that possibility.
- Risk-based. Routes where you think that a particular combination of transitions can cause problems.
- All routes a certain length. From shortest to longest until you have covered all combinations. This is suited to automation, since it repeats many combinations and takes a long time to carry out.
- All ways of leaving a state. For example, via a menu, function key, hot key, button and so on.
- All events which should not produce a transition. Verifies the system’s robustness.
13.2.2 Coverage According to Chow
One method is to cover, firstly, all transitions, then all transitions pairs, triples etc. This was originally presented by Chow.
When you generate the test cases, there are different levels in the degree of coverage. Covering every individual transition is often called Chow’s 0-switch coverage. This can be visualized in a simple table.
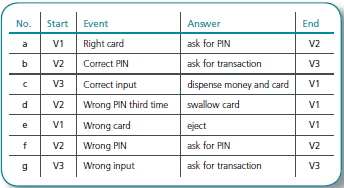
Figure 13.3: Table of the different transitions in the state graph for the ATM. The simplest form of test coverage is to test all the rows in the table.
13.2.3 Creating Test Cases
The next step is to generate the test cases and, in parallel with this, mark off the transitions you are covering.
Test Case 1 (transitions a, f, b, g and c are covered)
- Insert right card (a)
- Enter wrong PIN (f)
- Enter correct PIN (b)
- Enter wrong input (g)
- Enter correct input (c)
- Take eject money, card and receipt
Test Case 2 (transition e is covered)
- Insert wrong card (e)
- Take ejected card
Test Case 3 (transition a, f, d is covered)
- Insert right card (a)
- Enter wrong code (f)
- Enter wrong code (f)
- Enter wrong code (d)
- Card is swallowed and you are back at the starting point
13.2.4 Transition Pairs
In order to achieve better coverage, you can use what we call transition pairs, involving two transitions in a row. The idea is that the result of an event in the system depends on what has happened in the preceding event. Sometimes, you will see the term 1-switch coverage.
13.2.4.1 Expanding the Table by one Column
There are two different ways of solving this, the first being to start with the first table and adding one additional column.
Analysis of our ATM produces the following 16 links:
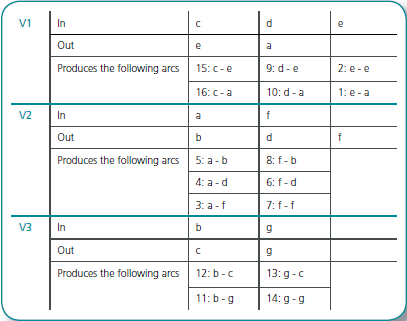
Figure 13.5: Table showing development of transition pairs for the state graph ATM. We obtain all pairs by combining all routes into a node with all routes out of it. Even self-transactions, where we stay on the same node after transition, are counted.
The consolidated table is below, but columns showing event/answer have been taken out in order to simplify the table
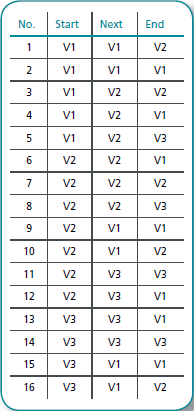
Figure 13.6: Consolidated table of transition pairs for ATM state graph. A more accurate form of coverage is to test all combinations of two transitions. Obviously, this requires more test cases.
13.2.4.2 Creating a Dual Graph
You can also generate a dual graph, where the transitions represented earlier by links are substituted by nodes: in other words, a Moore graph. This way of testing all paired transitions is called the de Bruijn algorithm. To generate a dual graph, you do the following:
- Generate a graph where the links in the original have been changed to nodes.
- Everywhere in the original graph where arc 1 comes into a node, and arc 2 goes out of it, draw an arc between node 1 and node 2. Every arc will now represent a transition pair.
- Cover all links now with test cases.

Figure 13.7: Original and dual graph for the ATM. An alternative to developing the table of transition pairs is to create a Moore graph, where each transition represents a transition pair in the Mealy graph.
13.2.5 Transition Triples and More
You can proceed to more stringent requirements by setting up transition triples and quadruples, by adding another column in the table of transition pairs. The problem is that the number of test cases grows very quickly, so it is often difficult to test all of the pairs without automating the tests. It is common to use at least transition pairs and, if you find many defects, to press on, with more advanced tests in certain areas.
Test Design Techniques - STATE BASED TESTING的更多相关文章
- TEST DESIGN TECHNIQUES: AN OVERVIEW
TEST DESIGN TECHNIQUES: AN OVERVIEW -Test note of “Essential Software Test Design” 2015-11-16 目录: 7. ...
- Spock - Document -04- Interaction Based Testing
Interaction Based Testing Peter Niederwieser, The Spock Framework TeamVersion 1.1 Interaction-based ...
- paper:synthesizable finite state machine design techniques using the new systemverilog 3.0 enhancements 之 FSM Coding Goals
1.the fsm coding style should be easily modifiable to change state encoding and FSM styles. FSM 的的 状 ...
- paper:synthesizable finit state machine design techniques using the new systemverilog 3.0 enhancements之onehot coding styles(index-parameter style with registered outputs)
case语句中,对于state/next 矢量仅仅做了1-bit比较. parameter 值不是表示FSM的状态编码,而是表示state/next变量的索引.
- paper:synthesizable finite state machine design techniques using the new systemverilog 3.0 enhancements 之 standard verilog FSM conding styles(二段式)
1.Two always block style with combinational outputs(Good Style) 对应的代码如下: 2段式总结: (1)the combinational ...
- paper:synthesizable finit state machine design techniques using the new systemverilog 3.0 enhancements之fsm summary
主要是1.不要用1段式写FSM 2.不要用状态编码写one-hot FSM ,要用索引编码写one-hot FSM.
- paper:synthesizable finit state machine design techniques using the new systemverilog 3.0 enhancements之全0/1/z/x的SV写法
- paper:synthesizable finit state machine design techniques using the new systemverilog 3.0 enhancements之enhanced coding styles
1.ANSI style 的代码比较紧凑. 下面规范推荐,比较好. 下面是带有parameter的module header的完整规范 一般1bit ,大家都是wire signal1 = gen_s ...
- paper:synthesizable finit state machine design techniques using the new systemverilog 3.0 enhancements之fsm1各种style的timing/area比较
整体说,一般还是用2段式,再加上output encodecd/default -X技巧.
随机推荐
- Linux学习之常用文件处理命令(一)
(一)文件命名规则 (二)常用文件处理命令 1.ls命令 2.cd命令 3.pwd命令 4.mkdir命令 5.touch命令 6.cp命令 7.mv命令 8.rm命令 9.cat命令 10.more ...
- 条件随机场之CRF++源码详解-预测
这篇文章主要讲解CRF++实现预测的过程,预测的算法以及代码实现相对来说比较简单,所以这篇文章理解起来也会比上一篇条件随机场训练的内容要容易. 预测 上一篇条件随机场训练的源码详解中,有一个地方并没有 ...
- android monitor 汉化 ddms
作者:韩梦飞沙 Author:han_meng_fei_sha 邮箱:313134555@qq.com E-mail: 313134555 @qq.com android.jar\com\androi ...
- Cocos2d-X开发教程-捕鱼达人 Cocos2-x development tutorial - fishing talent
Cocos2d-X开发教程-捕鱼达人 Cocos2-x development tutorial - fishing talent 作者:韩梦飞沙 Author:han_meng_fei_sha 邮箱 ...
- C#中如何把int转换成两个字符的string
部门新开了项目,所以一整周的时间都在瞎忙,为什么称瞎忙?所负责的内容,并没有做好,也是一万个心塞啊.... 说一下最近碰到的一些问题. 用到了计时,但是比如定时是一分半钟,可是显示的时候,想让显示为1 ...
- apache hive 1.0.0发布
直接从0.14升级到1.0.0,主要变化有: 去掉hiveserver 1 定义公共的API,比如HiveMetaStoreClient 当然,也需要使用新的beeline cli客户端. 不过最值得 ...
- java内部类(三)
内部类之方法内部类 方法内部类就是内部类定义在外部类方法中,方法内部类只在该方法内部可见,即只在该方法内部使用. 注意:由于方法内部类不能在外部类的方法以外的地方使用,因此方法内部类不能使用访问控制符 ...
- RxJava2学习笔记(2)
上一篇已经熟悉了Observable的基本用法,但是如果仅仅只是“生产-消费”的模型,这就体现不出优势了,java有100种办法可以玩这个:) 一.更简单的多线程 正常情况下,生产者与消费者都在同一个 ...
- [Android Pro] AndroidX了解一下
cp : https://blog.csdn.net/qq_17766199/article/details/81433706 1.说明 官方原文如下: We hope the division be ...
- Windows下Phalcon的安装以及phpstorm识别phalcon语法及提示
1.由于Phalcon是C语言写的一个扩展,所以需要安装这个扩展php_phalcon.dll,下载地址https://github.com/phalcon/cphalcon/releases, 然后 ...