Python xlwt数据保存到 Excel中以及xlrd读取excel文件画图
1.方法一:xlwt
1.1 安装包
pip install xlwt
1.2 保存数据到 Excel
import xlwt
import numpy as np
import random
# 新建表格
book = xlwt.Workbook(encoding='utf-8', style_compression=0)
sheet = book.add_sheet('mysheet', cell_overwrite_ok=True) #设置多个sheet
# 往第一行写入名称
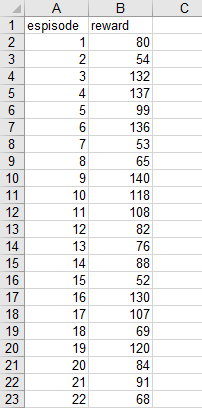
sheet.write(0, 0, "espisode")
sheet.write(0, 1, "reward")
episode=100
reward=random.sample(range(50, 150), episode)
for i in range(100):
# 将数据写入前两列
sheet.write(i+1, 1, reward[i]) # 第i+1行0列
sheet.write(i+1, 0, i+1) # 第i+1行1列
# 保存表格
book.save('data.xls')效果:
2. 方法二:openpyxl
pip install openpyxlfrom openpyxl import Workbook
#新建对象
wb=Workbook()
#激活sheet
sheet=wb.active
#给sheet一个名字
sheet.title='mysheet'
# 增加一行的语法是
# sheet.append(一维的list或tuple)
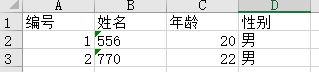
sheet.append(['编号','姓名','年龄','性别'])
sheet.append([1,'556',20,'男'])
sheet.append([2,'770',22,'男'])
# 保存
wb.save('test.xlsx')
效果:
2.1 超详细例子
自己代码例子:数据过大保存到第三四列
def save(train_episode, test_episode, train_reward, evaluate_reward):

    book = xlwt.Workbook(encoding='utf-8', style_compression=0)

    sheet = book.add_sheet('train', cell_overwrite_ok=True)  # 设置多个sheet

    sheet2 = book.add_sheet('evaluate', cell_overwrite_ok=True)

    # 往第一行写入名称

    sheet.write(0, 0, "train_episode")

    sheet.write(0, 1, "train_reward")

    for i in train_episode:

        # 将数据写入前两列

        sheet.write(i+1, 1, train_reward[i])  # 第i+1行0列

        sheet.write(i+1, 0, i+1)       # 第i+1行1列

        if i >=60000:

            sheet.write(0, 2, "train_episode")

            sheet.write(0, 3, "train_reward")

            for j in (train_episode-60000):

                sheet.write(j+1, 3, train_reward[i])  # 第i+1行0列

                sheet.write(j+1, 2, train_episode)       # 第i+1行1列

    sheet2.write(0, 0, "episode")

    sheet2.write(0, 1, "evaluate_reward")

    for k in test_episode:

        # 将数据写入前两列

        sheet.write(k+1, 1, evaluate_reward[k])  # 第i+1行0列

        sheet.write(k+1, 0, k+1)       # 第i+1行1列

    # 保存表格

    book.save('reward.xls')
3.xlrd读取excel文件并画图
3.1 安装以及相关报错
pip install xlrd
值得注意的是:文件格式要保存为xls【excel数据存储另存为xls比较稳妥】,直接改后缀名可能还会报错,报错如下:
Excel xlsx file; not supported
Unsupported format, or corrupt file: Expected BOF record; found b'<?xml ve'
3.2 代码例子:
import xlwt

import random

import matplotlib.pyplot as plt

import xlrd

plt.rcParams['font.sans-serif'] = ['SimHei']  # 用来正常显示中文标签

plt.rcParams['axes.unicode_minus'] = False  # 用来正常显示负号

x_data=[]

y_data=[]

data = xlrd.open_workbook('text.xls')

table = data.sheets()[0]

cap = table.col_values(1) #读取第二列数据

cap1 = table.col_values(0)#读取第一列数据

#print(cap)  #打印出来检验是否正确读取

for i in range(0,998):

    y_data.append(cap[i])

    x_data.append(cap1[i]*50) #对第一列数据扩大50倍

plt.plot(x_data, y_data,color="#006bac")

plt.title('标题')

plt.legend()#标签

plt.xlabel('episodes')

plt.ylabel('Average reward')

plt.show()

3.3 代码多图例子
import xlrd

import matplotlib.pyplot as plt

#调节字体

plt.rcParams['font.sans-serif'] = ['SimHei']  # 用来正常显示中文标签

plt.rcParams['axes.unicode_minus'] = False  # 用来正常显示负号

#导入excel文件,以及第几张表

data = xlrd.open_workbook('GDP2(已自动还原).xls')

table = data.sheets()[0]

#第一个图的数据

t1 = table.col_values(1)

tt = t1[1:90]

xAxis1 = range(1929,2018)

#第二个图的数据

t2 = table.col_values(2)

tu = t2[27:90]

xAxis2 = range(1955,2018)

#第三个图的数据

t3 = table.col_values(3)

tv = t3[20:90]

xAxis3 = range(1948,2018)

#第四个图的数据

t4 = table.col_values(4)

tw = t4[42:90]

xAxis4 = range(1970,2018)

#作图

plt.plot(xAxis1, tt, label='美国GDP')

plt.plot(xAxis2, tu, label='日本GDP')

plt.plot(xAxis3, tv, label='英国GDP')

plt.plot(xAxis4, tw, label='韩国GDP')

plt.xlabel('年份')

plt.ylabel('GDP现价')

plt.title("各国GDP的变化")

plt.legend()

plt.show()
Python xlwt数据保存到 Excel中以及xlrd读取excel文件画图的更多相关文章
- Python将数据保存到CSV中
#coding:utf-8import csv headers = ['ID','UserName','Password','Age','Country'] rows = [(1001,'qiye', ...
- Python爬虫数据保存到MongoDB中
MongoDB是一款由C++语言编写的非关系型数据库,是一个基于分布式文件存储的开源数据库系统,其内容存储方式类似于JSON对象,它的字段值可以是其它文档或数组,但其数据类型只能是String文本型. ...
- 1.scrapy爬取的数据保存到es中
先建立es的mapping,也就是建立在es中建立一个空的Index,代码如下:执行后就会在es建lagou 这个index. from datetime import datetime fr ...
- Excel文件数据保存到SQL中
1.获取DataTable /// <summary> /// 查询Excel文件中的数据 /// </summary> /// <param name="st ...
- 将爬取的数据保存到mysql中
为了把数据保存到mysql费了很多周折,早上再来折腾,终于折腾好了 安装数据库 1.pip install pymysql(根据版本来装) 2.创建数据 打开终端 键入mysql -u root -p ...
- c# 抓取和解析网页,并将table数据保存到datatable中(其他格式也可以,自己去修改)
使用HtmlAgilityPack 基础请参考这篇博客:https://www.cnblogs.com/fishyues/p/10232822.html 下面是根据抓取的页面string 来解析并保存 ...
- Redis使用场景一,查询出的数据保存到Redis中,下次查询的时候直接从Redis中拿到数据。不用和数据库进行交互。
maven使用: <!--redis jar包--> <dependency> <groupId>redis.clients</groupId> < ...
- [python]mysql数据缓存到redis中 取出时候编码问题
描述: 一个web服务,原先的业务逻辑是把mysql查询的结果缓存在redis中一个小时,加快请求的响应. 现在有个问题就是根据请求的指定的编码返回对应编码的response. 首先是要修改响应的bo ...
- 在scrapy中将数据保存到mongodb中
利用item pipeline可以实现将数据存入数据库的操作,可以创建一个关于数据库的item pipeline 需要在类属性中定义两个常量 DB_URL:数据库的URL地址 DB_NAME:数据库的 ...
- Python用xlrd读取Excel数据到list中再用xlwt把数据写入到新的Excel中
一.先用xlrd读取Excel数据到list列表中(存入列表中的数据如下图所示) import xlrd as xd #导入需要的包 import xlwt data =xd.open_workboo ...
随机推荐
- 解决ttrss(Tiny Tiny RSS)中fever无法使用的问题
问题描述 在ttrss刚搭建好的时候,进行了如下操作: 随后键入了密码(fever密码) 最后,按照官方给的提示,在Fluent Reader中测试,弹出如下错误信息: 解决方案 复制官方给的链接,删 ...
- 深挖 Rundll32.exe 的多种“滥用方式”以及其“独特”之处
恶意软件作者通常会编写恶意软件模仿合法的Windows进程.因此,我们可能会看到恶意软件伪装成svchost.exe.rundll32.exe或lsass.exe进程,攻击者利用的就是大多数Windo ...
- 【3rd Party】Cpp 中使用 Protobuf
前置条件: [Protoc]VS2019 (VS平台) 使用 CMake 编译安装.使用 Protobuf 库 [ToolChains]CLion(VS2019) + CMake + Vcpkg 的使 ...
- Windows 环境下安装与配置 Node.js
一.下载Node.js安装包 下载地址:http://nodejs.cn/download/ 本教程以msi安装包为例 点击Windows 安装包下载 二.安装Node.js 1.打开安装包 欢迎页: ...
- Visual Studio 2022 激活码
Pro: TD244-P4NB7-YQ6XK-Y8MMM-YWV2J Enterprise: VHF9H-NXBBB-638P6-6JHCY-88JWH Key 来自网络 备忘...
- Python的excel文件读写(未完)
写在前面: 因为每次用到都要查感觉太烦了,所以干脆写了一篇博客总结( •̥́ ˍ •̀ू ) 一.xlwt写入excel文件(.xls) import xlwt data1=[[1,2,3,4],[5 ...
- RL 基础 | 如何注册自定义 gym 环境
如何 搭建 自定义 gym 环境:https://www.cnblogs.com/moonout/p/17174833.html 如何注册自定义 gym 环境: 博客:https://zhuanlan ...
- Zookeeper 的 ZAB 协议 以及 zookeeper 与 nacos 注册中心比对
本文为博主原创,未经允许不得转载: 目录: 1. ZAB 协议 2. zookeer 节点状态 3. zookeeper 注册中心与 nacos 注册中心比较 4. zookeeper 配置注册中心 ...
- 【滤波】Kalman Filter
from: 卡尔曼滤波教程 (kalmanfilter.net) 总览 关于本教程 关于作者 关于卡尔曼滤波 为什么需要预测算法 卡尔曼滤波简介 必要的背景知识 均值和期望 方差和标准差 正态分布 随 ...
- [转帖]SMEMBERS:获取集合包含的所有元素
https://www.bookstack.cn/read/redisguide/spilt.4.291fab46a3b4f05c.md SMEMBERS set 以下代码展示了如何使用 SMEMBE ...