《DSP using MATLAB》示例 Example 9.11
代码:
%% ------------------------------------------------------------------------

%%            Output Info about this m-file

fprintf('\n***********************************************************\n');

fprintf('        <DSP using MATLAB> Exameple 9.11 \n\n');

time_stamp = datestr(now, 31);

[wkd1, wkd2] = weekday(today, 'long');

fprintf('      Now is %20s, and it is %7s  \n\n', time_stamp, wkd2);

%% ------------------------------------------------------------------------

% Filter Design:

D = 2; Rp = 0.1; As = 30; wp = pi/D; ws = wp+0.1*pi;

[delta1, delta2] = db2delta(Rp, As);

%weights = [delta2/delta1, 1];

[N, F, A, weights] = firpmord([wp, ws]/pi, [1, 0], [delta1, delta2], 2);

h = firpm(N, F, A, weights); n = [0:length(h)-1];

[Hr, w, a, L] = Hr_Type1(h); Hr_min = min(Hr); w_min = find(Hr == Hr_min);

H = abs(freqz(h, 1, w)); Hdb = 20*log10(H/max(H)); min_attn = Hdb(w_min);

%% -----------------------------------------------------------------

%%                             Plot

%% -----------------------------------------------------------------

% Input signal

Hf1 = figure('units', 'inches', 'position', [1, 1, 8, 6], ...

	'paperunits', 'inches', 'paperposition', [0, 0, 6, 4], ...

	'NumberTitle', 'off', 'Name', 'Exameple 9.11');

set(gcf,'Color','white');

TF = 10;

subplot(2, 2, 1);

Hs1 = stem(n, h, 'filled'); set(Hs1, 'markersize', 2, 'color', 'g');

axis([-1, length(n), -0.15, 0.6]); grid on;

xlabel('n', 'vertical', 'bottom'); ylabel('Amplitude', 'vertical', 'cap');

title('Inpulse Response ', 'fontsize', TF, 'vertical', 'baseline');

set(gca, 'xtick', [n(1), n(end)]);

set(gca, 'ytick', [0, 0.5]);

subplot(2, 2, 3);

plot(w/pi, Hr, 'm', 'linewidth', 1.0); axis([0, 1, -0.1, 1.1]); grid on;

xlabel('Frequency in \pi units', 'vertical', 'middle'); ylabel('Amplitude', 'vertical', 'cap');

title('Amplitude Response', 'fontsize', TF, 'vertical', 'baseline');

set(gca, 'xtick', [0, wp/pi, ws/pi, 1]);

set(gca, 'ytick', [0, 1]);

subplot(2, 2, 2);

plot(w/pi, Hdb, 'm', 'linewidth', 1.0); axis([0, 1, -50, 10]); grid on;

xlabel('Frequency in \pi units', 'vertical', 'middle'); ylabel('Decibels', 'vertical', 'cap');

title('Log-magnitude Response ', 'fontsize', TF, 'vertical', 'baseline');

set(gca, 'xtick', [0, wp/pi, ws/pi, 1]);

set(gca, 'ytick', [-50, round(min_attn), 0]);

subplot(2, 2, 4);

lw = length(w)-1; PB = [0:floor(wp/pi*lw)]; HrPB = Hr(PB+1)-1;

SB = [ceil(ws/pi*lw):lw]; HrSB = Hr(SB+1);

[AX, H1, H2] = plotyy(PB/lw, HrPB, SB/lw, HrSB);

delta1 = round(delta1*1000)/1000; delta2 = round(delta2*100)/100;

set(AX(1), 'xtick', [0, wp/pi, ws/pi, 1], 'ytick', [-delta1, 0, delta1], 'Ycolor', 'g');

set(AX(2), 'xtick', [0, wp/pi, ws/pi, 1], 'ytick', [-delta2, 0, delta2], 'Ycolor', 'r');

set(H1, 'color', 'g', 'linewidth', 1);

set(H2, 'color', 'r', 'linewidth', 1);

title('Unweighted Ripples', 'fontsize', TF, 'vertical', 'baseline');

xlabel('Frequency in \pi units', 'vertical', 'middle'); ylabel('Amplitude', 'vertical', 'cap');
运行结果:
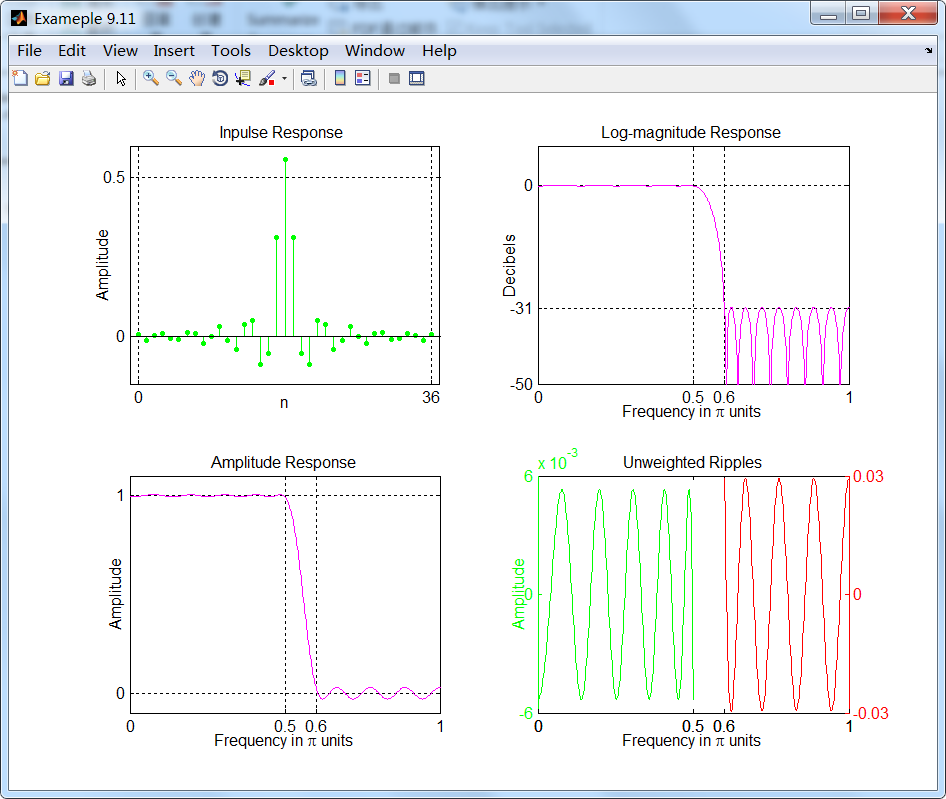
滤波器在通带[0,π/2]上无畸变通过信号。但是,因为过渡带较宽,所以过渡带中的信号有可能假频混入到感兴趣的频带
中。30dB的衰减可能使得在减采样过程后阻带的部分谱折叠到通带中。因此,我们需要一个更好的方法。
《DSP using MATLAB》示例 Example 9.11的更多相关文章
- 《DSP using MATLAB》Problem 7.11
代码: %% ++++++++++++++++++++++++++++++++++++++++++++++++++++++++++++++++++++++++++++++++ %% Output In ...
- 《DSP using MATLAB》Problem 6.11
代码: %% ++++++++++++++++++++++++++++++++++++++++++++++++++++++++++++++++++++++++++++++++ %% Output In ...
- 《DSP using MATLAB》Problem 5.11
代码: %% ++++++++++++++++++++++++++++++++++++++++++++++++++++++++++++++++++++++++++++++++ %% Output In ...
- 《DSP using MATLAB》Problem 4.11
代码: %% ---------------------------------------------------------------------------- %% Output Info a ...
- 《DSP using MATLAB》Problem 8.11
代码: %% ------------------------------------------------------------------------ %% Output Info about ...
- DSP using MATLAB 示例 Example3.11
用到的性质 上代码: n = -5:10; x = rand(1,length(n)); k = -100:100; w = (pi/100)*k; % freqency between -pi an ...
- DSP using MATLAB 示例Example2.11
上代码: b = [1]; a = [1, -1, 0.9]; n = [-20:120]; h = impz(b,a,n); set(gcf,'Color','white'); %subplot(2 ...
- DSP using MATLAB 示例Example3.21
代码: % Discrete-time Signal x1(n) % Ts = 0.0002; n = -25:1:25; nTs = n*Ts; Fs = 1/Ts; x = exp(-1000*a ...
- DSP using MATLAB 示例 Example3.19
代码: % Analog Signal Dt = 0.00005; t = -0.005:Dt:0.005; xa = exp(-1000*abs(t)); % Discrete-time Signa ...
- DSP using MATLAB示例Example3.18
代码: % Analog Signal Dt = 0.00005; t = -0.005:Dt:0.005; xa = exp(-1000*abs(t)); % Continuous-time Fou ...
随机推荐
- king 选 太子
king 选 太子 时间限制:3000 ms | 内存限制:65535 KB 难度:1 描述 啊,从前有一个国家.此国兵强马壮,但是国王却身体不好.于是就想挑一位太子出来: 但是问题来了,国王 ...
- Html常用标记总结
超文本标记语言的结构包括“头”部分(英语:Head).和“主体”部分(英语:body),其中“头”部提供关于网页的信息,“主体”部分提供网页的具体内容. Web页面绝大多数都是由html所编写的. 一 ...
- 【运维技术】shell脚本实现线程挂掉,自动重启功能
由于分布式系统的流行,服务器上面部署的项目都是多实例的.而我又希望有一个功能,当服务器出现异常情况能够自动重启实例. 所以我想到了使用shell脚本监控实例进程id,如果不存在的话,就重启对应的实例. ...
- Python笔记 #18# Pandas: Grouping
10 Minutes to pandas 引 By “group by” we are referring to a process involving one or more of the foll ...
- mysql 触发器 trigger用法 one (简单的)
实例~~ example1: 创建表tab1 1 2 3 4 DROP TABLE IF EXISTS tab1; CREATE TABLE tab1( tab1_id varchar(11) ...
- HDU 2222 Keywords Search(AC自动机)题解
题意:给你几个keywords,再给你一段文章,问你keywords出现了几次. 思路:这里就要用到多模匹配算法AC自动机了,AC自动机需要KMP和字典树的知识,匹配时是在字典树上,失配我们就要用到类 ...
- 如何解决Nginx php 50x 错误
SEO反馈百度爬虫经常504,一般情况下是由nginx默认的fastcgi进程响应慢引起的,但也有其他情况,这里我总结了一些解决办法供大家参考. 方法/步骤 一般50x状态码问题分析: Nginx ...
- shell 判断变量是否为空
一句话判断 [ ! $a ] && echo "a is null" 1.判断变量 read -p "input a word :" word ...
- android 优秀框架整理
程序员界有个神奇的网站,那就是github,这个网站集合了一大批优秀的开源框架,极大地节省了开发者开发的时间,在这里我进行了一下整理,这样可以使我们在使用到时快速的查找到,希望对大家有所帮助! 1. ...
- CentOS7 64位下MySQL5.7安装与配置
安装环境:CentOS7 64位 MINI版,安装MySQL5.7 1.配置YUM源 在MySQL官网中下载YUM源rpm安装包:http://dev.mysql.com/downloads/repo ...