
《DSP using MATLAB》Problem 8.11

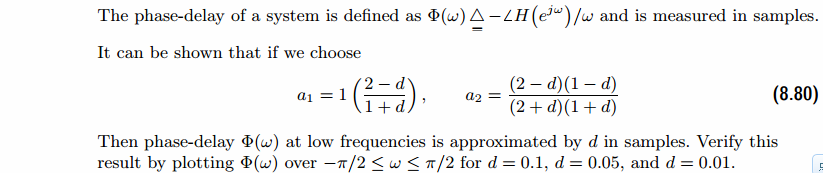
代码:
%% ------------------------------------------------------------------------

%%            Output Info about this m-file

fprintf('\n***********************************************************\n');

fprintf('        <DSP using MATLAB> Problem 8.11 \n\n');

banner();

%% ------------------------------------------------------------------------

%d = 0.10

%d = 0.05

d = 0.01

a1 = (2-d)/(1+d);

a2 = (2-d)*(1-d)/((2+d)*(1+d));

% digital IIR 2nd-order allpass filter

b = [a2  a1  1]

a = [1  a1  a2]

figure('NumberTitle', 'off', 'Name', 'Problem 8.11 Pole-Zero Plot')

set(gcf,'Color','white');

zplane(b,a);

title(sprintf('Pole-Zero Plot, d=%.2f',d));

%pzplotz(b,a);

[db, mag, pha, grd, w] = freqz_m(b, a);

% ---------------------------------------------------------------------

%  Choose the gain parameter of the filter, maximum gain is equal to 1

% ---------------------------------------------------------------------

gain1=max(mag)                    % with poles

K = 1

[db, mag, pha, grd, w] = freqz_m(K*b, a);

figure('NumberTitle', 'off', 'Name', 'Problem 8.11 IIR allpass filter')

set(gcf,'Color','white');

subplot(2,2,1); plot(w/pi, db); grid on; axis([0 2 -60 10]);

set(gca,'YTickMode','manual','YTick',[-60,-30,0])

set(gca,'YTickLabelMode','manual','YTickLabel',['60';'30';' 0']);

set(gca,'XTickMode','manual','XTick',[0,0.25,0.5,1,1.5,1.75,2]);

xlabel('frequency in \pi units'); ylabel('Decibels'); title('Magnitude Response in dB');

subplot(2,2,3); plot(w/pi, mag); grid on; %axis([0 1 -100 10]);

xlabel('frequency in \pi units'); ylabel('Absolute'); title('Magnitude Response in absolute');

set(gca,'XTickMode','manual','XTick',[0,0.25,0.5,1,1.5,1.75,2]);

set(gca,'YTickMode','manual','YTick',[0,1.0]);

subplot(2,2,2); plot(w/pi, pha); grid on; %axis([0 1 -100 10]);

xlabel('frequency in \pi units'); ylabel('Rad'); title('Phase Response in Radians');

subplot(2,2,4); plot(w/pi, grd*pi/180);  grid on; %axis([0 1 -100 10]);

xlabel('frequency in \pi units'); ylabel('Rad'); title('Group Delay');

set(gca,'XTickMode','manual','XTick',[0,0.25,0.5,1,1.5,1.75,2]);

%set(gca,'YTickMode','manual','YTick',[0,1.0]);

figure('NumberTitle', 'off', 'Name', 'Problem 8.11 IIR allpass filter')

set(gcf,'Color','white');

plot(w/pi, -pha/w); grid on; %axis([0 1 -100 10]);

xlabel('frequency in \pi units'); ylabel('Rad'); title('Phase Delay in samples');

% Impulse Response

fprintf('\n----------------------------------');

fprintf('\nPartial fraction expansion method: \n');

[R, p, c] = residuez(K*b,a)

MR = (abs(R))'              % Residue  Magnitude

AR = (angle(R))'/pi         % Residue  angles in pi units

Mp = (abs(p))'              % pole  Magnitude

Ap = (angle(p))'/pi         % pole  angles in pi units

[delta, n] = impseq(0,0,20);

h_chk = filter(K*b,a,delta);      % check sequences

% ------------------------------------------------------------------------------------------------

%                                gain parameter K

% ------------------------------------------------------------------------------------------------

%h =  0.2202 * ((-0.9385) .^ n) + (-0.8308) * ((-0.7887) .^ n) + 1.3509 * delta;    %d=0.1

%h =  0.1099 * ((-0.9688) .^ n) + (-0.4112) * ((-0.8884) .^ n) + 1.1619 * delta;    %d=0.05

h =  0.0220 * ((-0.9937) .^ n) + (-0.0820) * ((-0.9766) .^ n) + 1.0305 * delta;    %d=0.01

% ------------------------------------------------------------------------------------------------

figure('NumberTitle', 'off', 'Name', 'Problem 8.11 IIR allpass filter, h(n) by filter and Inv-Z ')

set(gcf,'Color','white');

subplot(2,1,1); stem(n, h_chk); grid on; %axis([0 2 -60 10]);

xlabel('n'); ylabel('h\_chk'); title('Impulse Response sequences by filter');

subplot(2,1,2); stem(n, h); grid on; %axis([0 1 -100 10]);

xlabel('n'); ylabel('h'); title('Impulse Response sequences by Inv-Z');

[db, mag, pha, grd, w] = freqz_m(h, [1]);

figure('NumberTitle', 'off', 'Name', 'Problem 8.11 IIR filter, h(n) by Inv-Z ')

set(gcf,'Color','white');

subplot(2,2,1); plot(w/pi, db); grid on; axis([0 2 -60 10]);

set(gca,'YTickMode','manual','YTick',[-60,-30,0])

set(gca,'YTickLabelMode','manual','YTickLabel',['60';'30';' 0']);

set(gca,'XTickMode','manual','XTick',[0,0.25,1,1.75,2]);

xlabel('frequency in \pi units'); ylabel('Decibels'); title('Magnitude Response in dB');

subplot(2,2,3); plot(w/pi, mag); grid on; %axis([0 1 -100 10]);

xlabel('frequency in \pi units'); ylabel('Absolute'); title('Magnitude Response in absolute');

set(gca,'XTickMode','manual','XTick',[0,0.25,1,1.75,2]);

set(gca,'YTickMode','manual','YTick',[0,1.0]);

subplot(2,2,2); plot(w/pi, pha); grid on; %axis([0 1 -100 10]);

xlabel('frequency in \pi units'); ylabel('Rad'); title('Phase Response in Radians');

subplot(2,2,4); plot(w/pi, grd*pi/180);  grid on; %axis([0 1 -100 10]);

xlabel('frequency in \pi units'); ylabel('Rad'); title('Group Delay');

set(gca,'XTickMode','manual','XTick',[0,0.25,1,1.75,2]);

%set(gca,'YTickMode','manual','YTick',[0,1.0]);
运行结果:
这里放d=0.1的运行结果。
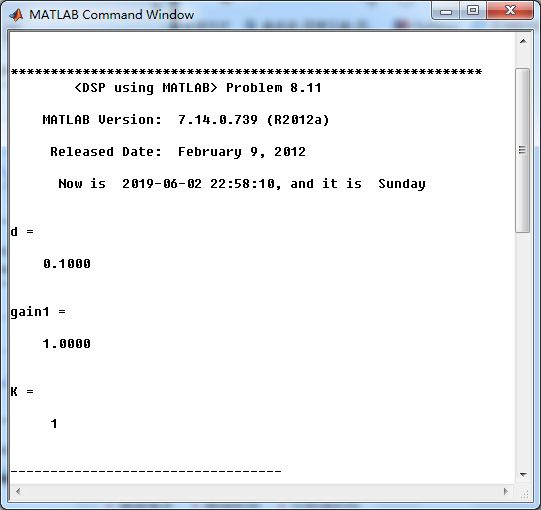
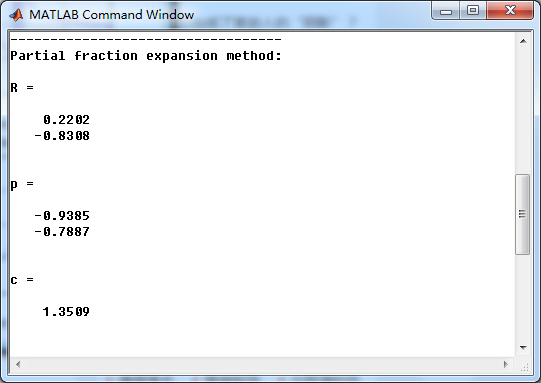
二阶全通滤波器的留数、极点
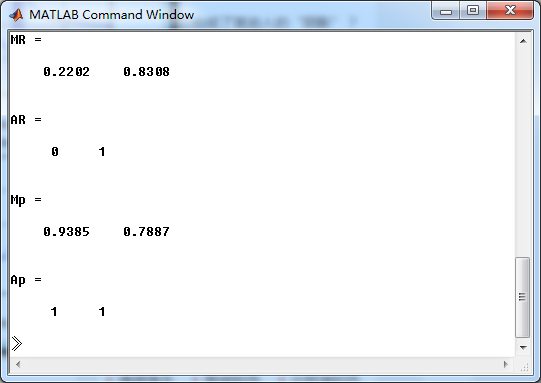
系统零极点图,可以看出,两个零点都在单位圆外,幅角为π
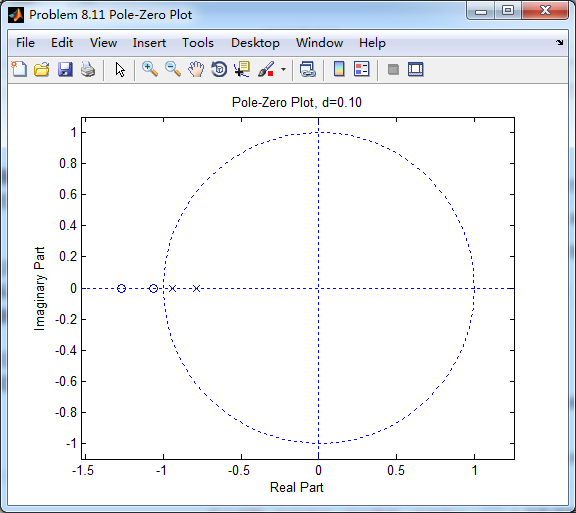
方法一,利用系统函数直接形式,将脉冲序列做输入,得到脉冲响应h,得到系统幅度谱、相位谱和群延迟,如下图

方法二,将二阶全通系统函数部分分式展开,然后查表求逆z变换,得到脉冲响应h_chk
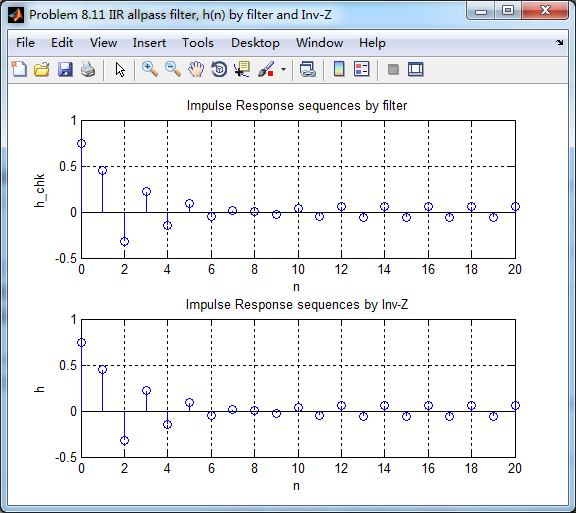
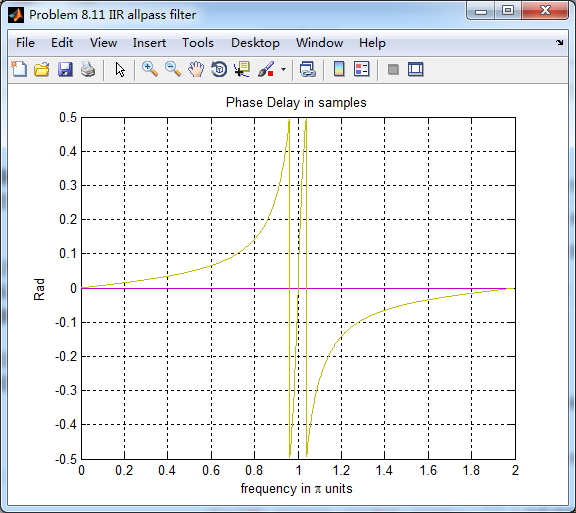
幅度谱、相位谱和群延迟,可以看到,ω=π时,幅度有衰减

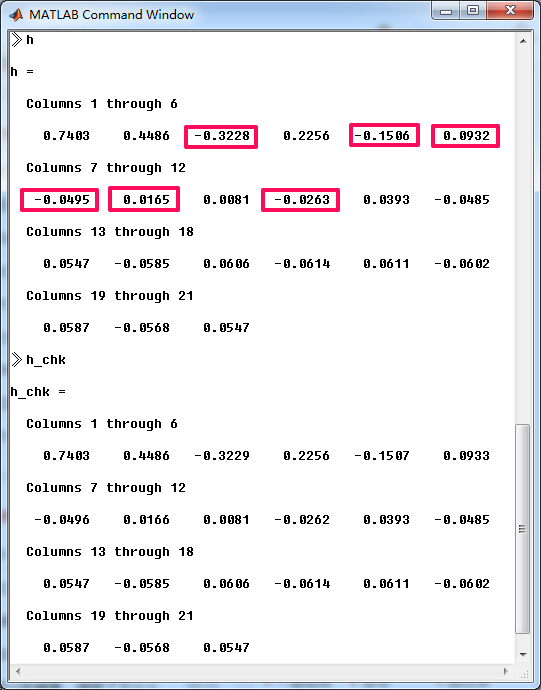
可见,两种方法得到的脉冲响应h有区别,我们将各自前21个元素列出来,方框处二者稍有区别。
但,为何有区别,没搞懂,欢迎各位博友不吝赐教。
《DSP using MATLAB》Problem 8.11的更多相关文章
- 《DSP using MATLAB》Problem 7.11
代码: %% ++++++++++++++++++++++++++++++++++++++++++++++++++++++++++++++++++++++++++++++++ %% Output In ...
- 《DSP using MATLAB》Problem 6.11
代码: %% ++++++++++++++++++++++++++++++++++++++++++++++++++++++++++++++++++++++++++++++++ %% Output In ...
- 《DSP using MATLAB》Problem 5.11
代码: %% ++++++++++++++++++++++++++++++++++++++++++++++++++++++++++++++++++++++++++++++++ %% Output In ...
- 《DSP using MATLAB》Problem 4.11
代码: %% ---------------------------------------------------------------------------- %% Output Info a ...
- 《DSP using MATLAB》Problem 7.16
使用一种固定窗函数法设计带通滤波器. 代码: %% ++++++++++++++++++++++++++++++++++++++++++++++++++++++++++++++++++++++++++ ...
- 《DSP using MATLAB》Problem 7.6
代码: 子函数ampl_res function [Hr,w,P,L] = ampl_res(h); % % function [Hr,w,P,L] = Ampl_res(h) % Computes ...
- 《DSP using MATLAB》Problem 5.21
证明: 代码: %% ++++++++++++++++++++++++++++++++++++++++++++++++++++++++++++++++++++++++++++++++++++++++ ...
- 《DSP using MATLAB》Problem 5.20
窗外的知了叽叽喳喳叫个不停,屋里温度应该有30°,伏天的日子难过啊! 频率域的方法来计算圆周移位 代码: 子函数的 function y = cirshftf(x, m, N) %% -------- ...
- 《DSP using MATLAB》Problem 5.14
说明:这两个小题的数学证明过程都不会,欢迎博友赐教. 直接上代码: %% +++++++++++++++++++++++++++++++++++++++++++++++++++++++++++++++ ...
随机推荐
- 一点响应式Web设计与实现思路
摘要: 是否还在为你的应用程序适配PC端,移动端,平板而苦苦思索呢,是否在寻找如何一套代码适配多终端方式呢,是否希望快速上手实现你的跨终端应用程序呢,是的话,那就看过来吧,本文阐述响应式UI设计相关理 ...
- BZOJ2152 聪明可可 点分治
题意传送门 思路:基本的点分治思路,num数组记录从u点开始路径长度分别为1或者2或者3的路径长度(取模3意义下),然后做一个简单的容斥就好了. 为了避免计数的麻烦,<u,u>这样的点单独 ...
- Ubuntu16.04下安装Visual Studio Code
sudo add-apt-repository ppa:ubuntu-desktop/ubuntu-make sudo apt-get update sudo apt-get install ubun ...
- override和overload区别
方法重载(overload)实现的是编译时的多态性(也称为前绑定) 方法重写(override)实现的是运行时的多态性(也称为后绑定)
- Vim统计字符串出现次数
关键命令: :%s/pattern//gn 参数说明: % - 指明操作区间,%表示全文本:可以使用1,$或者行区间代替 s – substitute,表示替换 pattern - 要查找的字符串 / ...
- thinkphp ajax返回
ThinkPHP可以很好的支持AJAX请求,系统的\Think\Controller类提供了ajaxReturn方法用于AJAX调用后返回数据给客户端.并且支持JSON.JSONP.XML和EVAL四 ...
- 费用流模板(带权二分图匹配)——hdu1533
/* 带权二分图匹配 用费用流求,增加源点s 和 汇点t */ #include<bits/stdc++.h> using namespace std; #define maxn 1000 ...
- tomcat8乱码问题
1:注册表里修改 1):找到 HKEY_CURRENT_USER\Console\%SystemRoot%_system32_cmd.exe 如果 该项下已存在CodePage项,则把值改为十进制” ...
- (转)JNI入门教程之HelloWorld篇 .
转: http://blog.csdn.net/mingjava/article/details/180946 本文讲述如何使用JNI技术实现HelloWorld,目的是让读者熟悉JNI的机制并编写第 ...
- https://www.cnblogs.com/chinabin1993/p/9848720.html
转载:https://www.cnblogs.com/chinabin1993/p/9848720.html 这段时间一直在用vue写项目,vuex在项目中也会依葫芦画瓢使用,但是总有一种朦朦胧胧的感 ...