python应用-matplotlib绘图
详细内容参看:官网
测试数据:
# 传入的参数

x=[1,2,3,4,5]

squares=[1,4,9,16,25]
简单的绘图
import matplotlib.pyplot as plt

def plot1(x,squares):

    """plot simple pic"""

    plt.plot(x,squares,linewidth=1)

    # or plt.plot(squares)

    plt.show()
- plt.plot(x,y)
- plt.show()
改变文字、字体、线宽
def plot2(x,squares):

    """change literature and line width"""

    plt.plot(x,squares,linewidth=2)

    plt.title("Literatures",fontsize=24)

    plt.xlabel("xlabel",fontsize=14)

    plt.ylabel("ylabel",fontsize=14)

    # set labelsize of x, y

    plt.tick_params(axis='both',labelsize=14)

    plt.show()
- plt.title("title")
- plt.xlabel('xlabel')
- plt.ylabel('ylabel')
- plt.tick_params(axis,labelsize)
自动生成数据
def plot3():

    """automatically compute the data"""

    x_val = list(range(1,1001))

    y_val = [x**2 for x in x_val]

    plt.scatter(x_val,y_val,s=5)

    plt.title("Literatures",fontsize=24)

    plt.xlabel("xlabel",fontsize=14)

    plt.ylabel("ylabel",fontsize=14)

    # set labelsize of x, y

    plt.tick_params(axis='both',labelsize=14)

    plt.axis([0,1100,0,1100000])

    plt.show()
- plt.axis([0,1100,0,110000])
- plt.scatter(x,y,s)
颜色改变(很漂亮)
def plot4():

    """change the color"""

    x_val = list(range(1,1001))

    y_val = [x**2 for x in x_val]

    # delete the default edgecolor(black)

    # change color by adjusting c

    plt.scatter(x_val,y_val,edgecolor='none',c=(0.5,0.6,0.3),s=5)

    plt.title("Literatures",fontsize=24)

    plt.xlabel("xlabel",fontsize=14)

    plt.ylabel("ylabel",fontsize=14)

    # set labelsize of x, y

    plt.tick_params(axis='both',labelsize=14)

    plt.axis([0,1100,0,1100000])

    plt.show()
- plt.scatter(x,y,edgecolor='none',c,s)
- c用来调节颜色
- s代表size
def plot5():

    """using colormap"""

    x_val = list(range(1,1001))

    y_val = [x**2 for x in x_val]

    # delete the default edgecolor(black)

    # using cmap to make gradient

    plt.scatter(x_val,y_val,edgecolor='none',c=y_val,s=5,cmap=plt.cm.Blues)

    plt.title("Literatures",fontsize=24)

    plt.xlabel("xlabel",fontsize=14)

    plt.ylabel("ylabel",fontsize=14)

    # set labelsize of x, y

    plt.tick_params(axis='both',labelsize=14)

    plt.axis([0,1100,0,1100000])

    plt.show()
- plt.scatter(x,y,edgecolor,c,s,cmap)
- cmap颜色映射
- plt.cm.Blues
- plt.cm.Reds
- plt.cm.Greens
- plt.cm.Paired
- plt.cm.binary
- plt.cm.seismic
- cmap颜色映射
保存图片
def plot6():
"""using colormap"""
x_val = list(range(1,1001))
y_val = [x**2 for x in x_val]
# delete the default edgecolor(black)
# using cmap to make gradient
# cmap(plt.cm.*) Blues Reds Greens Paired binary seismic
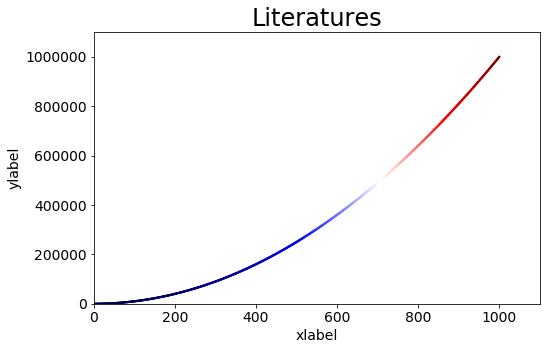
plt.scatter(x_val,y_val,edgecolor='none',c=y_val,s=5,cmap=plt.cm.seismic)
plt.title("Literatures",fontsize=24)
plt.xlabel("xlabel",fontsize=14)
plt.ylabel("ylabel",fontsize=14)
# set labelsize of x, y
plt.tick_params(axis='both',labelsize=14)
plt.axis([0,1100,0,1100000])
# do not show, save it
plt.savefig('save.png',bbox_inches='tight')
- plt.savefig('name.jpg',bbox_inches)
- 一般bbox_inches='tight'比较好
python应用-matplotlib绘图的更多相关文章
- python 中matplotlib 绘图
python 中matplotlib 绘图 数学建模需要,对于绘图进行简单学习 matpoltlib之类的包安装建议之间用anaconda 绘制一条y=x^2的曲线 #比如我们要绘制一条y=x^2的曲 ...
- python之matplotlib绘图基础
Python之matplotlib基础 matplotlib是Python优秀的数据可视化第三方库 matplotlib库的效果可参考 http://matplotlib.org/gallery.ht ...
- python基于matplotlib绘图
import math import numpy as np import matplotlib.pyplot as plt from matplotlib.font_manager import F ...
- python中matplotlib绘图封装类之折线图、条状图、圆饼图
DrawHelper.py封装类源码: import matplotlib import matplotlib.pyplot as plt import numpy as np class DrawH ...
- Python用matplotlib绘图网格线的设置
一.X轴网格线的设置 import matplotlib.pyplot as plt import numpy as np from pylab import mpl mpl.rcParams['fo ...
- python中利用matplotlib绘图可视化知识归纳
python中利用matplotlib绘图可视化知识归纳: (1)matplotlib图标正常显示中文 import matplotlib.pyplot as plt plt.rcParams['fo ...
- python 利用matplotlib中imshow()函数绘图
matplotlib 是python最著名的2D绘图库,它提供了一整套和matlab相似的命令API,十分适合交互式地进行制图.而且也可以方便地将它作为绘图控件,嵌入GUI应用程序中.通过简单的绘图语 ...
- python实战学习之matplotlib绘图
matplotlib 是最流行的Python底层绘图库,主要做数据可视化图表 可以将数据可视化,能够更直观的呈现数据 matplotlib绘图基本要点 首先实现一个简单的绘图 # 导入pyplot f ...
- python强大的绘图模块matplotlib示例讲解
Matplotlib 是 Python 的绘图库.作为程序员,经常需要进行绘图,在我自己的工作中,如果需要绘图,一般都是将数据导入到excel中,然后通过excel生成图表,这样操作起来还是比较繁琐的 ...
随机推荐
- 从一次渗透谈到linux如何反弹shell
零.绪论 背景: ThinkPHP框架的--> 找到一个OS命令注入(很简单的Burp可以直接扫出来的那种):页面配置系统默认网关处. 一.渗透过程 1.首先看了一下,没有回显. 2.用ceye ...
- 微信小程序5.2.2版本,找不着resource下exml皮肤
问题描述: egret engine 5.2.2 原来5.1.11好好的,一升级就跪了 新建一个项目,找不到皮肤... 已发到论坛问去了,现在只能手动复制皮肤到小游戏目录下... 解决方案: 卸载重新 ...
- C# TOKEN的保存与验证
Token主要为了防止非本页数据的提交,防止重复提交. /** * * 保存TOKEN信息 * */ public void saveToken() { //此处生成md5串 string md5 = ...
- html to pdf小工具,支持evernote导出的html和firefox插件scrapbook
周末花了一天时间用wpf写了一个html转换为pdf的小工具. 已经在win7 32位 和win8 64两台机器上测试,目前基本可用,特拿来分享. 程序下载地址:http://pan.baidu.co ...
- ehcache加载配置文件ehcache.xml的源码
package net.sf.ehcache.config; public final class ConfigurationFactory { public static Configuration ...
- Linux系统下Redis缓存安装配置
Redis是一个高性能的key-value数据库,现时越来越多企业与应用使用Redis作为缓存服务器.楼主是一枚JAVA后端程序员,也算是半个运维工程师了.在Linux服务器上搭建Redis,怎么可以 ...
- 获取鼠标经过位置的X、Y坐标
利用JavaScript获取鼠标经过位置的X.Y坐标方法. <!DOCTYPE html PUBLIC "-//W3C//DTD XHTML 1.0 Transitional//EN& ...
- Linux下安装和卸载jdk步骤详述
安装jdk 1.下载jdk8 jdk下载地址: http://www.oracle.com/technetwork/java/javase/downloads/jdk8-downloads-21331 ...
- 170518、FastDFS_配置文件详解
http://bbs.chinaunix.net/thread-1941456-1-1.html 首先是 tracker.conf # is this config file disabled # f ...
- CodeForces 19B Checkout Assistant
B. Checkout Assistant time limit per test 1 second memory limit per test 256 megabytes input standar ...