Prometheus 监控MySQL
0、简介
文中主要监控MySQL/MySQL主从信息
版本:mysql-5.7,mysql_exporter-0.12.1
1、mysql_exporter部署
1.下载mysql_exporter并解压
$ tar xf /opt/src/mysqld_exporter-0.12.1.linux-amd64.tar.gz

// 将mysql_exporter二进制文件拷贝至/usr/local/bin

$ cp /opt/src/mysqld_exporter-0.12.1.linux-amd64/mysqld_exporter /usr/local/bin/
2.需要授权用户给exporter使用
> CREATE USER 'exporter'@'localhost' IDENTIFIED BY 'abc12345' WITH MAX_USER_CONNECTIONS 5;

// 可查看主从运行情况查看线程,及所有数据库。

> GRANT PROCESS, REPLICATION CLIENT, SELECT ON *.* TO 'exporter'@'localhost';
为该用户设置最大连接数为了避免监控数据过大导致服务器超载
3.修改mysql配置文件,添加刚才创建的exporter用户和密码
$ vim /etc/my.cnf

[client]

user=exporter

password=abc12345
4.启动exporter客户端,需指定mysql配置文件,读取exporter用户和密码
$ mysqld_exporter --config.my-cnf=/etc/my.cnf

常用参数:

// 选择采集innodb

--collect.info_schema.innodb_cmp

// innodb存储引擎状态

--collect.engine_innodb_status

// 指定配置文件

--config.my-cnf="/etc/my.cnf"
5.添加system系统服务
$ vim /usr/lib/systemd/system/mysql_exporter.service

[Unit]

Description=Prometheus

Wants=network-online.target

After=network-online.target

[Service]

User=root

Group=root

Type=simple

ExecStart=/usr/local/bin/mysqld_exporter \

--config.my-cnf=/etc/my.cnf

[Install]

WantedBy=multi-user.target
6.启动添加的system服务
$ systemctl daemon-reload

$ systemctl start mysql_exporter.service

$ systemctl enable mysql_exporter.service

// mysql_export默认端口 - 9104

$ netstat -lntup | grep "9104"

tcp6       0      0 :::9104                 :::*                    LISTEN      34137/mysqld_export
7.curl查看捕获mysql数据
curl http://localhost:9104/metrics
8.prometheus配置加入mysql节点
$ vim /usr/local/prometheus/prometheus.yml

  - job_name: 'mysql'

    scrape_interval: 5s

    # 静态添加node

    static_configs:

      - targets: ['10.4.7.12:9104']
9.查看监控端是否接入
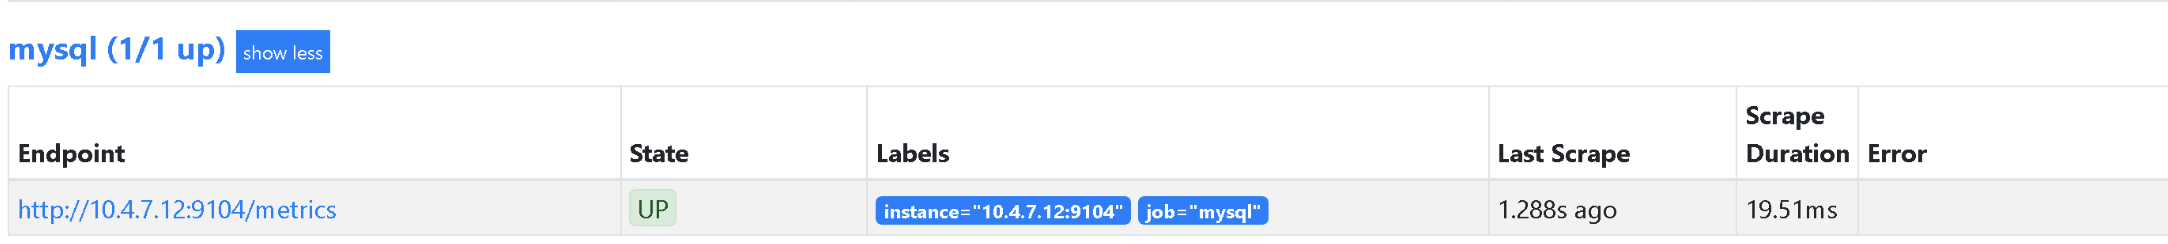
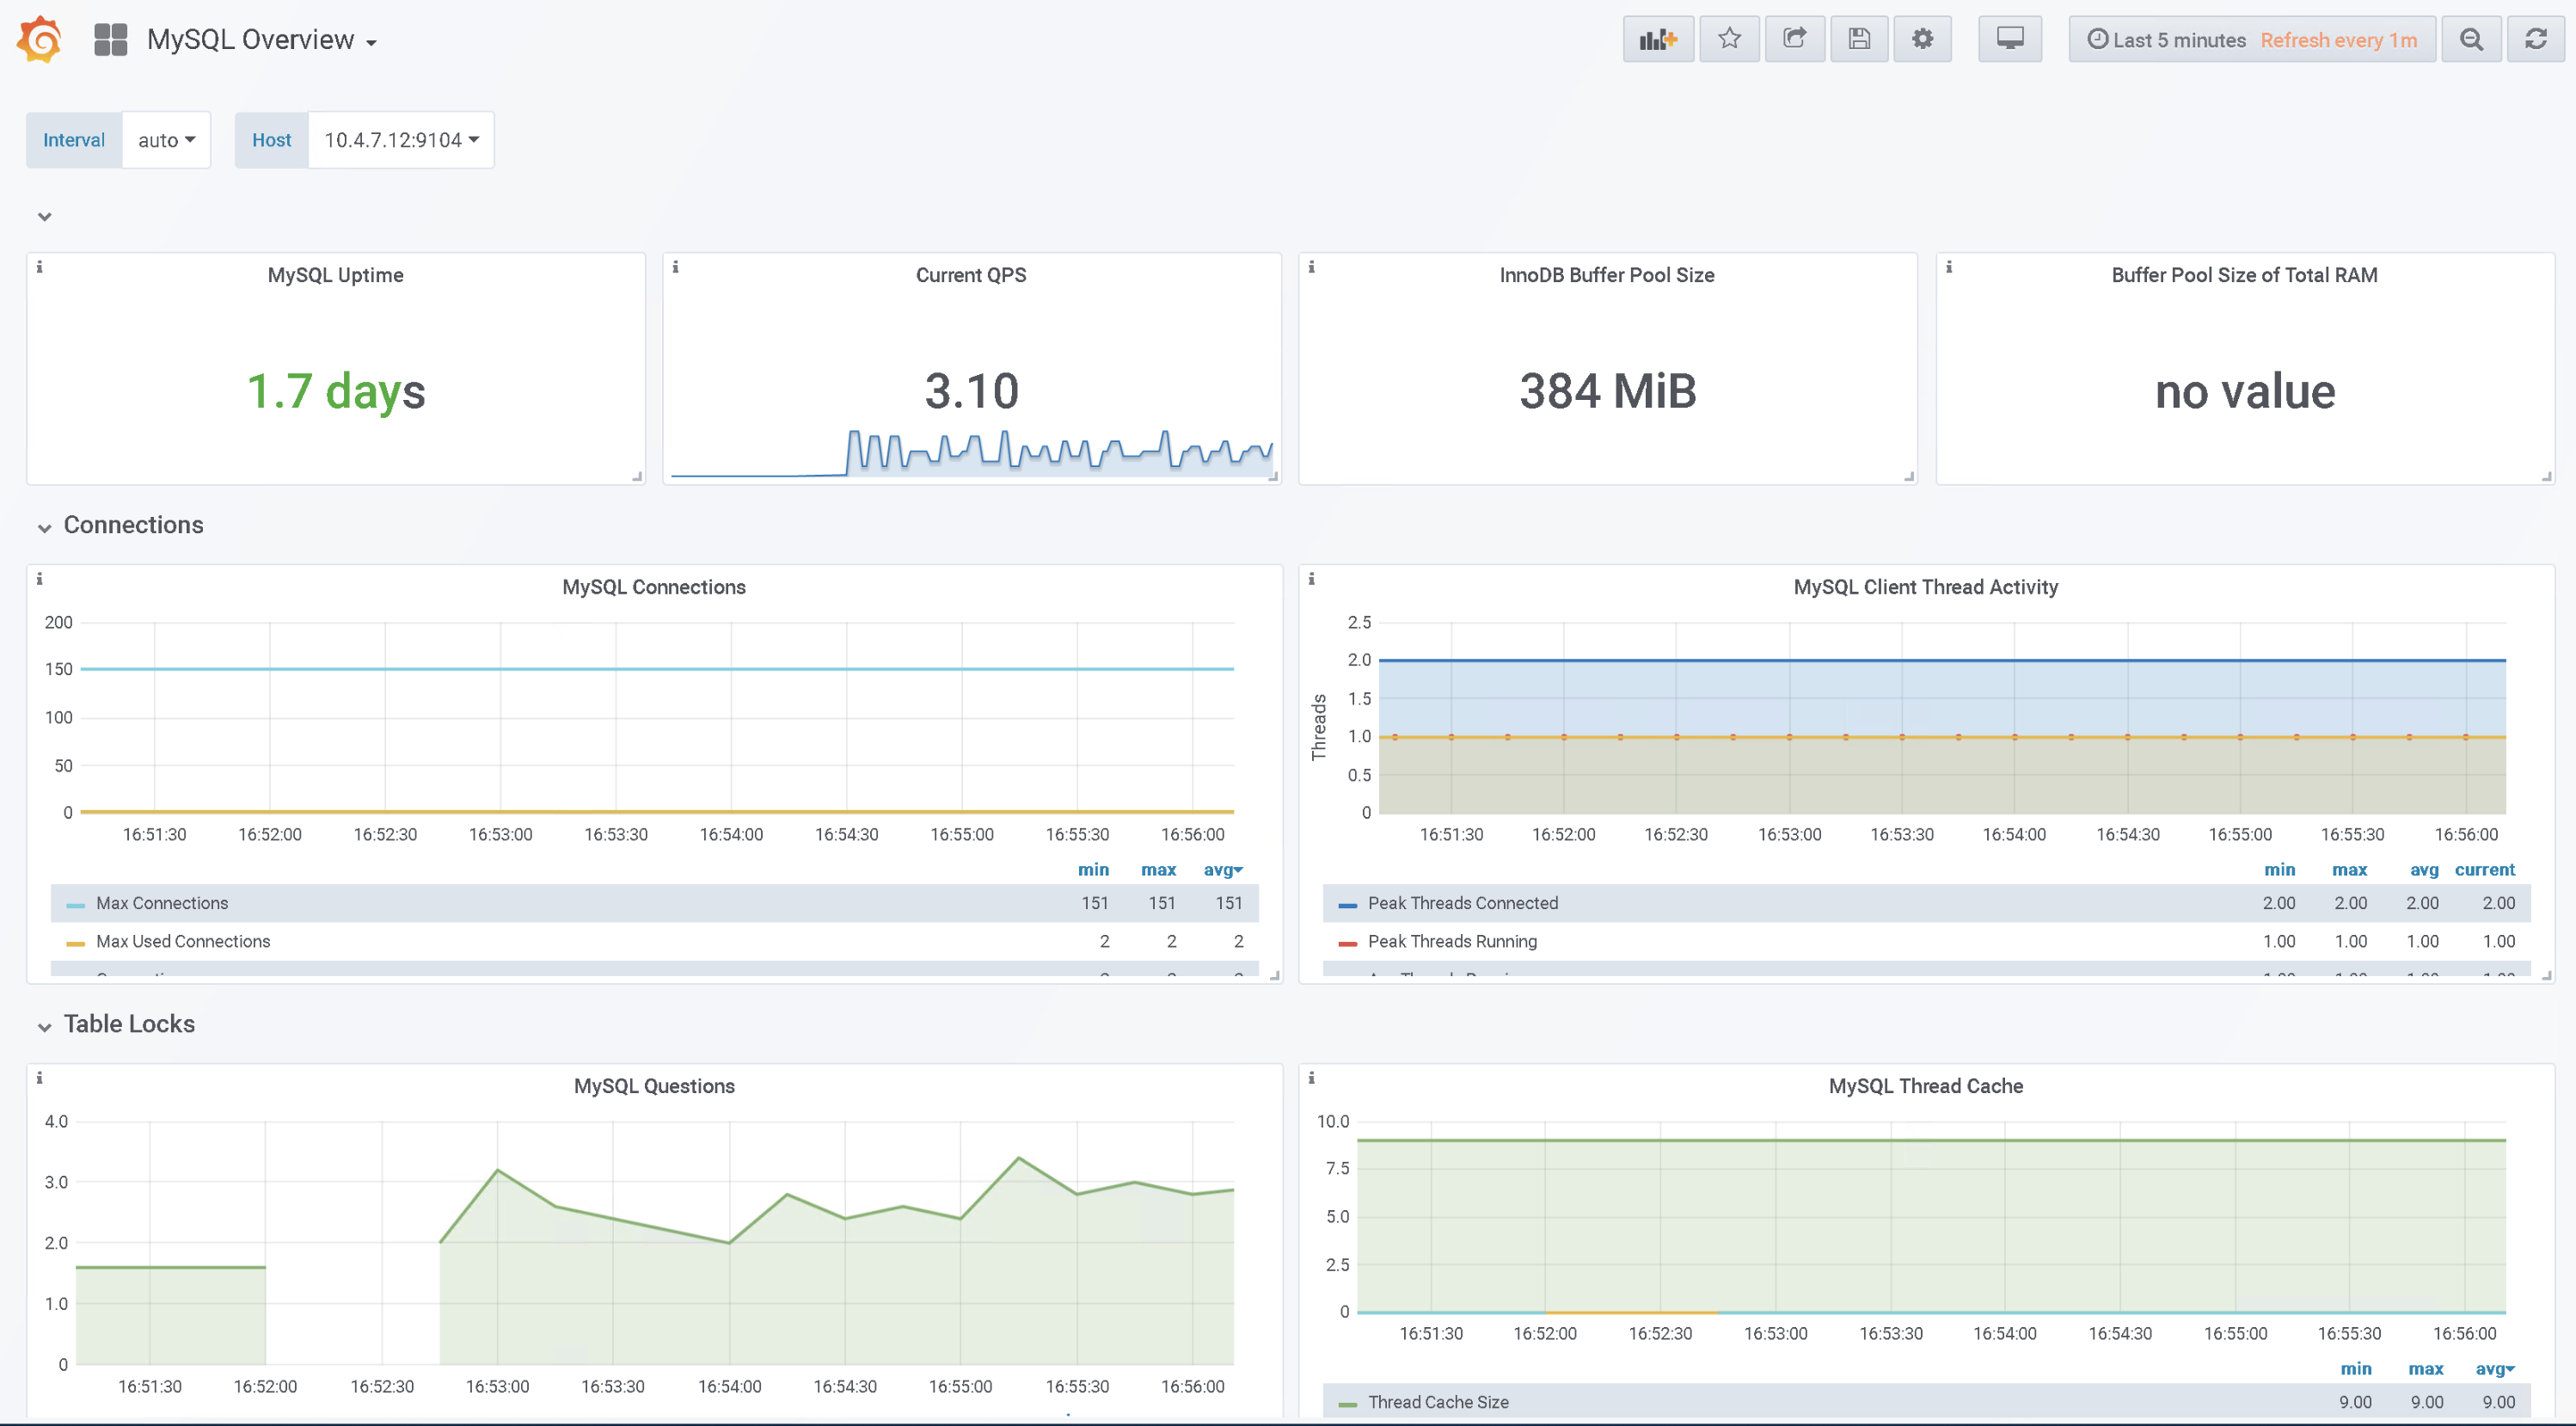
10.Granfana导入MySQL监控图表
去grafana dashboard下载对应的图表或者直接在grafana导入图表输入ID下载
图表下载地址:https://grafana.com/grafana/dashboards/7362
图表ID:11796
11.查看mysql dashboard
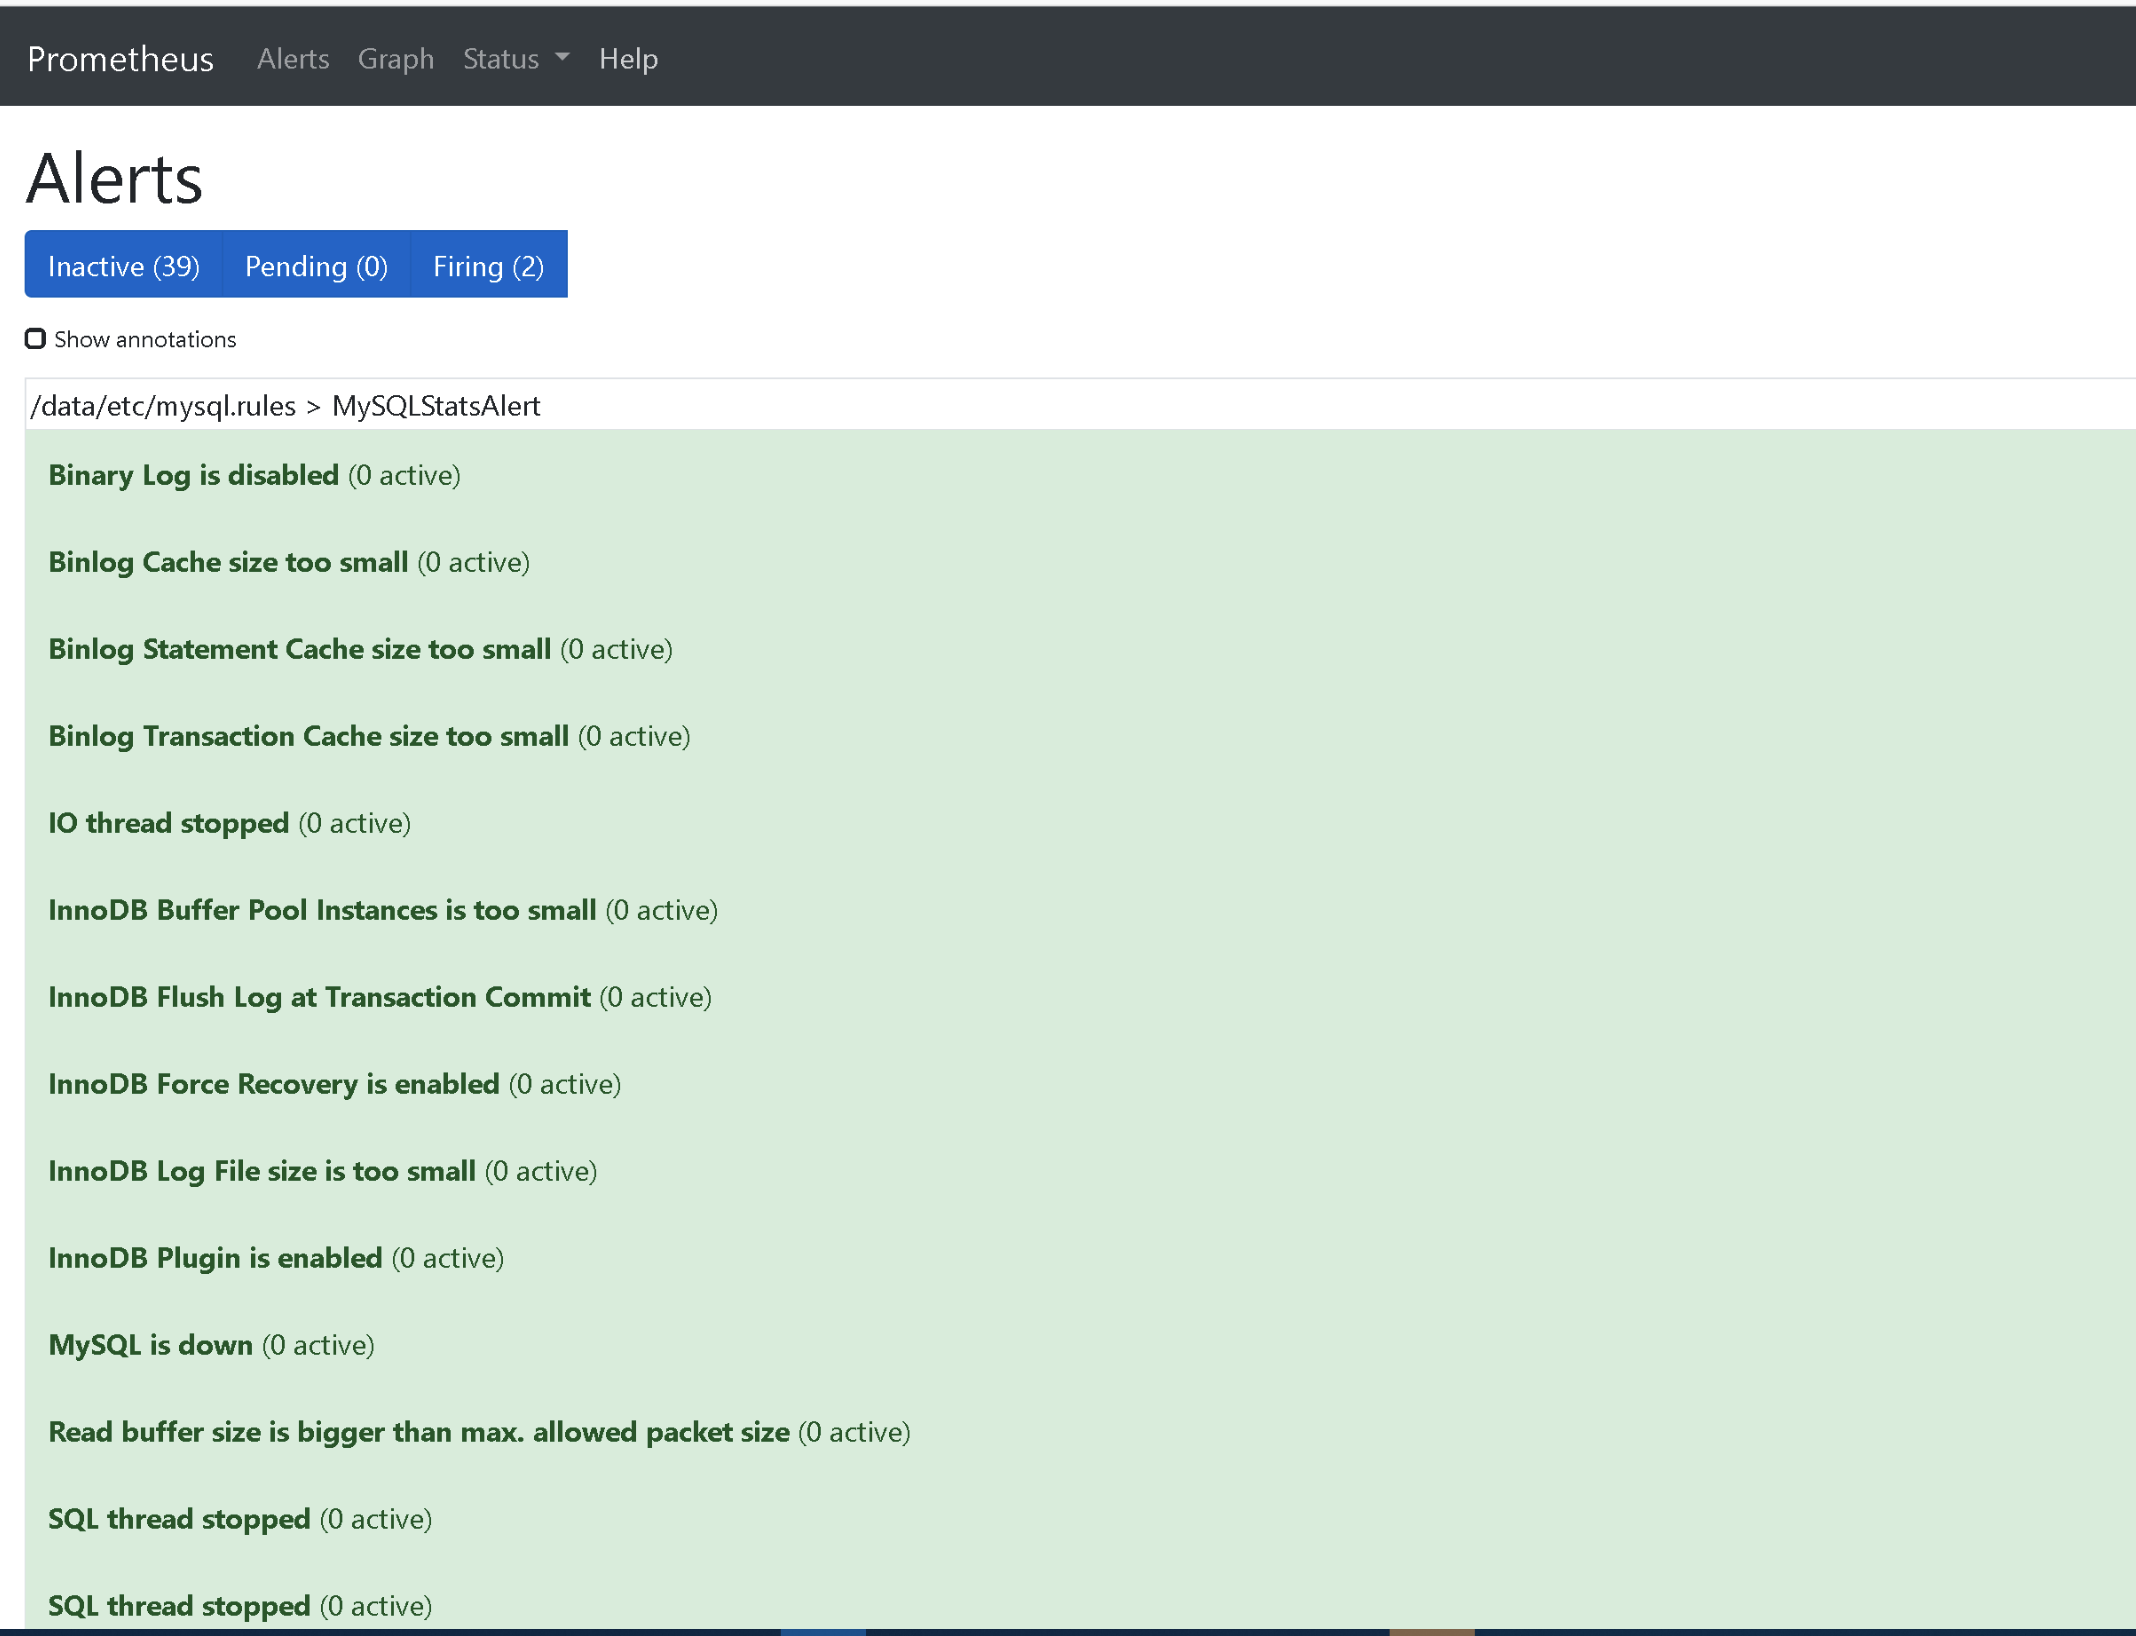
2、mysql报警规则
1.配置alertmanager报警,添加prometheus配置:
rule_files:

  ...

  - "/data/etc/mysql*.rules"
2.配置mysql报警规则
groups:

- name: MySQLStatsAlert

  rules:

  - alert: MySQL is down

    expr: mysql_up == 0

    for: 1m

    labels:

      severity: critical

    annotations:

      summary: "Instance {{ $labels.instance }} MySQL is down"

      description: "MySQL database is down. This requires immediate action!"

  - alert: open files high

    expr: mysql_global_status_innodb_num_open_files > (mysql_global_variables_open_files_limit) * 0.75

    for: 1m

    labels:

      severity: warning

    annotations:

      summary: "Instance {{ $labels.instance }} open files high"

      description: "Open files is high. Please consider increasing open_files_limit."

  - alert: Read buffer size is bigger than max. allowed packet size

    expr: mysql_global_variables_read_buffer_size > mysql_global_variables_slave_max_allowed_packet

    for: 1m

    labels:

      severity: warning

    annotations:

      summary: "Instance {{ $labels.instance }} Read buffer size is bigger than max. allowed packet size"

      description: "Read buffer size (read_buffer_size) is bigger than max. allowed packet size (max_allowed_packet).This can break your replication."

  - alert: Sort buffer possibly missconfigured

    expr: mysql_global_variables_innodb_sort_buffer_size <256*1024 or mysql_global_variables_read_buffer_size > 4*1024*1024

    for: 1m

    labels:

      severity: warning

    annotations:

      summary: "Instance {{ $labels.instance }} Sort buffer possibly missconfigured"

      description: "Sort buffer size is either too big or too small. A good value for sort_buffer_size is between 256k and 4M."

  - alert: Thread stack size is too small

    expr: mysql_global_variables_thread_stack <196608

    for: 1m

    labels:

      severity: warning

    annotations:

      summary: "Instance {{ $labels.instance }} Thread stack size is too small"

      description: "Thread stack size is too small. This can cause problems when you use Stored Language constructs for example. A typical is 256k for thread_stack_size."

  - alert: Used more than 80% of max connections limited

    expr: mysql_global_status_max_used_connections > mysql_global_variables_max_connections * 0.8

    for: 1m

    labels:

      severity: warning

    annotations:

      summary: "Instance {{ $labels.instance }} Used more than 80% of max connections limited"

      description: "Used more than 80% of max connections limited"

  - alert: InnoDB Force Recovery is enabled

    expr: mysql_global_variables_innodb_force_recovery != 0

    for: 1m

    labels:

      severity: warning

    annotations:

      summary: "Instance {{ $labels.instance }} InnoDB Force Recovery is enabled"

      description: "InnoDB Force Recovery is enabled. This mode should be used for data recovery purposes only. It prohibits writing to the data."

  - alert: InnoDB Log File size is too small

    expr: mysql_global_variables_innodb_log_file_size < 16777216

    for: 1m

    labels:

      severity: warning

    annotations:

      summary: "Instance {{ $labels.instance }} InnoDB Log File size is too small"

      description: "The InnoDB Log File size is possibly too small. Choosing a small InnoDB Log File size can have significant performance impacts."

  - alert: InnoDB Flush Log at Transaction Commit

    expr: mysql_global_variables_innodb_flush_log_at_trx_commit != 1

    for: 1m

    labels:

      severity: warning

    annotations:

      summary: "Instance {{ $labels.instance }} InnoDB Flush Log at Transaction Commit"

      description: "InnoDB Flush Log at Transaction Commit is set to a values != 1. This can lead to a loss of commited transactions in case of a power failure."

  - alert: Table definition cache too small

    expr: mysql_global_status_open_table_definitions > mysql_global_variables_table_definition_cache

    for: 1m

    labels:

      severity: page

    annotations:

      summary: "Instance {{ $labels.instance }} Table definition cache too small"

      description: "Your Table Definition Cache is possibly too small. If it is much too small this can have significant performance impacts!"

  - alert: Table open cache too small

    expr: mysql_global_status_open_tables >mysql_global_variables_table_open_cache * 99/100

    for: 1m

    labels:

      severity: page

    annotations:

      summary: "Instance {{ $labels.instance }} Table open cache too small"

      description: "Your Table Open Cache is possibly too small (old name Table Cache). If it is much too small this can have significant performance impacts!"

  - alert: Thread stack size is possibly too small

    expr: mysql_global_variables_thread_stack < 262144

    for: 1m

    labels:

      severity: page

    annotations:

      summary: "Instance {{ $labels.instance }} Thread stack size is possibly too small"

      description: "Thread stack size is possibly too small. This can cause problems when you use Stored Language constructs for example. A typical is 256k for thread_stack_size."

  - alert: InnoDB Buffer Pool Instances is too small

    expr: mysql_global_variables_innodb_buffer_pool_instances == 1

    for: 1m

    labels:

      severity: page

    annotations:

      summary: "Instance {{ $labels.instance }} InnoDB Buffer Pool Instances is too small"

      description: "If you are using MySQL 5.5 and higher you should use several InnoDB Buffer Pool Instances for performance reasons. Some rules are: InnoDB Buffer Pool Instance should be at least 1 Gbyte in size. InnoDB Buffer Pool Instances you can set equal to the number of cores of your machine."

  - alert: InnoDB Plugin is enabled

    expr: mysql_global_variables_ignore_builtin_innodb == 1

    for: 1m

    labels:

      severity: page

    annotations:

      summary: "Instance {{ $labels.instance }} InnoDB Plugin is enabled"

      description: "InnoDB Plugin is enabled"

  - alert: Binary Log is disabled

    expr: mysql_global_variables_log_bin != 1

    for: 1m

    labels:

      severity: warning

    annotations:

      summary: "Instance {{ $labels.instance }} Binary Log is disabled"

      description: "Binary Log is disabled. This prohibits you to do Point in Time Recovery (PiTR)."

  - alert: Binlog Cache size too small

    expr: mysql_global_variables_binlog_cache_size < 1048576

    for: 1m

    labels:

      severity: page

    annotations:

      summary: "Instance {{ $labels.instance }} Binlog Cache size too small"

      description: "Binlog Cache size is possibly to small. A value of 1 Mbyte or higher is OK."

  - alert: Binlog Statement Cache size too small

    expr: mysql_global_variables_binlog_stmt_cache_size <1048576 and mysql_global_variables_binlog_stmt_cache_size > 0

    for: 1m

    labels:

      severity: page

    annotations:

      summary: "Instance {{ $labels.instance }} Binlog Statement Cache size too small"

      description: "Binlog Statement Cache size is possibly to small. A value of 1 Mbyte or higher is typically OK."

  - alert: Binlog Transaction Cache size too small

    expr: mysql_global_variables_binlog_cache_size  <1048576

    for: 1m

    labels:

      severity: page

    annotations:

      summary: "Instance {{ $labels.instance }} Binlog Transaction Cache size too small"

      description: "Binlog Transaction Cache size is possibly to small. A value of 1 Mbyte or higher is typically OK."

  - alert: Sync Binlog is enabled

    expr: mysql_global_variables_sync_binlog == 1

    for: 1m

    labels:

      severity: page

    annotations:

      summary: "Instance {{ $labels.instance }} Sync Binlog is enabled"

      description: "Sync Binlog is enabled. This leads to higher data security but on the cost of write performance."

  - alert: IO thread stopped

    expr: mysql_slave_status_slave_io_running != 1

    for: 1m

    labels:

      severity: critical

    annotations:

      summary: "Instance {{ $labels.instance }} IO thread stopped"

      description: "IO thread has stopped. This is usually because it cannot connect to the Master any more."

  - alert: SQL thread stopped

    expr: mysql_slave_status_slave_sql_running == 0

    for: 1m

    labels:

      severity: critical

    annotations:

      summary: "Instance {{ $labels.instance }} SQL thread stopped"

      description: "SQL thread has stopped. This is usually because it cannot apply a SQL statement received from the master."

  - alert: SQL thread stopped

    expr: mysql_slave_status_slave_sql_running != 1

    for: 1m

    labels:

      severity: critical

    annotations:

      summary: "Instance {{ $labels.instance }} Sync Binlog is enabled"

      description: "SQL thread has stopped. This is usually because it cannot apply a SQL statement received from the master."

  - alert: Slave lagging behind Master

    expr: rate(mysql_slave_status_seconds_behind_master[1m]) >30

    for: 1m

    labels:

      severity: warning

    annotations:

      summary: "Instance {{ $labels.instance }} Slave lagging behind Master"

      description: "Slave is lagging behind Master. Please check if Slave threads are running and if there are some performance issues!"

  - alert: Slave is NOT read only(Please ignore this warning indicator.)

    expr: mysql_global_variables_read_only != 0

    for: 1m

    labels:

      severity: page

    annotations:

      summary: "Instance {{ $labels.instance }} Slave is NOT read only"

      description: "Slave is NOT set to read only. You can accidentally manipulate data on the slave and get inconsistencies..."
3.最后需要重启prometheus即可
Prometheus 监控MySQL的更多相关文章
- Grafana+Prometheus 监控 MySQL
转自:Grafana+Prometheus 监控 MySQL 架构图 环境 IP 环境 需装软件 192.168.0.237 mysql-5.7.20 node_exporter-0.15.2.lin ...
- Prometheus 监控Mysql服务器及Grafana可视化
Prometheus 监控Mysql服务器及Grafana可视化. mysql_exporter:用于收集MySQL性能信息. 使用版本 mysqld_exporter 0.11.0 官方地址 使用文 ...
- 使用 Docker 部署 Grafana + Prometheus 监控 MySQL 数据库
一.背景 在平时开发过程当中需要针对 MySQL 数据库进行监控,这里我们可以使用 Grafana 和 Prometheus 来实现监控功能.Grafana 是一款功能强大的仪表盘面板,支持多种数据源 ...
- 采用prometheus 监控mysql
1. prometheus 是什么 开源的系统监控和报警工具,监控项目的流量.内存量.负载量等实时数据. 它通过直接或短时jobs中介收集监控数据,在本地存储所有收集到的数据,并且通过定义好的rule ...
- Grafana+Prometheus监控mysql性能
#cmd /usr/local 今天讲一下如何监控服务器中的mysql数据库的性能 一.数据库操作 1.mysql启动 #service mysqld start #启动数据库 #service my ...
- 手把手教你使用 Prometheus 监控 MySQL 与 MariaDB.md
概述 MySQL 是常用的关系型数据库,MariaDB 作为 MySQL 的分支版本,兼容 MySQL 协议,也越来越流行.在 Kubernetes 环境中如何使用 Prometheus 来对它们进行 ...
- Grafan+Prometheus 监控 MySQL
架构图 环境 IP 环境 需装软件 192.168.0.237 mysql-5.7.20 node_exporter-0.15.2.linux-amd64.tar.gz mysqld_exporter ...
- prometheus监控mysql
创建一个用于mysqld_exporter连接到MySQL的用户并赋予所需的权限 mysql> GRANT REPLICATION CLIENT, PROCESS ON *.* TO '; my ...
- 使用Prometheus监控SpringBoot应用
通过之前的文章我们使用Prometheus监控了应用服务器node_exporter,数据库mysqld_exporter,今天我们来监控一下你的应用.(本文以SpringBoot 2.1.9.REL ...
随机推荐
- 常用的 Git 命令与场景
Git 分布式版本控制系统 它拥有完整的版本控制功能,能够解决多人协作的问题 将自己的代码同步到 Github 上能够提升开发效率 git 会记录你每一次的版本修改操作 常用的 Git 操作 # 指定 ...
- 最长公共前缀(py)
编写一个函数来查找字符串数组中的最长公共前缀. 如果不存在公共前缀,返回空字符串 "". 示例 1: 输入: ["flower","flow" ...
- 网络安全从入门到精通(第二章-3)后端基础SQL— MySQL高级查询与子查询
本文内容: MySQL的基础查询语句 链接查询 联合查询 子查询 渗透测试常用函数 1,MySQL基础查询语句: select * from 表 order by ASC/DESC; ASC:从小到 ...
- identityserver4源码解析_2_元数据接口
目录 identityserver4源码解析_1_项目结构 identityserver4源码解析_2_元数据接口 identityserver4源码解析_3_认证接口 identityserver4 ...
- hdu1908 逆序对
题目链接:https://www.luogu.com.cn/problem/P1908 这个题不要以为拿到手就可以树状数组秒,本题的数据范围是1e9显然简单的树状数组是空间不够的,点个数有5e5,所以 ...
- Cesium 源码笔记[1] Viewer模块实例化的大致过程
我原本想写日记的,但是不太现实. 源码下载 源码可以从源码包和发行包中的Source目录中获取. Cesium的模块化机制从1.63版本开始,由原来的RequireJs变为ES6.但有可能是原先设计耦 ...
- Visdom 介绍 | 二
用于创建,组织和共享实时丰富数据可视化的灵活工具.支持Python. 概述 概念 设置 用法 API 注意事项 贡献 API 要快速了解visdom的功能,请查看example目录,或阅读以下详细信息 ...
- 一夜搞懂 | JVM 类加载机制
前言 本文已经收录到我的Github个人博客,欢迎大佬们光临寒舍: 我的GIthub博客 学习导图 一.为什么要学习类加载机制? 今天想跟大家唠嗑唠嗑Java的类加载机制,这是Java的一个很重要的创 ...
- iOS 页面流畅技巧(2)
一.屏幕显示图像的原理 首先从过去的 CRT 显示器原理说起.CRT 的电子枪按照上面方式,从上到下一行行扫描,扫描完成后显示器就呈现一帧画面,随后电子枪回到初始位置继续下一次扫描.为了把显示器的显示 ...
- WebView的基本使用及相关特性
WebView 是一个显示网页内容的组件,可以显示网络上的一些在线内容并且可以作为 Web 浏览器滚动显示的内容,它使用 WebKit作为渲染引擎来显示网页,里面包括放大.缩小.执行文本搜索等进行前后 ...