Kibana+X-Pack
Kibana+X-Pack介绍使用(全)
Kibana是一个为 ElasticSearch 提供的数据分析的 Web 接口。可使用它对日志进行高效的搜索、可视化、分析等各种操作。Kibana目前最新的版本5.0.2,回顾一下Kibana 3和Kibana 4的界面。
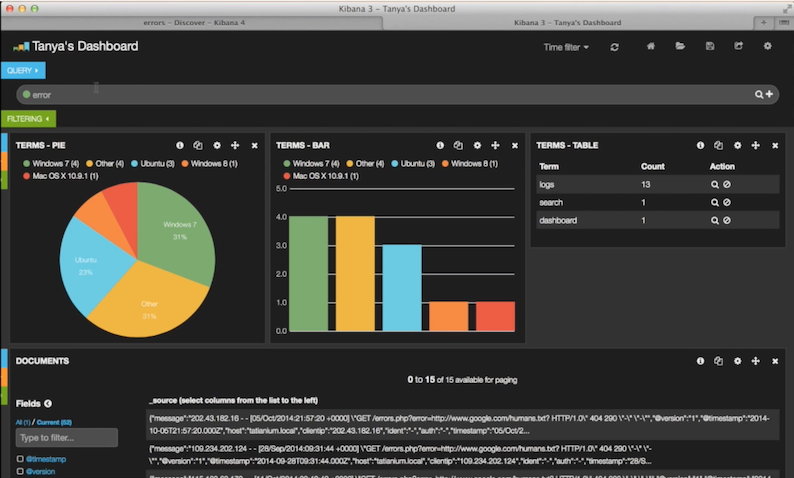
下面的图展示的是Kibana 3的界面,所有的仪表盘直接放置主页。
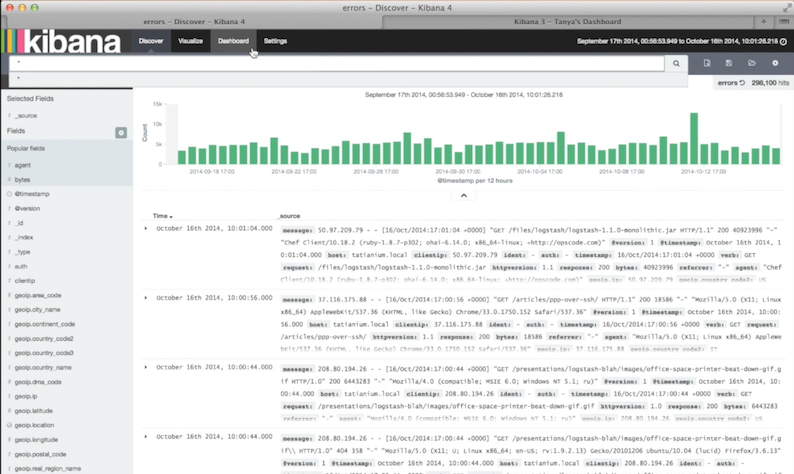
下面的图展示的是Kibana 4的界面,和Kibana 3最大的区别是将原来的主体分成三个部分,分别是发现页、可视化、仪表盘。
下面是目前Kibana 5最新版本的界面。相比较Kibana 4除了界面的风格变化,最主要是功能栏上添加了Timeline、Management和Dev Tools选项。

Discover
You can interactively explore your data from the Discover page. You have access to every document in every index that matches the selected index pattern. You can submit search queries, filter the search results, and view document data. You can also see the number of documents that match the search query and get field value statistics. If a time field is configured for the selected index pattern, the distribution of documents over time is displayed in a histogram at the top of the page.
从发现页可以交互地探索ES的数据。可以访问与所选索引模式相匹配的每一个索引中的每一个文档。您可以提交搜索查询、筛选搜索结果和查看文档数据。还可以看到匹配搜索查询和获取字段值统计的文档的数量。如果一个时间字段被配置为所选择的索引模式,则文档的分布随着时间的推移显示在页面顶部的直方图中。

Visualize
Visualize enables you to create visualizations of the data in your Elasticsearch indices. You can then build dashboards that display related visualizations.Kibana visualizations are based on Elasticsearch queries. By using a series of Elasticsearch aggregations to extract and process your data, you can create charts that show you the trends, spikes, and dips you need to know about.You can create visualizations from a search saved from Discover or start with a new search query.
可视化能使你创造你的Elasticsearch指标数据的可视化。然后你可以建立仪表板显示相关的可视化。Kibana的可视化是基于Elasticsearch查询。通过一系列的Elasticsearch聚合提取和处理您的数据,您可以创建图表显示你需要知道的关于趋势,峰值和骤降。您可以从搜索保存的搜索中创建可视化或从一个新的搜索查询开始。

Dashboard
A Kibana dashboard displays a collection of saved visualizations. You can arrange and resize the visualizations as needed and save dashboards so they be reloaded and shared.
一个仪表板显示Kibana保存的一系列可视化。你可以根据需要安排和调整可视化,并保存仪表盘,可以被加载和共享。

Monitoring
从图中可以发现,默认Kibana是没有该选项的。其实,Monitoring是由X-Pack集成提供的。
The X-Pack monitoring components enable you to easily monitor Elasticsearch through Kibana. You can view cluster health and performance in real time as well as analyze past cluster, index, and node metrics. In addition, you can monitor the performance of Kibana itself.When you install X-Pack on your cluster, a monitoring agent runs on each node to collect and index metrics from Elasticsearch. With X-Pack installed in Kibana, you can then view the monitoring data through a set of specialized dashboards.
该X-pack监控组件使您可以通过Kibana轻松地监控ElasticSearch。您可以实时查看集群的健康和性能,以及分析过去的集群、索引和节点度量。此外,您可以监视Kibana本身性能。当你安装X-pack在群集上,监控代理运行在每个节点上收集和指数指标从Elasticsearch。安装在X-pack在Kibana上,您可以查看通过一套专门的仪表板监控数据。
我们可以回顾安装过程:ElasticSearch 5学习——安装Elasticsearch、Kibana和X-Pack,可以发现,在安装X-pack的时候分别在ElasticSearch根目录和Kibana根目录下操作。

Graph
The X-Pack graph capabilities enable you to discover how items in an Elasticsearch index are related. You can explore the connections between indexed terms and see which connections are the most meaningful. This can be useful in a variety of applications, from fraud detection to recommendation engines.For example, graph exploration could help you uncover website vulnerabilities that hackers are targeting so you can harden your website. Or, you might provide graph-based personalized recommendations to your e-commerce customers.X-Pack provides a simple, yet powerful graph exploration API, and an interactive graph visualization tool for Kibana. Both work with out of the box with existing Elasticsearch indices—you don’t need to store any additional data to use the X-Pack graph features.
X-Pack图的能力使你发现一个Elasticsearch索引项是如何相关联的。你可以探索索引条款之间的连接,看看哪些连接是最有意义的。从欺诈检测到推荐引擎,对各种应用中这都是有用的,例如,图的探索可以帮助你发现网站上黑客的目标的漏洞,所以你可以硬化你的网站。或者,您可以为您的电子商务客户提供基于图表的个性化推荐。X-pack提供简单,但功能强大的图形开发API,和Kibana交互式图形可视化工具。使用X-pack图有工作与开销与现有Elasticsearch指标你不需要任何额外的数据存储的特征。

Timelion
Timelion is a time series data visualizer that enables you to combine totally independent data sources within a single visualization. It’s driven by a simple expression language you use to retrieve time series data, perform calculations to tease out the answers to complex questions, and visualize the results.
Timelion是一个时间序列数据的可视化,可以结合在一个单一的可视化完全独立的数据源。它是由一个简单的表达式语言驱动的,你用来检索时间序列数据,进行计算,找出复杂的问题的答案,并可视化的结果。
这个功能由一系列的功能函数组成,同样的查询的结果,也可以通过Dashboard显示查看。

Management
The Management application is where you perform your runtime configuration of Kibana, including both the initial setup and ongoing configuration of index patterns, advanced settings that tweak the behaviors of Kibana itself, and the various "objects" that you can save throughout Kibana such as searches, visualizations, and dashboards.This section is pluginable, so in addition to the out of the box capabitilies, packs such as X-Pack can add additional management capabilities to Kibana.
管理中的应用是在你执行你的运行时配置kibana,包括初始设置和指标进行配置模式,高级设置,调整自己的行为和Kibana,各种“对象”,你可以查看保存在整个Kibana的内容如发现页,可视化和仪表板。
这部分是pluginable,除此之外,X-pack可以给Kibana增加额外的管理能力。
You can use X-Pack Security to control what Elasticsearch data users can access through Kibana.When you install X-Pack, Kibana users have to log in. They need to have the kibana_user role as well as access to the indices they will be working with in Kibana.If a user loads a Kibana dashboard that accesses data in an index that they are not authorized to view, they get an error that indicates the index does not exist. X-Pack Security does not currently provide a way to control which users can load which dashboards.
你可以使用X-pack安全控制哪些用户可以访问Elasticsearch数据通过Kibana。当你安装X-pack,Kibana用户登录。他们需要有kibana_user作用以及获得的指标,他们将在Kibana的工作。如果用户加载Kibana仪表板,访问数据的一个索引,他们未被授权查看,他们得到一个错误,表明指数不存在。X-pack安全目前并不提供一种方法来控制哪些用户可以负荷的仪表板。

Dev Tools
原先的交互式控制台Sense,使用户方便的通过浏览器直接与Elasticsearch进行交互。从Kibana 5开始改名并直接内建在Kibana,就是Dev Tools选项。
注意如果是Kibana 5以上,不能通过以下命令安装Sense。(踩过的坑)
./bin/kibana plugin --install elastic/sense或者
./bin/kibana-plugin install elastic/sense instead
总结
内容比较简单,主要是对Kibana工具的整体功能总结,方便接下来对ElasticSearch 5的学习,其中X-Pack主要是添加身份权限的验证,以及原先需要安装其他各种Marvel、Hand等各种功能插件添加到Kibana上使用才能使用的功能。
学习链接:
X-Pack:https://www.elastic.co/guide/en/x-pack/current/xpack-introduction.html
Kibana:https://www.elastic.co/guide/en/kibana/current/introduction.html
Kibana+X-Pack的更多相关文章
- Html Agility Pack 解析Html
Hello 好久不见 哈哈,今天给大家分享一个解析Html的类库 Html Agility Pack.这个适用于想获取某网页里面的部分内容.今天就拿我的Csdn的博客列表来举例. 打开页面 用Fir ...
- Ubuntu 14.04 中 安装elasticsearch2.*+logstash2.*+kibana
在Ubuntu 14.04 上安装单机版ELK 2.*(脚本化) 1.判断是否为root权限 if [ "${UID}" -ne 0 ]; then echo "You ...
- ElasticSearch 5学习(2)——Kibana+X-Pack介绍使用(全)
Kibana是一个为 ElasticSearch 提供的数据分析的 Web 接口.可使用它对日志进行高效的搜索.可视化.分析等各种操作.Kibana目前最新的版本5.0.2,回顾一下Kibana 3和 ...
- ElasticSearch 5学习(1)——安装Elasticsearch、Kibana和X-Pack
安装准备: 安装Elasticsearch唯一的要求是安装官方新版的Java,包括对应的Jdk. 安装Elasticsearch 首先到官网下载最新版本的Elasticsearch压缩包. 可以使用命 ...
- logstash+elasticsearch+kibana管理日志(安装)
logstash1.先安装jdk2.wget https://download.elastic.co/logstash/logstash/logstash-2.4.0.tar.gz tar -xzvf ...
- kubernetes部署Fluentd+Elasticsearch+kibana 日志收集系统
一.介绍 1. Fluentd 是一个开源收集事件和日志系统,用与各node节点日志数据的收集.处理等等.详细介绍移步-->官方地址:http://fluentd.org/ 2. Elastic ...
- ELK日志系统:Filebeat使用及Kibana如何设置登录认证
根据elastic上的说法: Filebeat is a lightweight, open source shipper for log file data. As the next-generat ...
- ElasticSearch+Kibana 索引操作( 附源码)
一 前言 ElasticiSearch 简介 ElasticSearch是一个基于Lucene的搜索服务器.它提供了一个分布式多用户能力的全文搜索引擎,基于RESTful web接口.Elastics ...
- 一次kibana服务失败的排查过程
公司在kubernetes集群上稳定运行数月的kibana服务于昨天下午突然无法正常提供服务,访问kibana地址后提示如下信息: 排查过程: 看到提示后,第一反应肯定是检查elasticsearch ...
- 关于elasticsearch和kibana的时区和日期问题
elasticsearch原生支持date类型,json格式通过字符来表示date类型.所以在用json提交日期至elasticsearch的时候,es会隐式转换,把es认为是date类型的字符串直接 ...
随机推荐
- iOS 学习 - 10下载(4) NSURLSession 会话 篇
NSURLConnection通过全局状态来管理cookies.认证信息等公共资源,这样如果遇到两个连接需要使用不同的资源配置情况时就无法解决了,但是这个问题在NSURLSession中得到了解决.N ...
- 列式存储(三)JFinal DB.tx()事务
上一篇中说道了列式存储中新增表单时后台接收数据问题,在存入数据库时一次插入多条数据,就要用到事务. JFinal中有个封装好的事务应用,用起来非常方便简单. 写法1: Db.tx(new IAtom( ...
- 赫夫曼\哈夫曼\霍夫曼编码 (Huffman Tree)
哈夫曼树 给定n个权值作为n的叶子结点,构造一棵二叉树,若带权路径长度达到最小,称这样的二叉树为最优二叉树,也称为哈夫曼树(Huffman Tree).哈夫曼树是带权路径长度最短的树,权值较大的结点离 ...
- 《AngularJS高级程序设计》学习笔记
一.AngularJS应用剖析 AngularJS存在一些最主要的构件,如模型,视图和控制器.但AngularJS中也有许多其他可供灵活使用的部件,包括模块,指令,过滤器,工厂和服务. 一 . 1 ...
- .net开发中常用的第三方组件
.net开发中常用的第三方组件 2013-05-09 09:33:32| 分类: dotnet |举报 |字号 订阅 下载LOFTER 我的照片书 | RSS.NET.dll RSS. ...
- (视频)《快速创建网站》 4.2 完结篇 – 应用运营vs.发射卫星,遥测(Telemetry) 技术
本文是<快速创建网站>系列的第10篇(完结篇),如果你还没有看过之前的内容,建议你点击以下目录中的章节先阅读其他内容再回到本文.访问本系列目录,请点击:http://devopshub.c ...
- Java for XML: JAXP、JAXB、JAXM、JAX-RPC、JAX-WS
在XML领域里,对XML文件的校验有两种方式:DTD校验.Schema校验.在Java中,对于XML的解析,有多种方式:DOM解析.SAX解析.StAX解析.结合XML和Java后,就产生了Bind技 ...
- javascript 基础教程[温故而知新一]
子曰:“温故而知新,可以为师矣.”孔子说:“温习旧知识从而得知新的理解与体会,凭借这一点就可以成为老师了.“ 尤其是咱们搞程序的人,不管是不是全栈工程师,都是集十八般武艺于一身.不过有时候有些知识如果 ...
- [转]输出带颜色的shell
格式: echo -e "\033[字背景颜色;字体颜色m字符串\033[0m" 例如: echo -e "\033[41;36m something here \033 ...
- Tomcat源码分析之—组件启动实现分析
Tomcat由多个组件组成,那么Tomcat是怎么对他们的生命周期进行管理的么,这里将从Tomcat源码去分析其生命周期的实现: Bootstrape类为Tomcat的入口,所有的组件够通过实现Lif ...