R语言低级绘图函数-rect
rect 函数用来在一张图上添加矩形,只需要指定左下角和右上角的坐标的位置,就可以画出一个矩形
基本用法:
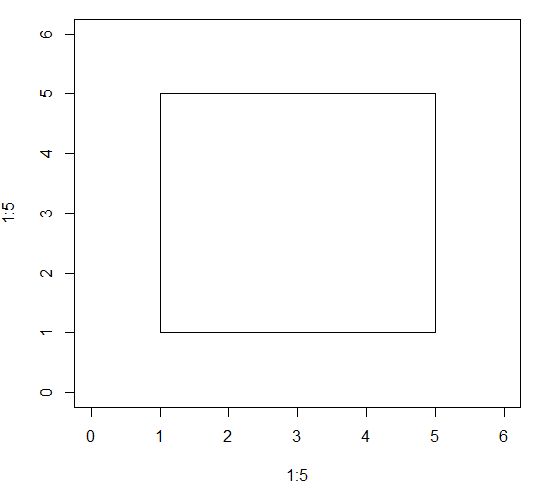
plot(1:5, 1:5, xlim = c(0,6), ylim = c (0,6), type = "n")

rect(xleft = 1, ybottom = 1, xright = 5, ytop = 5)
效果图如下:
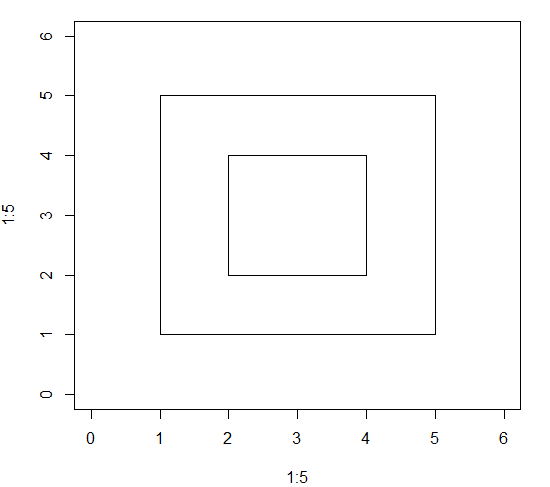
xleft, ybottom, xright, ytop 支持一次设置多个值,同时创建多个矩形,用法如下:
plot(1:5, 1:5, xlim = c(0,6), ylim = c (0,6), type = "n")

rect(xleft = c(1, 2), ybottom = c(1, 2), xright = c(5, 4), ytop = c(5, 4))
效果图如下:
参数设置:
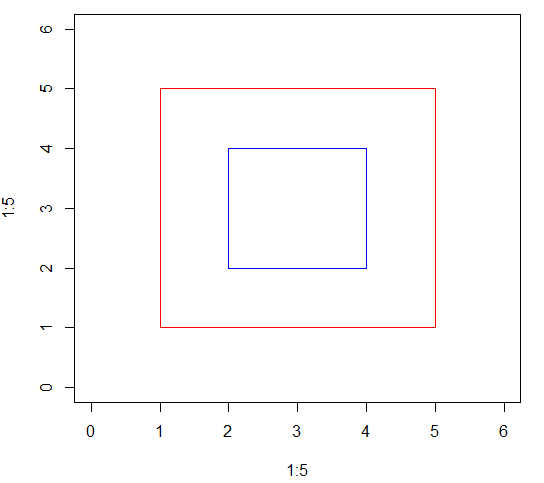
border : 设置矩形边框的颜色,默认为"black", 支持为多个矩形设置不同的值
代码示例:
plot(1:5, 1:5, xlim = c(0,6), ylim = c (0,6), type = "n")

rect(xleft = c(1, 2), ybottom = c(1, 2), xright = c(5, 4), ytop = c(5, 4), border = c("red", "blue"))
效果图如下:
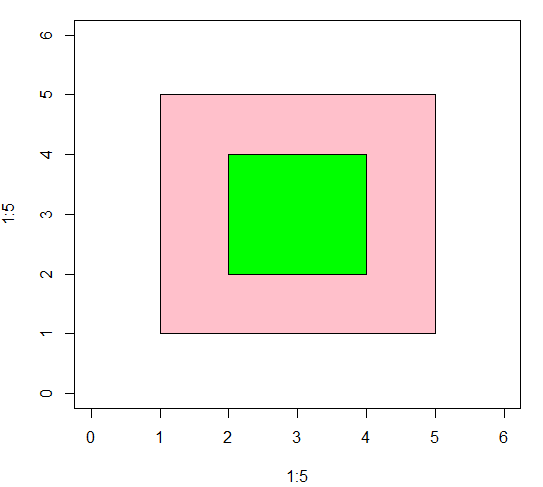
col : 设置矩形的填充色,默认为NULL, 表示无填充色,, 支持为多个矩形设置不同的值
plot(1:5, 1:5, xlim = c(0,6), ylim = c (0,6), type = "n")

rect(xleft = c(1, 2), ybottom = c(1, 2), xright = c(5, 4), ytop = c(5, 4), col = c("pink", "green"))
效果图如下:
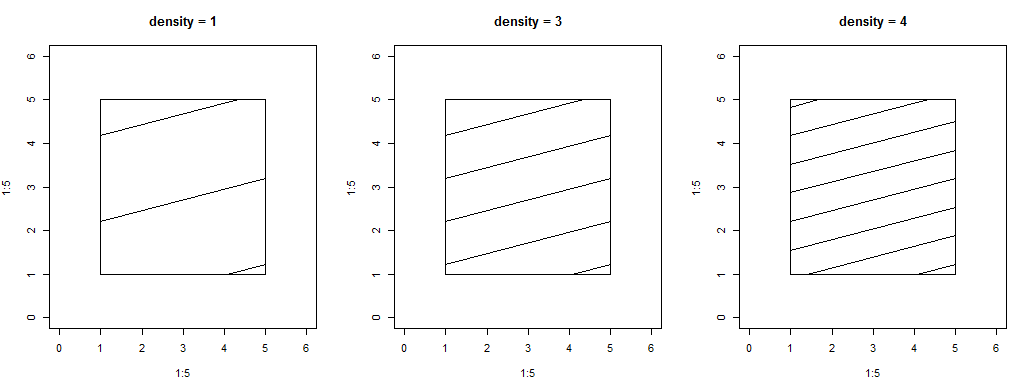
density 和 angle : 搭配使用,设置用线条填充矩形,angle 设置线条的角度,默认为45, density 设置填充线条的密度,数值越大越密集
代码示例:
par(mfrow = c(1,3))

plot(1:5, 1:5, xlim = c(0,6), ylim = c (0,6), type = "n", main = "density = 1")

rect(xleft = 1, ybottom = 1, xright = 5, ytop = 5, angle = 45, density = 1)

plot(1:5, 1:5, xlim = c(0,6), ylim = c (0,6), type = "n", main = "density = 3")

rect(xleft = 1, ybottom = 1, xright = 5, ytop = 5, angle = 45, density = 2)

plot(1:5, 1:5, xlim = c(0,6), ylim = c (0,6), type = "n", main = "density = 4")

rect(xleft = 1, ybottom = 1, xright = 5, ytop = 5, angle = 45, density = 3)
效果图如下:
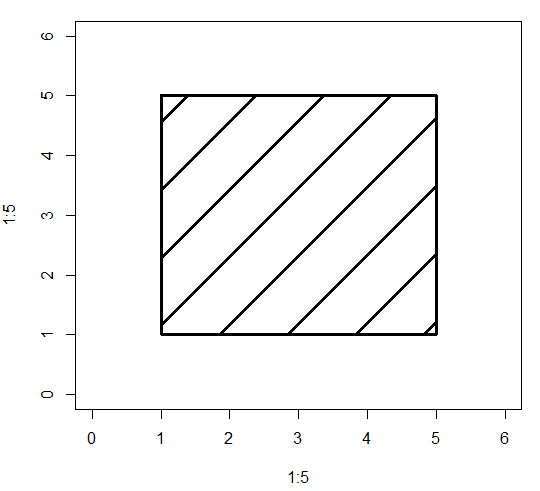
lwd: 设置矩形所有线条的宽度
代码示例:
plot(1:5, 1:5, xlim = c(0,6), ylim = c (0,6), type = "n")

rect(xleft = 1, ybottom = 1, xright = 5, ytop = 5, angle = 45, density = 2, lwd = 3)
效果图如下:
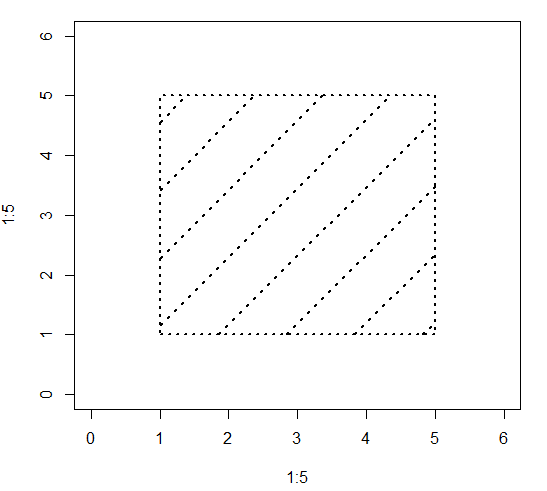
lty: 设置矩形所有线条的类型
代码示例:
plot(1:5, 1:5, xlim = c(0,6), ylim = c (0,6), type = "n")

rect(xleft = 1, ybottom = 1, xright = 5, ytop = 5, angle = 45, density = 2, lwd = 2, lty = 3)
效果图如下:
R语言低级绘图函数-rect的更多相关文章
- R语言低级绘图函数-symbols
严格意义上将symbols 并不能算是一个低级的绘图函数,因为它不仅可以在一幅已经存在的图标上添加元素,还可以创建一张新的图表 鉴于它绘图时的灵活性,我把它归入到低级绘图函数中 symbols 可以创 ...
- R语言低级绘图函数-abline 转载
abline 函数的作用是在一张图表上添加直线, 可以是一条斜线,通过x或y轴的交点和斜率来确定位置:也可以是一条水平或者垂直的线,只需要指定与x轴或y轴交点的位置就可以了 常见用法: 1)添加直线 ...
- R语言低级绘图函数-grid
grid 函数用来在一张图表上添加网格线, 基本用法:默认在添加刻度线的地方添加网格线 plot(1:5, 1:5, xlim = c(0,6), ylim = c (0,6), type = &qu ...
- R语言低级绘图函数-axis
axis函数用来在一张图表上添加轴线,区别于传统的x轴和y轴,axis 允许在上,下,左, 右4个方向添加轴线 以x轴为例,一条轴线包含3个元素,水平的一条横线,叫做axis line , 刻度线, ...
- R语言低级绘图函数-title
title 函数用来在一张图表上添加标题 基本用法: main 表示主标题,通常位于图像的上方, sub 表示副标题,位于图像的下方, xlab 表示x轴的标签,ylab 表示y轴的标签 par(om ...
- R语言低级绘图函数-text
text函数用来在一张图表上添加文字,只需要指定对应的x和y坐标,以及需要添加的文字内容就可以了 基本用法: plot(1:5, 1:5, xlim = c(0,6), ylim = c (0,6), ...
- R语言低级绘图函数-arrows
arrows 函数用来在一张图表上添加箭头,只需要分别指定起始坐标和终止坐标,就可以添加箭头了,还可以通过一些属性对箭头的形状,大小进行调整 基本用法: xo, yo 指定起始点的x和y坐标,x1, ...
- R语言低级绘图函数-abline
abline 函数的作用是在一张图表上添加直线, 可以是一条斜线,通过x或y轴的交点和斜率来确定位置:也可以是一条水平或者垂直的线,只需要指定与x轴或y轴交点的位置就可以了 常见用法: 1)添加直线 ...
- R语言低级绘图函数画个温度计
x <- 1:2 y <- runif(2,0,100) par(mar=c(4,6,2,6)) plot(x,y,type="n",xlim=c(0.5,2.5),y ...
随机推荐
- navicat 在写存储过程的时候总是说语法错误
这个时候我们在sql的头部加上 DELIMITER $$ 尾部加上 $$DELIMITER;
- SGU 114. Telecasting station 三分or找中位数
题目链接点这儿 一開始想都没想...直接上了三分...结果...sample的答案不一样...可是过了...然后又看了看. . . 发现这不就是高中或者初中出过的求中位数的题么. . .直接找到这些的 ...
- cscope使用技巧
1.执着cscope.files文件,对源码目前全文件搜索 find `pwd` -type f > cscope.files `pwd`生成当前目录的绝对路径,这样在cs命令里面就可以不用写那 ...
- 用c写了个后台扫描
/** * Notice: The program is not debug on internet and not use thread supervene. * date : 6-26 * aut ...
- Oracle“不等于号”与Null的情况
今天突然才发现,Oracle中的“不等于操作符”是忽略Null的. 比如,查询comm不等于的300的记录,我会理所当然地使用where comm != 300 预想会返回包含Null的不等于300的 ...
- 分享一个上传图片,图片压缩Unsupported Image Type解决方案
http://blog.csdn.net/frankcheng5143/article/details/53185201 *************************************** ...
- xslt循环转换子元素
转换源xml <keywords class="array"> <e type="string">e1</e> <e ...
- jQuery+Ajax获取百度百科历史上的今天
<!DOCTYPE html> <html> <head> <meta charset="UTF-8"> <title> ...
- mproxy: c 语言实现的一个最小的http代理,支持FQ
https://github.com/examplecode/mproxy mproxy 使用说明 这是一个微型的http代理服务器实现,使用c语言实现,核心代码量不足500行,不依赖任何第三方的库( ...
- spring通过配置xml文件集成quartz定时器
概述 Spring为创建Quartzde Scheduler.Trigger和JobDetail提供了方便的FactoryBean类,以便能够在Spring容器中享受注入的好处. 此外,Spring还 ...