GDI+: Curved Shapes
原文 http://www.functionx.com/vcsharp2003/gdi/curves.htm
|
Curves |
|
Introduction to Curves |
A curve is a line that joins two or more points. If only two points are involved, the line would join them. If there are three points A, B, and C, the line would start on the first point A, cross the second point B, and stop at the last point C. If more than three points are involved, the line would start on the first, cross the second, cross the third and each line before stopping on the last. The points of a curve don't have to be aligned. In fact, the whole idea of drawing a curve is to have a non-straight line that joins different non-aligned points. This can be illustrated with the following three curves labeled C1, C2, and C3:

The first curve, C1, includes only two points. The second, C2 includes three points. The third, C3, includes four points. The section between two points is called a segment. This also means that a curve can be distinguished by the number of segments it has. If a curve is made of only two points, this means that it has only one segment from the first to the second, which is the last, point. If a curve includes three points, it has two segments. The first segment spans from the first point to the second point and the second segment spans from the second point to the third point. Based on this, the number of segments of a curve is equal to the number of its points - 1.
A curve can be drawn in GDI+ using the Graphics.DrawCurve() method. When drawing a curve, you must specify how many points would be involved. This means that you can first declare an array of Point or PointF values. Because it is left up to you to decide on this issue, the Graphics class provides the following syntaxes of the DrawCurve() method:
public void DrawCurve(Pen pen, Point[] points);

public void DrawCurve(Pen pen, PointF[] points);
This version of the method takes an array of Point or PointF values as arguments. The number of members of the array depends on you. Here is an example that uses four points to draw a curve with three segments:
private void Form1_DoubleClick(object sender, System.EventArgs e)

{

	Graphics graph = this.CreateGraphics();

	Pen penCurrent = new Pen(Color.Blue);

	Point[] pt     = { new Point(40,  42), new Point(188, 246),

                                          new Point(484, 192), new Point(350,  48) };

	graph.DrawCurve(penCurrent, pt);

}
This would produce:

As you can see, when the curve is draw, a bent line crosses the intermediary points between the first and the last. To make the lines non-straight, the compiler uses a value called tension used to bend the line. If you want, you can specify the bending factor that should be applied. To do this, you would use the version version of the DrawCurve()method:
public void DrawCurve(Pen pen,

                                    Point[] points,

                                    float tension);

public void DrawCurve(Pen pen,

                                     PointF[] points,

                                    float tension);
The amount of bending to apply is passed as the tension argument. It can be passed as a decimal value >= 0.00. If this value is passed as 0.00, the lines would be drawn straight. Here is an example:
private void Form1_DoubleClick(object sender, System.EventArgs e) |
 |
This means that, if you want a real curve, either you don't pass the tension argument and use the first version of the method or you pass the tension argument as a value higher than 0.00. Here is an example:
private void Form1_DoubleClick(object sender, System.EventArgs e)

{

	Graphics graph = this.CreateGraphics();

	Pen penCurrent = new Pen(Color.Blue);

	Point[] pt     = { new Point(40,  42), new Point(188, 246),

		   new Point(484, 192), new Point(350,  48) };

	graph.DrawCurve(penCurrent, pt, 2.15F);

}
This would produce:

Both versions of the DrawCurve() method that we have used allow you to start the curve on the first point. Consider the following example that draws a curve of five points resulting in four segments:
private void Form1_DoubleClick(object sender, System.EventArgs e)

{

	Graphics graph = this.CreateGraphics();

	Pen penCurrent = new Pen(Color.Blue);

	PointF[] pt     = {   new PointF(20F,  322F), new PointF(124, 24),

		              new PointF(214, 242), new PointF(275,  28),

                        	              new PointF(380F,  322F) };

	graph.DrawCurve(penCurrent, pt);

}
This would produce:

If you want, you can start the curve on any point instead of the first. To support this, the Graphics class provides the following version of the DrawCurve() method:
public void DrawCurve(Pen pen,

                                    PointF[] points,

                                    int offset,

                                    int numberOfSegments);
The offset argument allows you to specify how many points should be skipped before starting to draw. The first conclusion is that the value of the offset must be 0 or higher. If you pass this argument as 0, the curve would be drawn from the first point. If you pass this argument as 1, the first point would not be considered in the curve. This means that the drawing of the curve would start on the second point and so on. If you pass it as 2, the first and the second point would not be part of the curve, meaning that the curve would start on the third point.
After the curve has started from the point you specify using the offset argument, you can then specify how many segments of the curve would be drawn. This number must be lower than the number of available segments, that is after subtracting the offset value from the total number of segments of the array. Here is an example:
private void Form1_DoubleClick(object sender, System.EventArgs e)

{

	Graphics graph = this.CreateGraphics();

	Pen penCurrent = new Pen(Color.Blue);

	PointF[] pt     = {   new PointF(20F,  322F), new PointF(124, 24),

		              new PointF(214, 242), new PointF(275,  28),

		              new PointF(380F,  322F) };

		              graph.DrawCurve(penCurrent, pt, 1, 2);

}
This would produce:

Once again, the compiler arranges to apply a tension when drawing the curve. If you would prefer to use straight lines or to apply a different tension than the default, you can use the following version of the Graphics.DrawCurve() method:
public void DrawCurve(Pen pen,

                                    Point[] points,

                                    int offset,

                                    int numberOfSegments,

                                    float tension);

public void DrawCurve(Pen pen,

                                    PointF[] points,

                                    int offset,

                                    int numberOfSegments,

                                    float tension);
This time, you can pass the value of the tension as 0 to get straight lines:
private void Form1_DoubleClick(object sender, System.EventArgs e)

{

	Graphics graph = this.CreateGraphics();

	Pen penCurrent = new Pen(Color.Blue);

	PointF[] pt     = {   new PointF(20F,  322F), new PointF(124, 24),

			  new PointF(214, 242), new PointF(275,  28),

			  new PointF(380F,  322F) };

	graph.DrawCurve(penCurrent, pt, 0, 4, 0);

}
This would produce:

Or you can pass the tension with any positive value of your choice. Here is an example:
private void Form1_DoubleClick(object sender, System.EventArgs e)

{

	Graphics graph = this.CreateGraphics();

	Pen penCurrent = new Pen(Color.Blue);

	PointF[] pt     = {   new PointF(20F,  322F), new PointF(124, 24),

		              new PointF(214, 242), new PointF(275,  28),

		              new PointF(380F,  322F) };

	graph.DrawCurve(penCurrent, pt, 1, 3, 1.750F);

}
This would produce:

|
A B閦ier Curve |
|
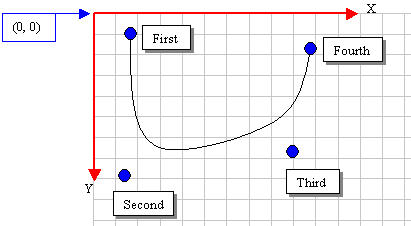
A b閦ier curve is a continuous line that is drawn using four points that are not necessarily aligned. It can be illustrated as follows:
To draw this line (with four points), the compiler would draw a curve from the first point to the fourth point. Then it would bend the curve by bringing each middle (half-center) side close to the second and the third points respectively, without touching those second and third points. For example, the above b閦ier curve could have been drawn using the following four points:
To draw a b閦ier curve, the Graphics class provides the DrawBezier() method that is overloaded in three versions whose syntaxes are: public void DrawBezier(Pen pen, Based on this, to draw a b閦ier line, you can use either four Point or PointF values or the coordinates of the four points. Here is an example: |
private void button1_Click(object sender, System.EventArgs e)

{

	Graphics graph = this.CreateGraphics();

	Pen penCurrent = new Pen(Color.Blue);

	Point pt1 = new Point(20,  12),

	         pt2 = new Point(88, 246),

	         pt3 = new Point(364, 192),

	         pt4 = new Point(250,  48);

	graph.DrawBezier(penCurrent, pt1, pt2, pt3, pt4);

}
This would produce:

|
A Series of B閦ier Curves |
The Graphics.DrawBezier() method is used to draw one b閦ier curve. If you want to draw many b閦ier curves, you can call the Graphics.DrawBeziers() method that is overloaded in two versions as follows:
public void DrawBeziers(Pen pen, Point[] points);

public void DrawBeziers(Pen pen, PointF[] points);
The DrawBeziers() method requires an array of Point of PointF values. When working with only four coordinates, the DrawBeziers() method works exactly like DrawBezier(), the different is that, while DrawBezier() expects four Point or four PointF values,DrawBeziers() expects an array of Point or PointF values. Using, DrawBeziers(), the above b閦ier curve can be drawn as follows and produce the same result:
private void button1_Click(object sender, System.EventArgs e)

{

	Graphics graph = this.CreateGraphics();

	Pen penCurrent = new Pen(Color.Blue);

	Point[] pt = { new Point(20,  12), new Point(88, 246),

		      new Point(364, 192), new Point(250,  48) };

	graph.DrawBeziers(penCurrent, pt);

}
The advantage of using DrawBeziers() is that it allows you to draw a b閦ier curve using 7Point or PointF values. Here is an example:
private void button1_Click(object sender, System.EventArgs e)

{

	Graphics graph = this.CreateGraphics();

	Pen penCurrent = new Pen(Color.Blue);

	Point[] pt = { new Point( 10,  5), new Point(340, 60),

                                      new Point(320, 148), new Point(150, 120),

	                      new Point(24, 220), new Point(250, 150),

	                      new Point(304, 240) };

	graph.DrawBeziers(penCurrent, pt);

}
This would produce:

|
A Closed Curve |
If you use either the DrawLines(), the DrawBezier() or the DrawBeziers() methods, you would get a continuous line or a series of lines that has a beginning and an end. Alternatively, GDI+ allows you to draw a series of lines but join the end of the last line to the beginning of the first line to have a closed shape. To draw this figure, you can call theGraphics.DrawClosedCurve() method that is overloaded in four versions. Two of them have the following syntaxes:
public void DrawClosedCurve(Pen pen,

                                               Point[] points);

public void DrawClosedCurve(Pen pen,

                                               PointF[] points);
These two versions are the easiest to use. They allow you to provide an array of fourPoint or four PointF values. When executed, each of these methods gets together draws a curve that passes through each coordinate and closes the curve by joining the end point to the first unless both points are the same. Here is an example:
private void Form1_DoubleClick(object sender, System.EventArgs e)

{

	Graphics graph  = this.CreateGraphics();

	Pen penCurrent = new Pen(Color.Red);

	Point[] pt           = { new Point(40,  42), new Point(188, 246),

		                new Point(484, 192), new Point(350,  48) };

	graph.DrawClosedCurve(penCurrent, pt);

}
This would produce:

The first two versions are used to draw the lines but curve them in order to make the shape appear smooth. If you want, you can draw the lines straight from one point to the next without curving them. Using this scenario, the above shape would appear as follows:

To draw this type of shape using the ClosedCurve() method, you can use one of the following versions of the method:
public void DrawClosedCurve(Pen pen,

                                               Point[] points,

                                               float tension,

                                               FillMode fillmode);

public void DrawClosedCurve(Pen pen,

                                               PointF[] points,

                                               float tension,

                                               FillMode fillmode);
These versions allow you to specify the tension and the fill mode. The tension factor allow you to specify how much curve would be applied. If this value is passed as 0.00, the points would be joined with straight lines. Otherwise, you can apply a tension using an appropriate decimal value.
The fillmode factor determines how the interior of the curve would be filled. It is controlled through the FillMode enumerator that is defined in the System.Drawing.Drawing2Dnamespace. The FillMode enumerator has two members: Alternate and Winding. Here is an example:
private void Form1_DoubleClick(object sender, System.EventArgs e)

{

	Graphics graph = this.CreateGraphics();

	Pen penCurrent = new Pen(Color.Red);

	Point[] pt     = { new Point(40,  42), new Point(188, 246),

		       new Point(484, 192), new Point(350,  48) };

	graph.DrawClosedCurve(penCurrent, pt, 0.75F, FillMode.Winding);

}
This would produce:

GDI+: Curved Shapes的更多相关文章
- Java性能提示(全)
http://www.onjava.com/pub/a/onjava/2001/05/30/optimization.htmlComparing the performance of LinkedLi ...
- 2016CVPR论文集
http://www.cv-foundation.org/openaccess/CVPR2016.py ORAL SESSION Image Captioning and Question Answe ...
- CVPR2016 Paper list
CVPR2016 Paper list ORAL SESSIONImage Captioning and Question Answering Monday, June 27th, 9:00AM - ...
- WPF GDI+ bitmap.save 一般性错误
做水印图片的时候,发现WPF的System.Windows.Shapes类有绘制直线,椭圆等形状.却没有绘字符串的类. 无奈之下又用回GDI+ 发生的GDI+一般性错误初步估计的线程的原因. 在loa ...
- .NET中的GDI+
GDI:Graphics Device Interface. System. Windows. Shapes 命名空间: 类 Ellipse 绘制一个椭圆. Line 在两个点之间绘制一条直线. Pa ...
- GDI+ Tutorial for Beginners
原文 GDI+ Tutorial for Beginners GDI+ is next evolution of GDI. Using GDI objects in earlier versions ...
- 【论文速读】Shangbang Long_ECCV2018_TextSnake_A Flexible Representation for Detecting Text of Arbitrary Shapes
Shangbang Long_ECCV2018_TextSnake_A Flexible Representation for Detecting Text of Arbitrary Shapes 作 ...
- WPF GDI+字符串绘制成图片(一)
原文:WPF GDI+字符串绘制成图片(一) 版权声明:本文为博主原创文章,未经博主允许不得转载. https://blog.csdn.net/BYH371256/article/details/83 ...
- 《C# GDI+ 破境之道》:第一境 GDI+基础 —— 第二节:画矩形
有了上一节画线的基础,画矩形的各种边线就特别好理解了,所以,本节在矩形边线上,就不做过多的讲解了,关注一下画“随机矩形”的具体实现就好.与画线相比较,画矩形稍微复杂的一点就是在于它多了很多填充的样式. ...
随机推荐
- javascript特效:会随着鼠标而动的眼睛
这个特效非常简单,其中眼球和眼珠都是特定的图片.只要掌握好距离坐标就没问题.我就直接贴代码,有兴趣的朋友可以自己复制下来运行一下,下面的眼睛图像就是我的文件用到的图像,比较难看..我就把我的代码贴出来 ...
- DataGridView的Validating事件注册后删除操作的处理
我们在处理DataGridView必填项判断时,一般使用DataGridView的RowValidating事件判断,具体代码如下: protected override void OnRowVali ...
- Android:源码环境编译自定义的APP到ROM(System Image)中
有时候我们需要在源码环境中增加自己的应用或模块,随ROM一起发布. 下面讲述相关步骤: 1. 首先可以在SDK环境下进行编码设计(如果你的APP不涉及到emulator无法模拟的硬件的话) 也可以参考 ...
- iOS 如何自定义NavigationBar的高度
UINavigationBar的高度在苹果官方的SDK中是固定的44个点,但是实际项目中我们却有可能遇到这样的情况,如下图: 这样的一个UINavigationBar的高度达到了84个点,这就需要我们 ...
- 浙江工商大学15年校赛C题 我删我删,删删删 【简单模拟】
Description: 有一个大整数.不超过1000位.假设有N位.我想删掉其中的任意S个数字.使得删除S位后,剩下位组成的数是最小的. Input: 有多组数据数据,每组数据为两行.第一行是一个大 ...
- (Problem 2)Even Fibonacci numbers
Each new term in the Fibonacci sequence is generated by adding the previous two terms. By starting w ...
- MySQL中关于日期、时间的数据类型和函数
一.日期相关的数据类型 1.datetime 占用8字节,既显示了日期,又显示了时间.其表示的日期范围为“1000-01-01 00:00:00”到“9999-12-31 23:59:59” 2.da ...
- hdu1853解题报告
题意和解决回路匹配的思路如同hdu3488 (这里我第一次想到最短路,但是对于有回路这个不知道怎么处理,后来看了别人的解题报告才知道KM匹配,但是看到KM之后就自己想...想了很久....还是不知道回 ...
- DHCP的工作原理
什么是dhcp?它是如何实现的? DHCP称为动态主机配置协议.DHCP服务允许工作站连接到网络并且自动获取一个IP地址.配置DHCP服务的服务器可以为每一个网络客户提供一个IP地址.子网掩码.缺省网 ...
- iOS开发中关于本地数据中SQLite数据库常用的SQL语句
创建表 CREATE TABLE IF NOT EXISTS "student" ("number" INTEGER PRIMARY KEY AUTOINCRE ...