Prometheus + Grafana
Prometheus
ubuntu安装prometheus非常简单:
apt update

apt install prometheus

systemctl enable prometheus

systemctl enable prometheus-node-exporter
apt安装prometheus和prometheus-node-exporter之后便带有基本配置,无需修改。
确保开启服务开启:
systemctl status prometheus

systemctl status prometheus-node-exporter
顺便使用它监控mongodb,安装prometheus-mongodb-exporter:
apt install prometheus-mongodb-exporter

systemctl enable prometheus-mongodb-exporter
此外由于mongodb开启了密码验证,需要注意mongodb用户的权限:mongodb_exporter github链接
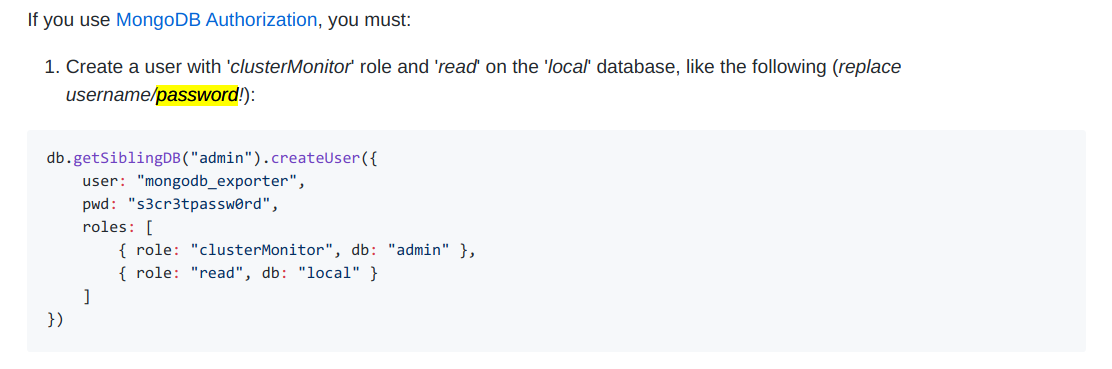
然后需要修改 /etc/default/prometheus-mongodb-exporter 中的 ARGS 如下:
# ARGS='-mongodb.uri="mongodb://localhost:27017"'

ARGS='-mongodb.uri="mongodb://xxx:xxxxx@localhost:27017"'
mongodb URI格式如下:
mongodb://[username:password@]host1[:port1][,...hostN[:portN]][/[database][?options]]
如果 username 或 password 包含 @ : / % 四种符号需要使用 百分号编码.
错误添加需要删除时用db.getSiblingDB("admin").dropUser("mongodb_exporter")
然后重启一下服务
systemctl restart prometheus-mongodb-exporter
Grafana
安装:
sudo add-apt-repository "deb https://packages.grafana.com/oss/deb stable main"

wget -q -O - https://packages.grafana.com/gpg.key | sudo apt-key add -

apt update

apt install grafana
配置:
配置文件为 /etc/grafana/grafana.ini,注意如下内容:
...

[server]

domain = www.xxxx.com

enforce_domain = true

root_url = %(protocol)s://%(domain)s/grafana

...

[security]

admin_password = xxxx
然后访问 www.xxxx.com/grafana 登录,用户名admin,密码为上面设置的admin_password。
然后按照 [这里][https://github.com/percona/grafana-dashboards] 配置数据源使用prometheus,并导入面板。一般导入这些即可:
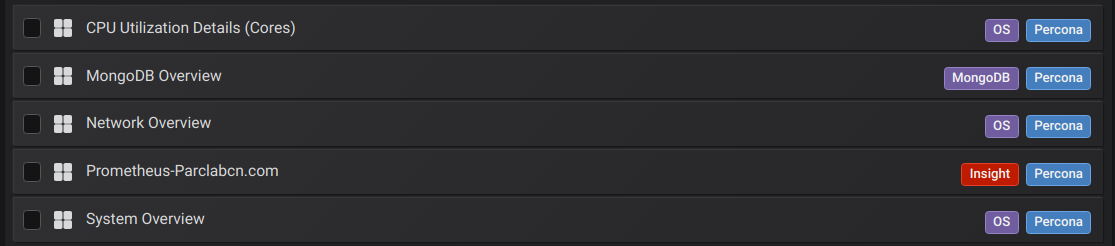
(注意:json中的pmm-singlestat-panel可能需要替换为singlestat)
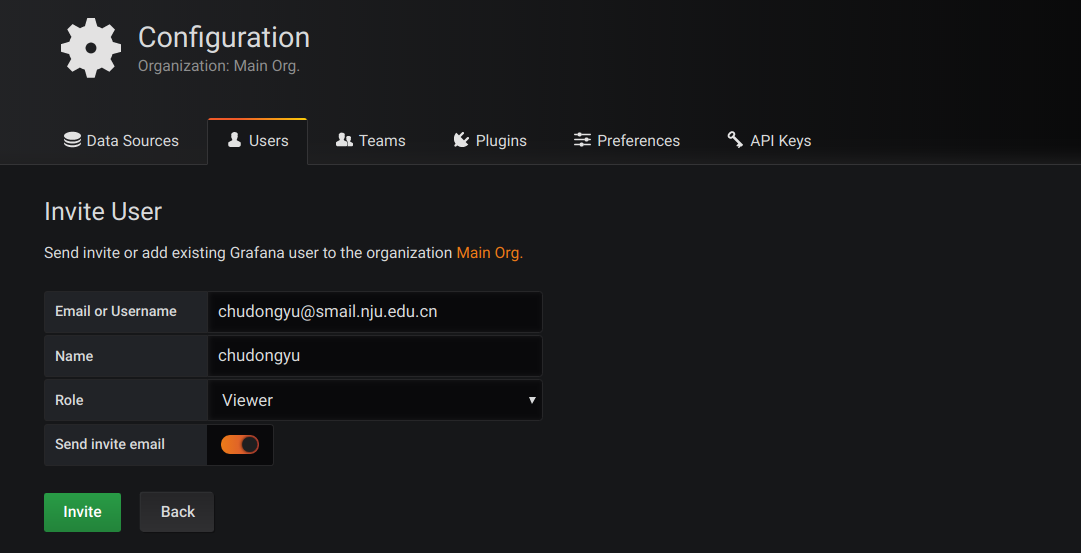
使用Viewer角色用户登录查看
上述Dashboard配置好之后,不应继续使用admin登录系统。
在设置中“邀请”用户,填写自己的邮箱然后通过邮箱链接设置密码,即可以自己的邮箱登录grafana。

注:
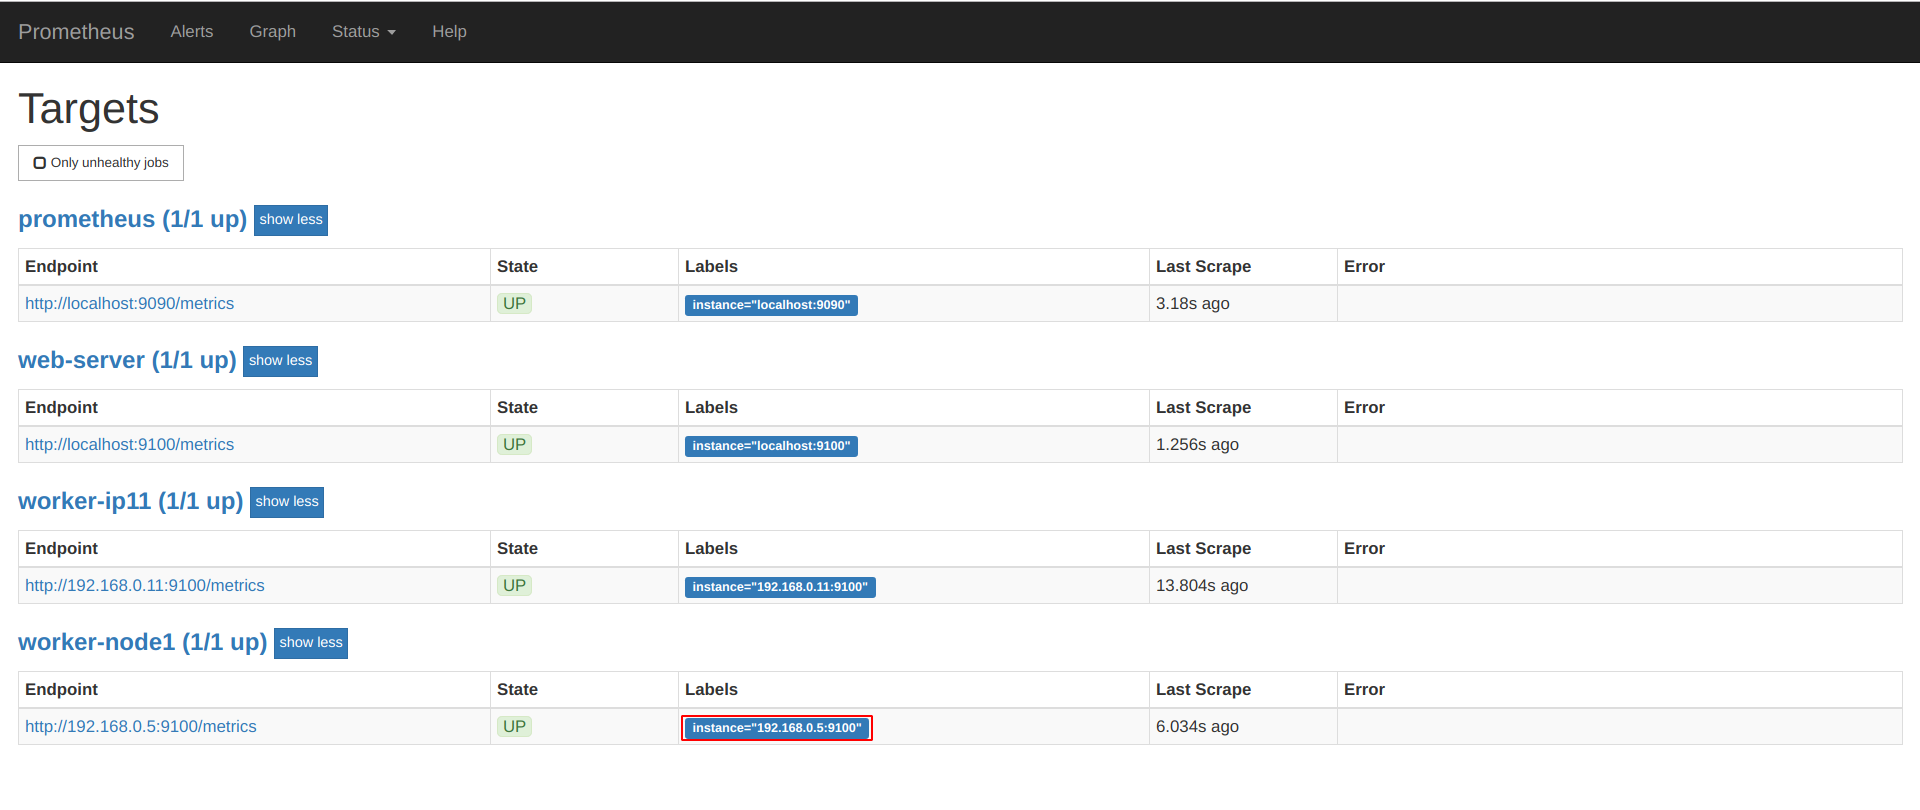
使用prometheus监控两台服务器,配置文件 /etc/prometheus/prometheus.yml 内容如下:
# Sample config for Prometheus.

global:

  scrape_interval:     15s # By default, scrape targets every 15 seconds.

  evaluation_interval: 15s # By default, scrape targets every 15 seconds.

  # scrape_timeout is set to the global default (10s).

  # Attach these labels to any time series or alerts when communicating with

  # external systems (federation, remote storage, Alertmanager).

  external_labels:

      monitor: 'example'

# Load and evaluate rules in this file every 'evaluation_interval' seconds.

rule_files:

  # - "first.rules"

  # - "second.rules"

# A scrape configuration containing exactly one endpoint to scrape:

# Here it's Prometheus itself.

scrape_configs:

  # The job name is added as a label `job=<job_name>` to any timeseries scraped from this config.

  - job_name: 'prometheus'

    # Override the global default and scrape targets from this job every 5 seconds.

    scrape_interval: 5s

    scrape_timeout: 5s

    # metrics_path defaults to '/metrics'

    # scheme defaults to 'http'.

    static_configs:

        - targets: ['localhost:9090']

  - job_name: "web-server"

    # If prometheus-node-exporter is installed, grab stats about the local

    # machine by default.

    static_configs:

      - targets: ['localhost:9100']

  - job_name: "worker-node1"

    static_configs:

      - targets: ['192.168.0.5:9100']
这个配置是没问题的,在另一台机器 (192.168.0.5) 上安装并启用 prometheus-node-exporter 即可。
但如果你仅仅修改了某个job_name(而没有修改ip),比如把web-server改为node,那么grafana界面中的singlestat panel将不能正确显示,显示“Only queries that return single...”,
这是因为singlestat只能显示一个结果,而查询语句查到了两个结果。解决方式是删除之前的数据系列:
首先停止prometheus服务,传入
--web.enable-admin-api参数手动运行然后这样删除:
curl -X POST -g 'http://localhost:9090/api/v1/admin/tsdb/delete_series?match[]={instance="localhost:9100"}'
参考链接:Prometheus: Delete Time Series Metrcs
注2:上述情况的查询语句可能是这样的(可以在grafana中看到):
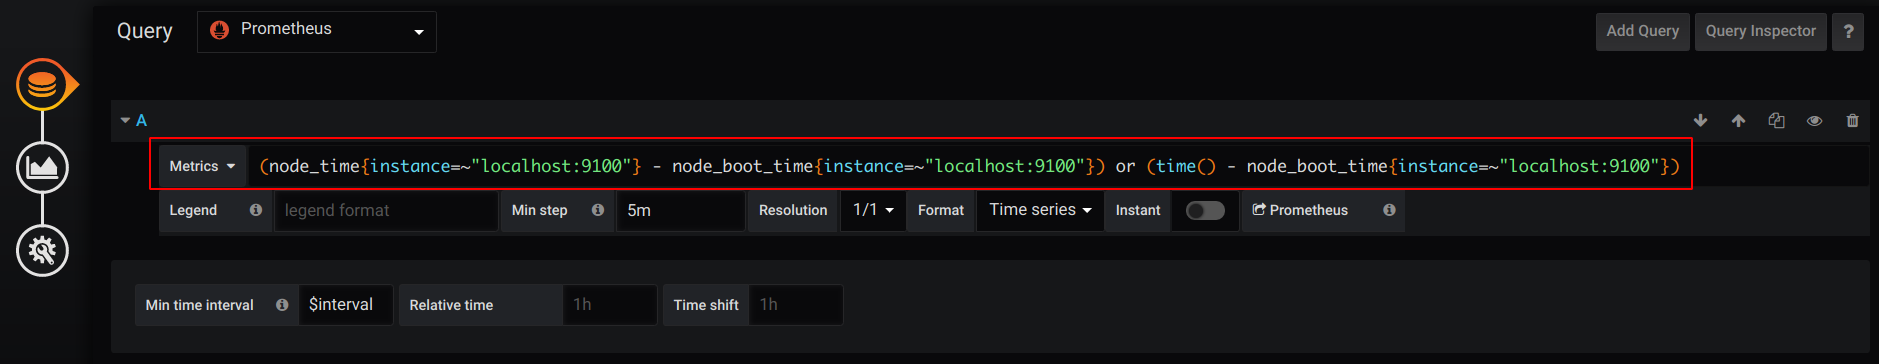
(可以用instance="xxxxx"或job="xxxxx")
清理数据参考链接:
https://prometheus.io/docs/prometheus/2.3/querying/api/#delete-series
https://www.alibabacloud.com/help/zh/doc-detail/56246.htm
prometheus 默认是9090端口:
Prometheus + Grafana的更多相关文章
- 使用 Prometheus + Grafana 对 Kubernetes 进行性能监控的实践
1 什么是 Kubernetes? Kubernetes 是 Google 开源的容器集群管理系统,其管理操作包括部署,调度和节点集群间扩展等. 如下图所示为目前 Kubernetes 的架构图,由 ...
- cAdvisor+Prometheus+Grafana监控docker
cAdvisor+Prometheus+Grafana监控docker 一.cAdvisor(需要监控的主机都要安装) 官方地址:https://github.com/google/cadvisor ...
- 基于Docker+Prometheus+Grafana监控SpringBoot健康信息
在微服务体系当中,监控是必不可少的.当系统环境超过指定的阀值以后,需要提醒指定的运维人员或开发人员进行有效的防范,从而降低系统宕机的风险.在CNCF云计算平台中,Prometheus+Grafana是 ...
- prometheus + grafana部署RabbitMQ监控
prometheus + grafana部署RabbitMQ监控 1.grafana导入dashboards https://grafana.com/dashboards/2121 2.expor ...
- Kubernetes+Prometheus+Grafana部署笔记
一.基础概念 1.1 基础概念 Kubernetes(通常写成“k8s”)Kubernetes是Google开源的容器集群管理系统.其设计目标是在主机集群之间提供一个能够自动化部署.可拓展.应用容器可 ...
- [转帖]Prometheus+Grafana监控Kubernetes
原博客的位置: https://blog.csdn.net/shenhonglei1234/article/details/80503353 感谢原作者 这里记录一下自己试验过程中遇到的问题: . 自 ...
- Prometheus+Grafana监控部署实践
参考文档: Prometheus github:https://github.com/prometheus grafana github:https://github.com/grafana/graf ...
- Prometheus+Grafana搭建监控系统
之前在业务中遇到服务器负载过高问题,由于没有监控,一直没发现,直到业务方反馈网站打开速度慢,才发现问题.这样显得开发很被动.所以是时候搭建一套监控系统了. 由于是业余时间自己捯饬,所以神马业务层面的监 ...
- Spring Boot 2.x监控数据可视化(Actuator + Prometheus + Grafana手把手)
TIPS 本文基于Spring Boot 2.1.4,理论支持Spring Boot 2.x所有版本 众所周知,Spring Boot有个子项目Spring Boot Actuator,它为应用提供了 ...
- Prometheus Grafana可视化展示Linux资源使用率
Prometheus Grafana可视化展示Linux资源使用率 Grfana官方仪表盘下载:https://grafana.com/dashboards 数据源推荐:https://grafan ...
随机推荐
- django 多表查询并返回结果
(不喜勿喷,个人记录) 问题,有两张关联的表,表B的api_id关联表A的id 我想在页面上返回两张表查询之后的共同结果? 因为两张表的id是一样的,就先获取到表A的对象,然后拿表A的对象id当做表B ...
- Nginx-配置负载均衡实例
配置负载均衡实例 实现效果: 配置负载均衡 实验代码 1) 首先准 备两个同时启动的 Tomcat 2) 在 nginx.conf 中进行配置 随着互联网信息的爆炸性增长,负载均衡(load bala ...
- [洛谷P1095]NOIP2007 普及组T3 守望者的逃离
问题描述 恶魔猎手尤迪安野心勃勃,他背叛了暗夜精灵,率领深藏在海底的娜迦族企图叛变.守望者在与尤迪安的交锋中遭遇了围杀,被困在一个荒芜的大岛上.为了杀死守望者,尤迪安开始对这个荒岛施咒,这座岛很快就会 ...
- HAProxy+Heartbeat双节点出现VIP情况
本文使用heartbeat做高可用,主节点192.168.0.204,备节点192.168.0.205,vip192.168.0.206,防火墙启动状态 先启动主节点,再启动备节点后,发现以下问题: ...
- NIO之FileChannel操作示例
1. 写文件操作 /** * 写文件 */ public class FileChannelTest { public static void main(String[] args) throws I ...
- centos6.5安装nginx1.16.0
参考: centos7 编译安装nginx1.16.0( 完整版 ) https://blog.csdn.net/weixin_37773766/article/details/80290939 ...
- kafka消费组、消费者
consumer group consumer instance 一个消费组可能有一个或者多个消费者.同一个消费组可以订阅一个或者多个主题.主题的某一个分区只能被消费组的某一个消费者消费.那么分区和消 ...
- Intel CPU编号详解
一.概述 Intel(英特尔)是当前最主流的台式机.笔记本.服务器CPU厂商.和英特尔类似的还有AMD厂商的CPU. Intel生产的CPU型号繁多,每个型号的CPU都有对应的编号.这个编号有特定意义 ...
- apache如何发布地图服务
svg jpg Tomcat和apache是什么关系呢?:https://www.cnblogs.com/zangdalei/p/8057325.html geoserver又是怎么来的呢? Tomc ...
- [CSP-S模拟测试]:轰炸行动(bomb)(塔尖+拓扑排序+语文)
题目描述 战狂也在玩<魔方王国>.他只会征兵而不会建城市,因此他决定对小奇的城市进行轰炸.小奇有n座城市,城市之间建立了$m$条有向的地下通道.战狂会发起若干轮轰炸,每轮可以轰炸任意多个城 ...