
『Python』matplotlib常用函数
1. 绘制图表组成元素的主要函数
1.1 plot()——展现量的变化趋势
import numpy as np

import matplotlib.pyplot as plt

import matplotlib

matplotlib.use('Qt5Agg')

x = np.linspace(0.05, 10, 1000)

y = np.cos(x)

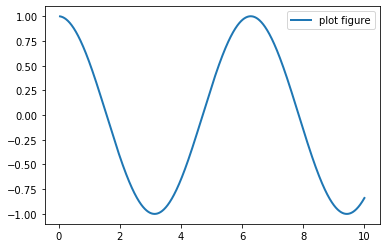
plt.plot(x, y, ls="-", lw=2, label="plot figure")

plt.legend()

plt.show()
1.2 scatter()——寻找变量之间的关系
import numpy as np

import matplotlib.pyplot as plt

import matplotlib

matplotlib.use('Qt5Agg')

x = np.linspace(0.05, 10, 1000)

y = np.random.rand(1000)

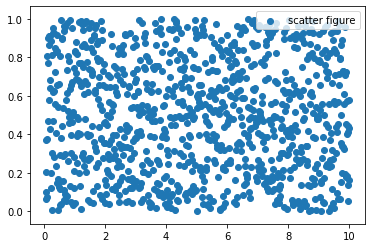
plt.scatter(x, y, label="scatter figure")

plt.legend()

plt.show()
1.3 xlim()——设置x轴的数值显示范围
import numpy as np

import matplotlib.pyplot as plt

import matplotlib

matplotlib.use('Qt5Agg')

x = np.linspace(0.05, 10, 1000)

y = np.random.rand(1000)

plt.scatter(x, y, label="scatter figure")

plt.legend()

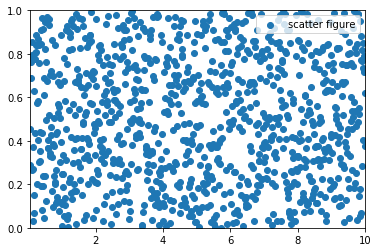
plt.xlim(0.05, 10)

plt.ylim(0, 1)

plt.show()
1.4 xlabel()——设置x轴的标签文本
import numpy as np

import matplotlib.pyplot as plt

import matplotlib

matplotlib.use('Qt5Agg')

x = np.linspace(0.05, 10, 1000)

y = np.sin(x)

plt.plot(x, y, ls="--", lw=2, c="c", label="plot figure")

plt.legend()

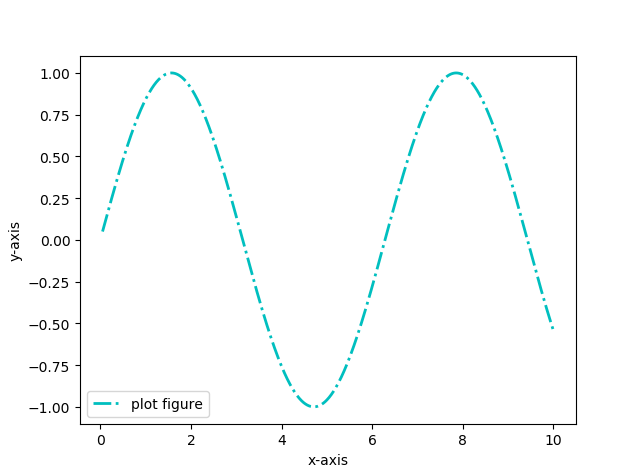
plt.xlabel("x-axis")

plt.ylabel("y-axis")

plt.show()
1.5 grid()——绘制刻度线的网格线
import numpy as np

import matplotlib.pyplot as plt

import matplotlib

matplotlib.use('Qt5Agg')

x = np.linspace(0.05, 10, 1000)

y = np.sin(x)

plt.plot(x, y, ls="-.", lw=2, c="c", label="plot figure")

plt.legend()

plt.grid(linestyle=":", color="r")

plt.show()
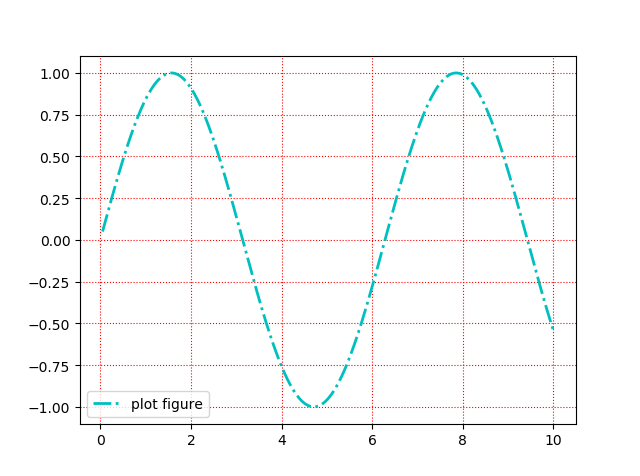
grid()函数的主要参数为grid(b, which, axis, color, linestyle, linewidth, **kwargs):
b:布尔值。就是是否显示网格线的意思。官网说如果b设置为None, 且kwargs长度为0,则切换网格状态which:取值为major,minor,both。 默认为majoraxis:取值为both,x,y。就是想绘制哪个方向的网格线color:这就不用多说了,就是设置网格线的颜色。或者直接用c来代替color也可以linestyle:也可以用ls来代替linestyle, 设置网格线的风格,是连续实线,虚线或者其它不同的线条
1.6 axhline()——绘制平行于x轴的水平参考线
import numpy as np

import matplotlib.pyplot as plt

import matplotlib

matplotlib.use('Qt5Agg')

x = np.linspace(0.05, 10, 1000)

y = np.sin(x)

plt.plot(x, y, ls="-.", lw=2, c="c", label="plot figure")

plt.legend()

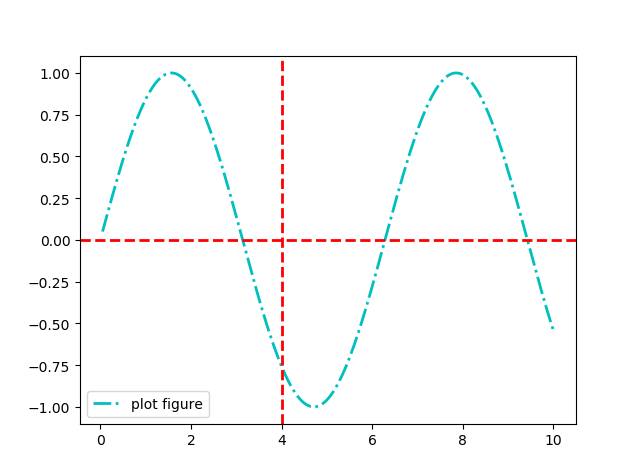
plt.axhline(y=0.0, c="r", ls="--", lw=2)

plt.axvline(x=4.0, c="r", ls="--", lw=2)

plt.show()
1.7 axvspan()——绘制垂直于x轴的参考区域
import numpy as np

import matplotlib.pyplot as plt

import matplotlib

matplotlib.use('Qt5Agg')

x = np.linspace(0.05, 10, 1000)

y = np.sin(x)

plt.plot(x, y, ls="-.", lw=2, c="c", label="plot figure")

plt.legend()

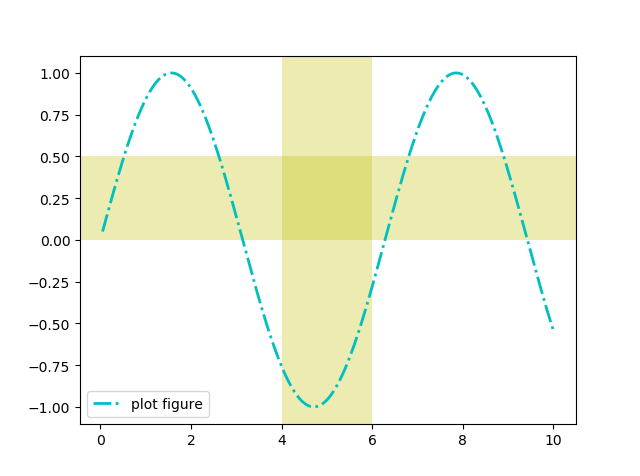
plt.axvspan(xmin=4.0, xmax=6.0, facecolor="y", alpha=0.3)

plt.axhspan(ymin=0.0, ymax=0.5, facecolor="y", alpha=0.3)

plt.show()
1.8 annotate()——添加图形内容细节的指向型注释文本
import numpy as np

import matplotlib.pyplot as plt

import matplotlib

matplotlib.use('Qt5Agg')

x = np.linspace(0.05, 10, 1000)

y = np.sin(x)

plt.plot(x, y, ls="-.", lw=2, c="c", label="plot figure")

plt.legend()

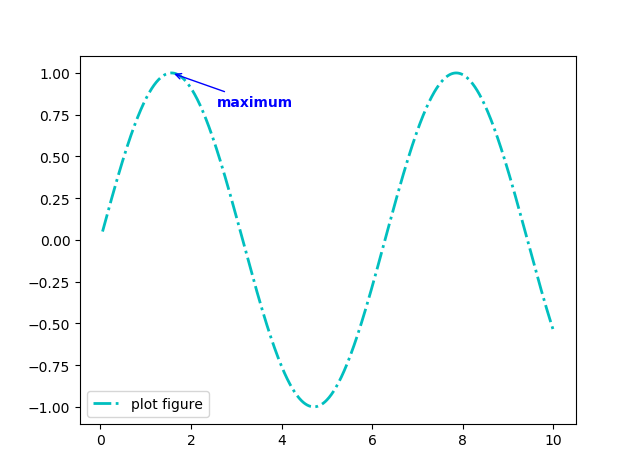
plt.annotate(s="maximum",

             xy=(np.pi / 2, 1.0),

             xytext=((np.pi / 2) + 1.0, 0.8),

             weight="bold",

             color="b",

             arrowprops=dict(arrowstyle="->", connectionstyle="arc3", color="b")

             )

plt.show()
xy:被注释图形内容的位置坐标
xytext:注释文本的位置坐标
weight:注释文本的字体粗细风格
color:注释文本的字体颜色
arrowprops:指示被注释内容的箭头的属性字典
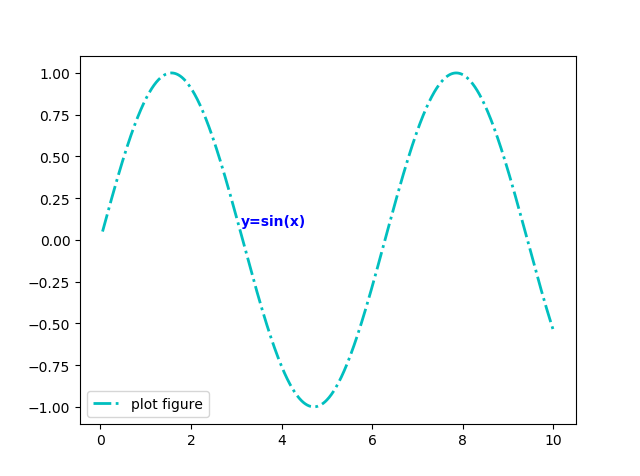
1.9 text()——添加图形内容细节的无指向型注释文本
import numpy as np

import matplotlib.pyplot as plt

import matplotlib

matplotlib.use('Qt5Agg')

x = np.linspace(0.05, 10, 1000)

y = np.sin(x)

plt.plot(x, y, ls="-.", lw=2, c="c", label="plot figure")

plt.legend()

plt.text(x=3.10, y=0.09, s="y=sin(x)", weight="bold", color="b")

plt.show()
1.10 title()——添加图形内容的标题
import numpy as np

import matplotlib as mpl

import matplotlib.pyplot as plt

x = np.linspace(-2, 2, 1000)

y = np.exp(x)

plt.plot(x, y, ls="-", lw=2, color="g")

plt.title("center demo")

plt.title("left demo", loc="left",

          fontdict={"size": "xx-large",

                    "color": "r",

                    "family": "Times New Roman"})

plt.title("right demo", loc="right",

          family="Comic Sans MS", size=20,

          style="oblique", color="c")

plt.show()
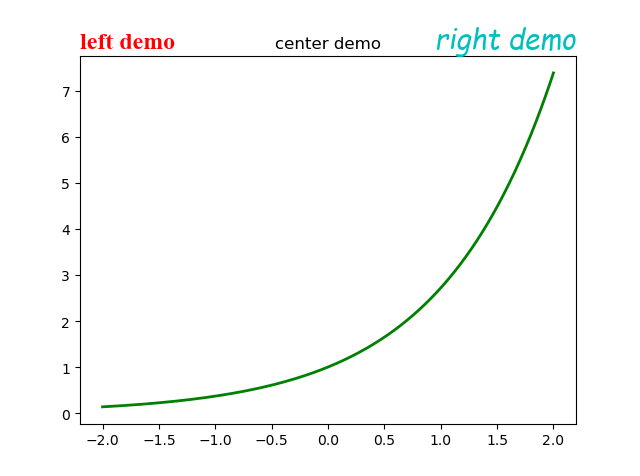
主要参数都在上面代码里体现了
1.11 legend()——表示不同图形的文本标签图例
import numpy as np

import matplotlib as mpl

import matplotlib.pyplot as plt

x = np.arange(0, 2.1, 0.1)

y = np.power(x, 3)

y1 = np.power(x, 2)

y2 = np.power(x, 1)

plt.plot(x, y, ls="-", lw=2, label="$x^3$")

plt.plot(x, y1, ls="-", lw=2, label="$x^2$")

plt.plot(x, y2, ls="-", lw=2, label="$x^1$")

plt.legend(loc="upper left",fontsize="x-large", bbox_to_anchor=(0.05, 0.95), ncol=3,

           title="power function", shadow=True, fancybox=True)

plt.show()
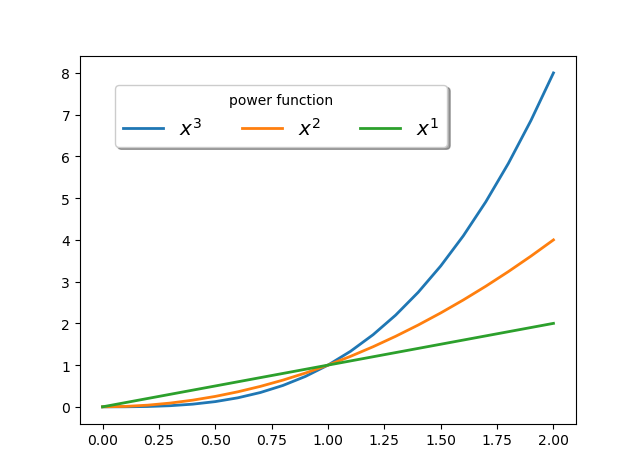
loc参数控制图例的位置,可选值为:
bestupper rightupper leftlower leftlower rightrightcenter leftcenter rightlower centerupper centercenter
fontsize控制图例字体大小,可选值为:
intfloatxx-smallx-smallsmallmediumlargex-largexx-large
frameon:True或False,是否显示图例边框edgecolor:图例边框颜色facecolor:图例背景颜色,若无边框,参数无效title:设置图例标题fancybox:True表示线框直角,False表示线框圆角shadow:True或False,是否显示阴影
2. 常用配置参数
2.1 线型
linestyle或ls
-:实线--:虚线-.:点划线::点线
2.2 线宽
linewidth或lw
- 浮点数
2.3 线条颜色
color或c
b:blue,蓝色g:green,绿色r:red,红色c:cyan,蓝绿m:magenta,洋红y:yellow,黄色k:black,黑色w:white,白色
也可以对关键字参数color赋十六进制的RGB字符串如 color='#900302'
2.4 点标记类型
marker,只能用以下简写符号表示
.:point marker,:pixel markero:circle markerv:triangle_down marker^:triangle_up marker<:triangle_left marker>:triangle_right marker1:tri_down marker2:tri_up marker3:tri_left marker4:tri_right markers:square markerp:pentagon marker*:star markerh:hexagon1 markerH:hexagon2 marker+:plus markerx:x markerD:diamond markerd:thin_diamond marker|:vline marker_:hline marker
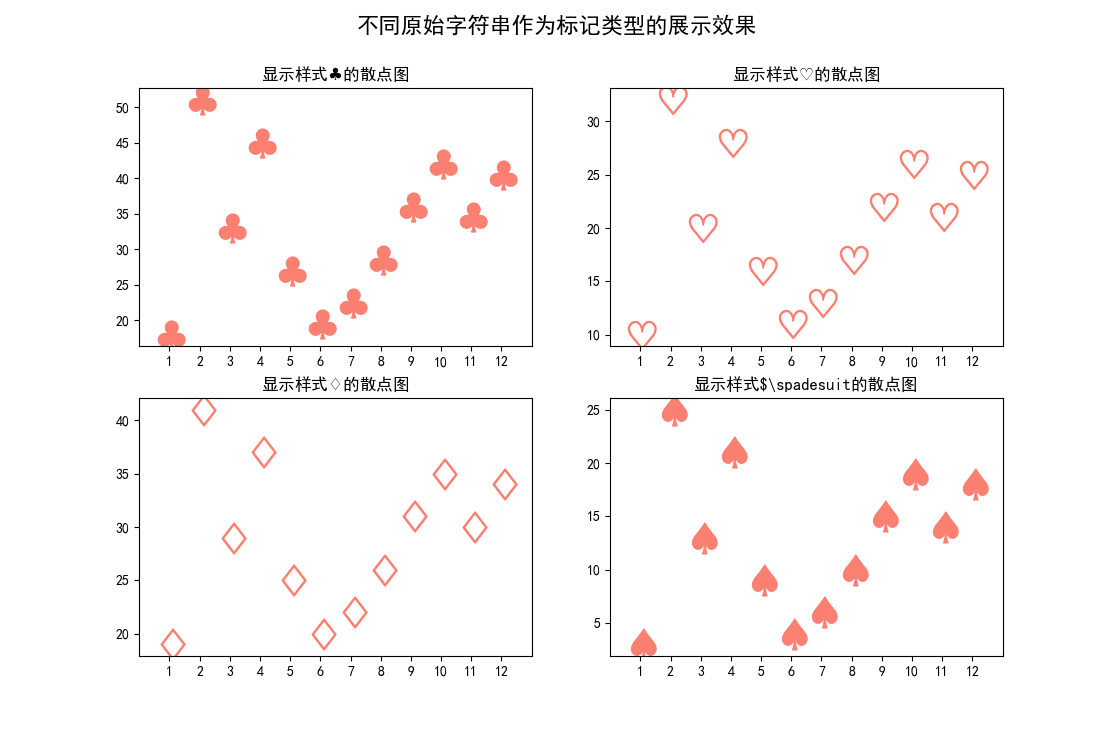
特别地,标记还有mathtext模式
import numpy as np

import matplotlib.pyplot as plt

import matplotlib as mpl

mpl.use('Qt5Agg')

mpl.rcParams['font.sans-serif'] = ['SimHei']

mpl.rcParams['font.serif'] = ['SimHei']

mpl.rcParams['axes.unicode_minus'] = False  # 解决保存图像是负号'-'显示为方块的问题,或者转换负号为字符串

x = np.arange(1, 13, 1)

y = np.array([12, 34, 22, 30, 18, 13, 15, 19, 24, 28, 23, 27])

fig, ax = plt.subplots(2, 2)

ax[0, 0].scatter(x, y * 1.5, marker=r"$\clubsuit$", c="#fb8072", s=500)

ax[0, 0].locator_params(axis="x", tight=True, nbins=11)

ax[0, 0].set_xlim(0, 13)

ax[0, 0].set_xticks(x)

ax[0, 0].set_title('显示样式{}的散点图'.format(r"$\clubsuit$"))

ax[0, 1].scatter(x, y - 2, marker=r"$\heartsuit$", c="#fb8072", s=500)

ax[0, 1].locator_params(axis="x", tight=True, nbins=11)

ax[0, 1].set_xlim(0, 13)

ax[0, 1].set_xticks(x)

ax[0, 1].set_title('显示样式{}的散点图'.format(r"$\heartsuit$"))

ax[1, 0].scatter(x, y + 7, marker=r"$\diamondsuit$", c="#fb8072", s=500)

ax[1, 0].locator_params(axis="x", tight=True, nbins=11)

ax[1, 0].set_xlim(0, 13)

ax[1, 0].set_xticks(x)

ax[1, 0].set_title('显示样式{}的散点图'.format(r"$\diamondsuit$"))

ax[1, 1].scatter(x, y - 9, marker=r"$\spadesuit$", c="#fb8072", s=500)

ax[1, 1].locator_params(axis="x", tight=True, nbins=11)

ax[1, 1].set_xlim(0, 13)

ax[1, 1].set_xticks(x)

ax[1, 1].set_title('显示样式{}的散点图'.format(r"$\spadesuit"))

plt.suptitle("不同原始字符串作为标记类型的展示效果", fontsize=16, weight="black")

plt.show()
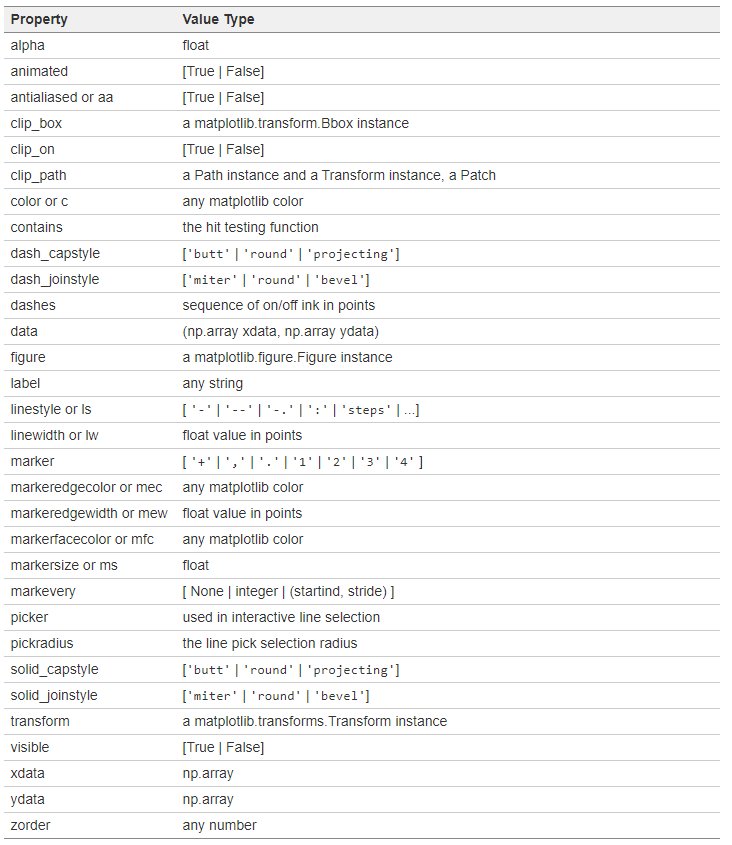
官网有一张属性表,先贴在这,以后有空会再补充内容的
『Python』matplotlib常用函数的更多相关文章
- 『Python』matplotlib常用图表
这里简要介绍几种统计图形的绘制方法,其他更多图形可以去matplotlib找examples魔改 1. 柱状图 柱状图主要是应用在定性数据的可视化场景中,或是离散数据类型的分布展示.例如,一个本科班级 ...
- 『Python』matplotlib划分画布的主要函数
1. subplot() 绘制网格区域中几何形状相同的子区布局 函数签名有两种: subplot(numRows, numCols, plotNum) subplot(CRN) 都是整数,意思是将画布 ...
- 『Python』pycharm常用设置
学习一下pycharm的快捷操作,提升速度,也提升舒适度,笑. 常用快捷键 ctrl + d :复制粘贴本行到下一行 ctrl + y :删除本行 ctrl + 鼠标点击 :跳转 ctrl + / : ...
- 『Python』为什么调用函数会令引用计数+2
一.问题描述 Python中的垃圾回收是以引用计数为主,分代收集为辅,引用计数的缺陷是循环引用的问题.在Python中,如果一个对象的引用数为0,Python虚拟机就会回收这个对象的内存. sys.g ...
- 『Python』matplotlib的imshow用法
热力图是一种数据的图形化表示,具体而言,就是将二维数组中的元素用颜色表示.热力图之所以非常有用,是因为它能够从整体视角上展示数据,更确切的说是数值型数据. 使用imshow()函数可以非常容易地制作热 ...
- 『Python』matplotlib实现动画效果
一般而言,在绘制复杂动画时,主要借助模块animation来完成 import numpy as np import matplotlib.pyplot as plt import matplotli ...
- 『Python』matplotlib坐标轴应用
1. 设置坐标轴的位置和展示形式 import numpy as np import matplotlib.pyplot as plt import matplotlib as mpl mpl.use ...
- 『Python』matplotlib共享绘图区域坐标轴
1. 共享单一绘图区域的坐标轴 有时候,我们想将多张图形放在同一个绘图区域,不想在每个绘图区域只绘制一幅图形.这时候,就可以借助共享坐标轴的方法实现在一个绘图区域绘制多幅图形的目的. import n ...
- 『Python』matplotlib实现GUI效果
1. 类RadioButtons的使用方法 类似单选框 import numpy as np import matplotlib.pyplot as plt import matplotlib as ...
随机推荐
- [源码解析] 深度学习流水线并行GPipe (2) ----- 梯度累积
[源码解析] 深度学习流水线并行GPipe (2) ----- 梯度累积 目录 [源码解析] 深度学习流水线并行GPipe (2) ----- 梯度累积 0x00 摘要 0x01 概述 1.1 前文回 ...
- Dapps-是一个跨平台的应用服务商店
简介 Dapps 是一个跨平台的应用商店,包含众多软件,基于docker dapps是什么? 它是一个应用程序商店,包含丰富的软件,因为基于docker,使你本机电脑有云开发的效果. 一键安装程序:多 ...
- 玩转Spring生命周期之Lifecycle
Lifecycle callbacks Initialization callbacks.Destruction callbacks要与容器的bean生命周期管理交互,即容器在启动后和容器在销毁前对每 ...
- C# ArrayPool 源码解读之 byte[] 池化
一:背景 1. 讲故事最近在分析一个 dump 的过程中发现其在 gen2 和 LOH 上有不少size较大的free,仔细看了下,这些free生前大多都是模板引擎生成的html片段的byte[]数组 ...
- Ubuntu 16.04 + python3 源码 安装+使用labelImg最新版
安装 sudo apt-get update sudo apt-get upgrade sudo apt install python3-pip git clone https://github.co ...
- 使用 & 进行高效率取余运算
Java的HashMap源码中用到的(n-1)&hash这样的运算,这是一种高效的求余数的方法 结论:假设被除数是x,对于除数是2n的取余操作x%2n,都可以写成x&(2n-1),位运 ...
- vue 微信二维码扫码登录,附加 自定义样式
大概流程: 先安装 微信 的登录, 然后 局部引入,局部注册,方法调用,存 token,跳转路由 npm 安装 npm install vue-wxlogin --save-dev 微信安装 微信 ...
- element-ui 用 el-checkbox-group 做权限管理
template <el-checkbox-group v-model="menu_ide" v-for="(item,index) in menu_idss&qu ...
- 软件测试2021:第一次作业——热身练习(Bug)
案例一: 问题说明:在大学生服务外包创新创业大赛的注册页面填写密码的时候只有偶数位的密码可以通过验证,而基数位的密码不可以 原因分析:在密码验证的时候多加了一条验证,使得基数位的密码不能都通过验证 案 ...
- 单片机学习(十二)1-Wire通信协议和DS18B20温度传感器
目录 一.DS18B20 1. DS18B20简介 2. 电路原理图 3. 内部结构 内部完整结构框图 存储器结构 二.单总线(1-Wire BUS) 1. 单总线简介 2. 电路规范 3. 单总线的 ...