
『Python』matplotlib实现GUI效果
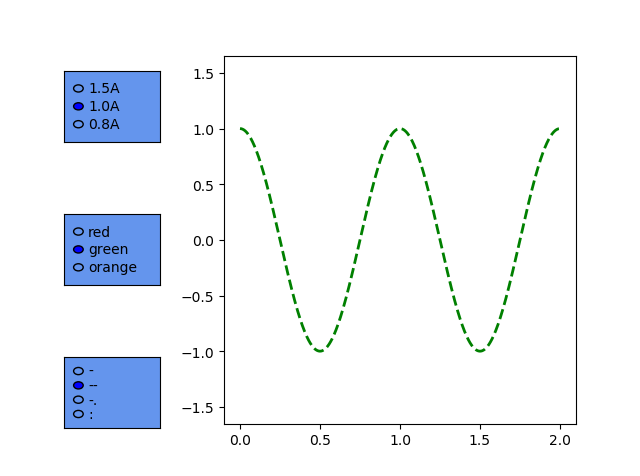
1. 类RadioButtons的使用方法
类似单选框
import numpy as np

import matplotlib.pyplot as plt

import matplotlib as mpl

from matplotlib.widgets import RadioButtons

mpl.use("Qt5Agg")

x = np.linspace(0.0, 2.0, 1000)

y1 = 1.5 * np.cos(2 * np.pi * x)

y2 = 1.0 * np.cos(2 * np.pi * x)

y3 = 0.8 * np.cos(2 * np.pi * x)

fig, ax = plt.subplots(1, 1)

line, = ax.plot(x, y1, color="red", lw=2)

plt.subplots_adjust(left=0.35)

facecolor = "cornflowerblue"

ax1 = plt.axes([0.1, 0.7, 0.15, 0.15], facecolor=facecolor)

radio1 = RadioButtons(ax1, ("1.5A", "1.0A", "0.8A"))

def amplitudefunc(label):

    hzdict = {"1.5A": y1, "1.0A": y2, "0.8A": y3}

    ydata = hzdict[label]

    line.set_ydata(ydata)

    plt.draw()

radio1.on_clicked(amplitudefunc)

ax2 = plt.axes([0.1, 0.4, 0.15, 0.15], facecolor=facecolor)

radio2 = RadioButtons(ax2, ("red", "green", "orange"))

def colorfunc(label):

    line.set_color(label)

    plt.draw()

radio2.on_clicked(colorfunc)

ax3 = plt.axes([0.1, 0.1, 0.15, 0.15], facecolor=facecolor)

radio3 = RadioButtons(ax3, ("-", "--", "-.", ":"))

def linestylefunc(label):

    line.set_linestyle(label)

    plt.draw()

radio3.on_clicked(linestylefunc)

plt.show()
2. 类Cursor的使用方法
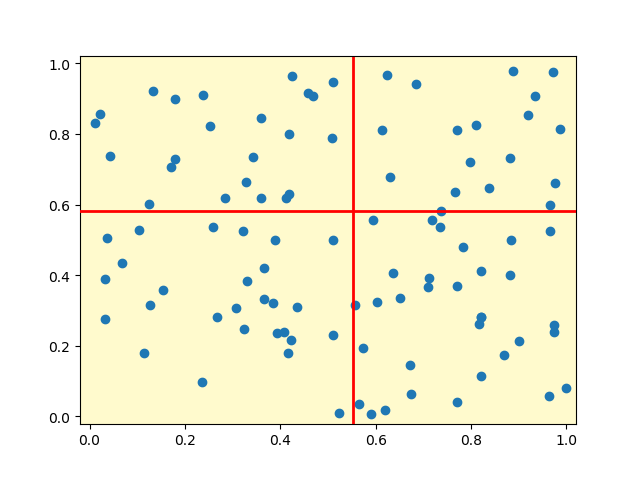
帮你聚焦鼠标所在位置
import numpy as np

import matplotlib.pyplot as plt

import matplotlib as mpl

from matplotlib.widgets import Cursor

lineprops = dict(color="red", lw=2)

fig, ax = plt.subplots(1, 1, subplot_kw=dict(facecolor="lemonchiffon"))

x = np.random.random(100)

y = np.random.random(100)

ax.scatter(x, y, marker="o")

ax.set_xlim(-0.02, 1.02)

ax.set_ylim(-0.02, 1.02)

cursor = Cursor(ax, useblit=True, **lineprops)  # 必须接收,不然会自动销毁掉。。。

plt.show()
3. 类CheckButtons的使用方法
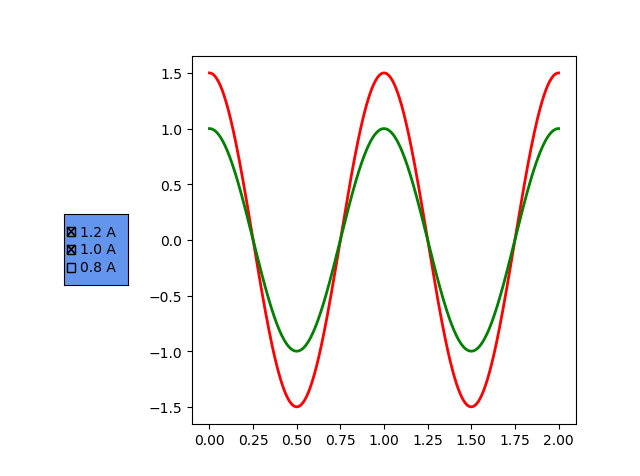
类似复选框
import numpy as np

import matplotlib.pyplot as plt

import matplotlib as mpl

from matplotlib.widgets import CheckButtons

x = np.linspace(0.0, 2.0, 1000)

y1 = 1.5 * np.cos(2 * np.pi * x)

y2 = 1.0 * np.cos(2 * np.pi * x)

y3 = 0.8 * np.cos(2 * np.pi * x)

fig, ax = plt.subplots(1, 1)

line1, = ax.plot(x, y1, color="red", lw=2, visible=False, label="1.2 A")

line2, = ax.plot(x, y2, color="green", lw=2, visible=False, label="1.0 A")

line3, = ax.plot(x, y3, color="orange", lw=2, visible=False, label="0.8 A")

plt.subplots_adjust(left=0.30)

facecolor = "cornflowerblue"

cax = plt.axes([0.1, 0.4, 0.1, 0.15], facecolor=facecolor)

lines = [line1, line2, line3]

labels = [str(line.get_label()) for line in lines]

visibility = [line.get_visible() for line in lines]

check = CheckButtons(cax, labels, visibility)

def func(label):

    index = labels.index(label)

    lines[index].set_visible(not lines[index].get_visible())

    plt.draw()

check.on_clicked(func)

plt.show()
『Python』matplotlib实现GUI效果的更多相关文章
- 『Python』matplotlib实现动画效果
一般而言,在绘制复杂动画时,主要借助模块animation来完成 import numpy as np import matplotlib.pyplot as plt import matplotli ...
- 『Python』matplotlib常用函数
1. 绘制图表组成元素的主要函数 1.1 plot()--展现量的变化趋势 import numpy as np import matplotlib.pyplot as plt import matp ...
- 『Python』matplotlib的imshow用法
热力图是一种数据的图形化表示,具体而言,就是将二维数组中的元素用颜色表示.热力图之所以非常有用,是因为它能够从整体视角上展示数据,更确切的说是数值型数据. 使用imshow()函数可以非常容易地制作热 ...
- 『Python』matplotlib坐标轴应用
1. 设置坐标轴的位置和展示形式 import numpy as np import matplotlib.pyplot as plt import matplotlib as mpl mpl.use ...
- 『Python』matplotlib共享绘图区域坐标轴
1. 共享单一绘图区域的坐标轴 有时候,我们想将多张图形放在同一个绘图区域,不想在每个绘图区域只绘制一幅图形.这时候,就可以借助共享坐标轴的方法实现在一个绘图区域绘制多幅图形的目的. import n ...
- 『Python』matplotlib划分画布的主要函数
1. subplot() 绘制网格区域中几何形状相同的子区布局 函数签名有两种: subplot(numRows, numCols, plotNum) subplot(CRN) 都是整数,意思是将画布 ...
- 『Python』matplotlib常用图表
这里简要介绍几种统计图形的绘制方法,其他更多图形可以去matplotlib找examples魔改 1. 柱状图 柱状图主要是应用在定性数据的可视化场景中,或是离散数据类型的分布展示.例如,一个本科班级 ...
- 『Python』matplotlib初识
1. 核心原理 使用matplotlib绘图的原理,主要就是理解figure(画布).axes(坐标系).axis(坐标轴)三者之间的关系. 下面这幅图更详细: 以"美院学生张三写生画画&q ...
- 『Python』__getattr__()特殊方法
self的认识 & __getattr__()特殊方法 将字典调用方式改为通过属性查询的一个小class, class Dict(dict): def __init__(self, **kw) ...
随机推荐
- ORM 之 EF的使用(一)
早期对数据库进行操作 通过Ado.Net 操作数据库 需要操作sqlCommand/sqlConnection/adapter/datareader 如图 后来 基于面向对象的思想 出现了中间件ORM ...
- vue爬坑之路1-路由跳转全新页面以及二级页面配置
之前也在网找了一些答案,比较零碎,特此总结下,废话不多说,直接上干货! 路由跳转全新页面 首先在app.vue中先定义router-view,这是主路由. 在router的index.js中引入log ...
- Mysql的undo、redo、binlog的区别
与不同引擎的关系 核心作用 生命周期 日志类型 undo log 属于innodb引擎独有 回滚,保证事务的"原子性",事务日志 事务开始前,以类似"快照&qu ...
- Linkerd 2.10(Step by Step)—配置超时
Linkerd 2.10 系列 快速上手 Linkerd v2 Service Mesh(服务网格) 腾讯云 K8S 集群实战 Service Mesh-Linkerd2 & Traefik2 ...
- eclipse建立c语言工程以及成功下载到FPGA芯片过程遇到的各种问题以及解决方法详解
推荐大家预先建立好一个工程目录文件夹,确实挺好用,参考正点原子的pdf教程,如下图所示, 我们eclipse在software文件夹建立一个workspace即可 选择用helloworld模板建立工 ...
- docker-harbor私有仓库使用笔记
1. 登录harbor管理页面,创建项目,比如yuqx_test 2. admin登录,此处免密登录,正常情况下会输入账号密码 [root@k8s-rancher2 ~]# docker login ...
- vue 嵌入倒计时组件( 亲测可用 )
由于花费了我不少时间才找到的组件,所以记录一下,后面方便自己好找一些,也算是分享出来给各位前端一起用. npm 下载npm install vue2-flip-countdown --save tem ...
- RabbitMQ之消息模式1
消息100%的投递 消息如何保障100%的投递成功? 什么是生产端的可靠性投递? 保障消息的成功发出 保障MQ节点的成功接收 发送端收到MQ节点(Broker)确认应答 完善的消息进行补偿机制 BAT ...
- Intel® QAT加速卡之性能简介
Intel QuickAssist Adapter 8950 设备简介 支持英特尔QuickAssist技术的英特尔QuickAssist适配器提供加密加速和压缩加速服务. 1. Key featur ...
- JS013. 重写toFixed( )方法,toFixed()原理 - 四舍五入?银行家舍入法?No!六舍七允许四舍五入√!
以下为场景实测与原理分析,需要重写函数请直接滚动至页尾!!! 语法 - Number.prototype.toFixed( ) // toFixed()方法 使用定点表示法来格式化一个数值. numO ...