『Python』matplotlib划分画布的主要函数
1. subplot()
- 绘制网格区域中几何形状相同的子区布局
函数签名有两种:
subplot(numRows, numCols, plotNum)subplot(CRN)
都是整数,意思是将画布划分为C行R列个子区,此时定位到第N个子区上,子区编号按照行优先排序。
下面就是最喜爱的举例环节
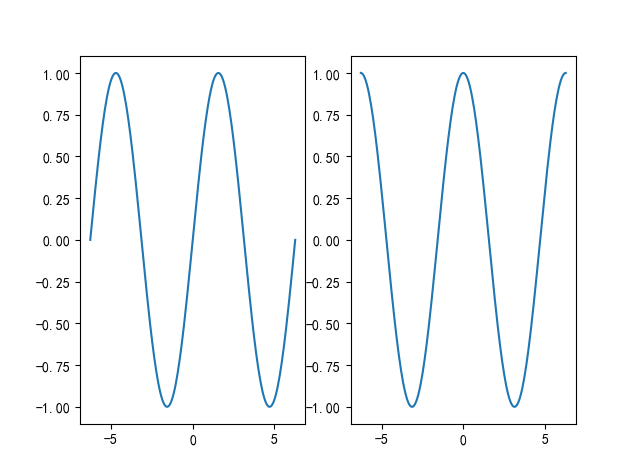
【Example 1】
import numpy as np

import matplotlib.pyplot as plt

import matplotlib as mpl

mpl.use('Qt5Agg')

mpl.rcParams['font.sans-serif'] = ['SimHei']

mpl.rcParams['font.serif'] = ['SimHei']

mpl.rcParams['axes.unicode_minus'] = False  # 解决保存图像是负号'-'显示为方块的问题,或者转换负号为字符串

x = np.linspace(-2 * np.pi, 2 * np.pi, 200)

y = np.sin(x)

y1 = np.cos(x)

plt.subplot(121)

plt.plot(x, y)

plt.subplot(122)

plt.plot(x, y1)

plt.show()
【Example 2】
import numpy as np

import matplotlib.pyplot as plt

import matplotlib as mpl

mpl.use('Qt5Agg')

mpl.rcParams['font.sans-serif'] = ['SimHei']

mpl.rcParams['font.serif'] = ['SimHei']

mpl.rcParams['axes.unicode_minus'] = False  # 解决保存图像是负号'-'显示为方块的问题,或者转换负号为字符串

fig = plt.figure()

x = np.linspace(0.0, 2 * np.pi)

y = np.cos(x) * np.sin(x)

ax1 = fig.add_subplot(121)

ax1.margins(0.03)

ax1.plot(x, y, ls="-", lw=2, color="b")

ax2 = fig.add_subplot(222)

ax2.margins(0.7, 0.7)

ax2.plot(x, y, ls="-", lw=2, color="r")

ax3 = fig.add_subplot(224)

ax3.margins(x=0.1, y=0.3)

ax3.plot(x, y, ls="-", lw=2, color="g")

plt.show()
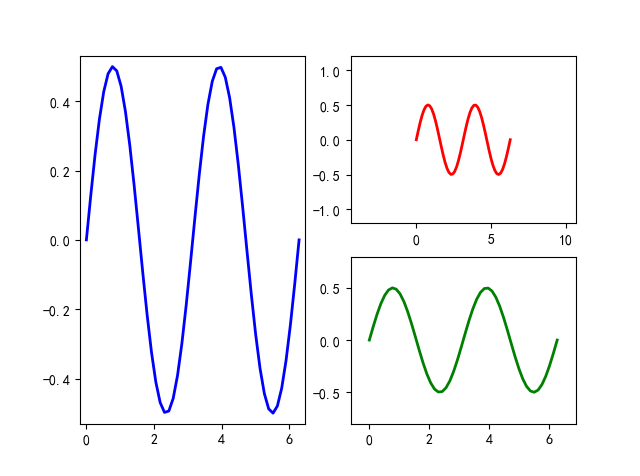
非等分画布可以多次使用等分画布来实现
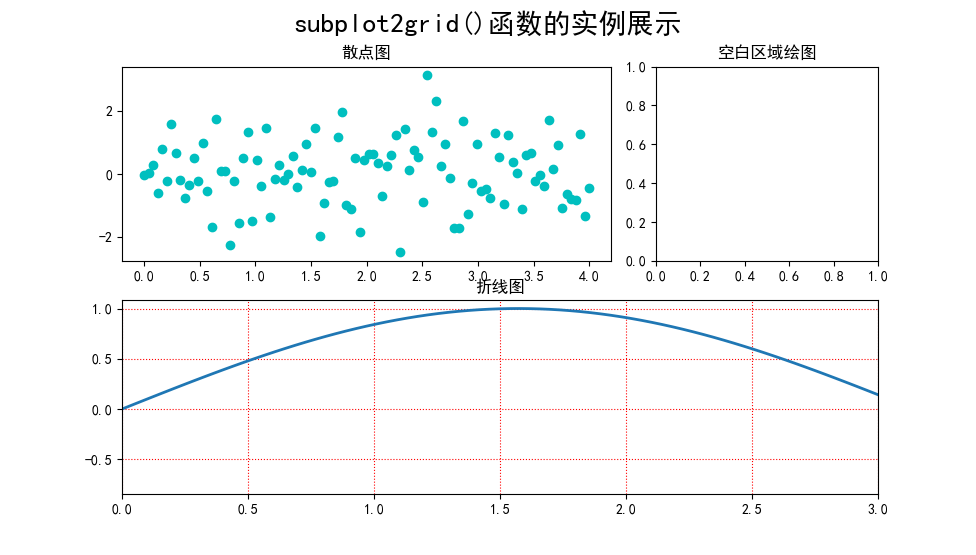
2. subplot2grid()
- 让子区跨越固定的网格布局
直接上示例
import numpy as np

import matplotlib.pyplot as plt

import matplotlib as mpl

mpl.use('Qt5Agg')

mpl.rcParams['font.sans-serif'] = ['SimHei']

mpl.rcParams['font.serif'] = ['SimHei']

mpl.rcParams['axes.unicode_minus'] = False  # 解决保存图像是负号'-'显示为方块的问题,或者转换负号为字符串

plt.subplot2grid((2, 3), (0, 0), colspan=2)

x = np.linspace(0.0, 4.0, 100)

y = np.random.randn(100)

plt.scatter(x, y, c="c")

plt.title("散点图")

plt.subplot2grid((2, 3), (0, 2))

plt.title("空白区域绘图")

plt.subplot2grid((2, 3), (1, 0), colspan=3)

y1 = np.sin(x)

plt.plot(x, y1, lw=2, ls="-")

plt.xlim(0, 3)

plt.grid(True, ls=":", c="r")

plt.title("折线图")

plt.suptitle("subplot2grid()函数的实例展示", fontsize=20)

plt.show()
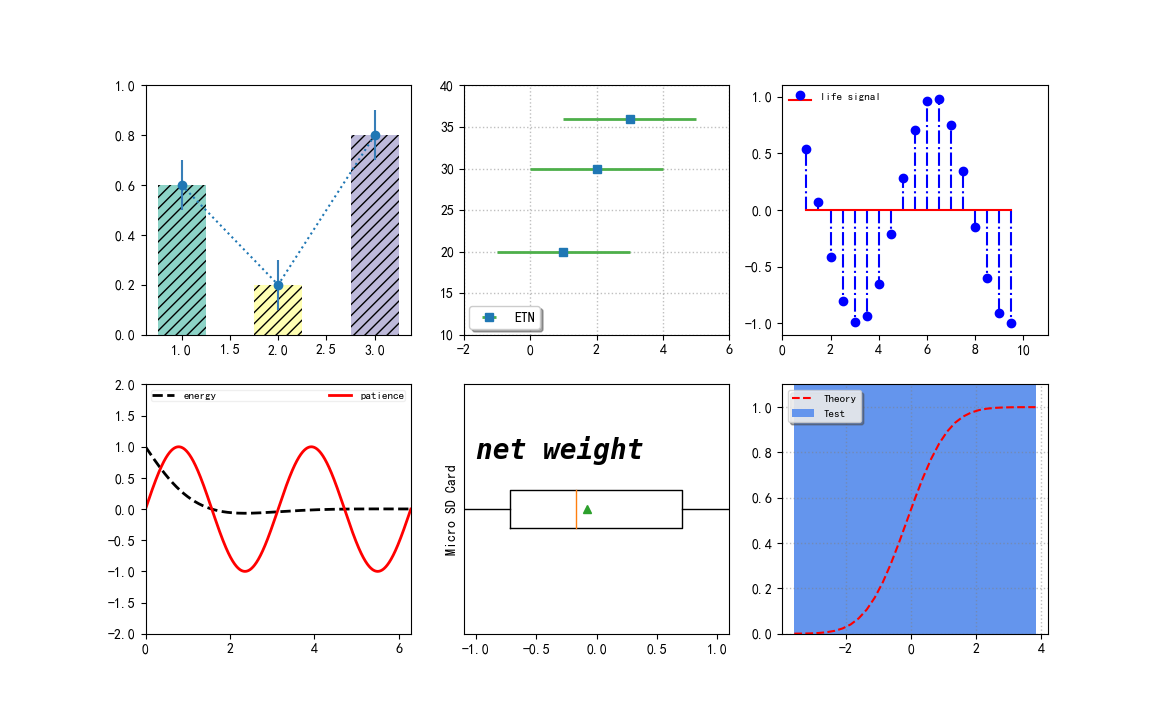
3. subplots()
创建一张画布带有多个子区的绘图模式
其返回值是
(fig, ax)的元组,fig是Figure的实例,ax是axis对象数组或者一个axis对象
【综合示例】
import numpy as np

import matplotlib.pyplot as plt

import matplotlib as mpl

mpl.use('Qt5Agg')

mpl.rcParams['font.sans-serif'] = ['SimHei']

mpl.rcParams['font.serif'] = ['SimHei']

mpl.rcParams['axes.unicode_minus'] = False  # 解决保存图像是负号'-'显示为方块的问题,或者转换负号为字符串

fig, ax = plt.subplots(2, 3)

# subplot(231)

colors = ["#8dd3c7", "#ffffb3", "#bebada"]

ax[0, 0].bar([1, 2, 3], [0.6, 0.2, 0.8], color=colors, width=0.5, hatch="///", align="center")

ax[0, 0].errorbar([1, 2, 3], [0.6, 0.2, 0.8], yerr=0.1, capsize=0, ecolor="#377eb8", fmt="o:")

ax[0, 0].set_ylim(0, 1.0)

# subplot(232)

ax[0, 1].errorbar([1, 2, 3], [20, 30, 36], xerr=2, ecolor="#4daf4a", elinewidth=2, fmt="s", label="ETN")

ax[0, 1].legend(loc=3, fancybox=True, shadow=True, fontsize=10, borderaxespad=0.4)

ax[0, 1].set_ylim(10, 40)

ax[0, 1].set_xlim(-2, 6)

ax[0, 1].grid(ls=":", lw=1, color="grey", alpha=0.5)

# subplot(233)

x3 = np.arange(1, 10, 0.5)

y3 = np.cos(x3)

ax[0, 2].stem(x3, y3, basefmt="r-", linefmt="b-.", markerfmt="bo", label="life signal", use_line_collection=True)

ax[0, 2].legend(loc=2, fontsize=8, frameon=False, borderpad=0.0, borderaxespad=0.6)

ax[0, 2].set_xlim(0, 11)

ax[0, 2].set_ylim(-1.1, 1.1)

# subplot(234)

x4 = np.linspace(0, 2 * np.pi, 500)

x4_1 = np.linspace(0, 2 * np.pi, 1000)

y4 = np.cos(x4) * np.exp(-x4)

y4_1 = np.sin(2 * x4_1)

line1, line2, = ax[1, 0].plot(x4, y4, "k--", x4_1, y4_1, "r-", lw=2)

ax[1, 0].legend((line1, line2), ("energy", "patience"),

                loc="upper center", fontsize=8, ncol=2,

                framealpha=0.3, mode="expand",

                columnspacing=2, borderpad=0.1)

ax[1, 0].set_ylim(-2, 2)

ax[1, 0].set_xlim(0, 2 * np.pi)

# subplot(235)

x5 = np.random.randn(100)

ax[1, 1].boxplot(x5, vert=False, showmeans=True, meanprops=dict(color="g"))

ax[1, 1].set_yticks([])

ax[1, 1].set_xlim(-1.1, 1.1)

ax[1, 1].set_ylabel("Micro SD Card")

ax[1, 1].text(-1.0, 1.2, "net weight", fontsize=20, style="italic",

              weight="black", family="monospace")

# subplot(236)

mu = 0.0

sigma = 1.0

x6 = np.random.randn(10000)

n, bins, patches = ax[1, 2].hist(x6, bins=30,

                                 histtype="stepfilled", cumulative=True,

                                 color="cornflowerblue", label="Test")

y = ((1 / (np.sqrt(2 * np.pi) * sigma)) * np.exp(-0.5 * (1 / sigma * (bins - mu)) ** 2))

y = y.cumsum()

y /= y[-1]

ax[1, 2].plot(bins, y, "r--", linewidth=1.5, label="Theory")

ax[1, 2].set_ylim(0.0, 1.1)

ax[1, 2].grid(ls=":", lw=1, color="grey", alpha=0.5)

ax[1, 2].legend(loc="upper left", fontsize=8, shadow=True, fancybox=True, framealpha=0.8)

# adjust subplots() layout

plt.subplots_adjust()

plt.show()
『Python』matplotlib划分画布的主要函数的更多相关文章
- 『Python』matplotlib坐标轴应用
1. 设置坐标轴的位置和展示形式 import numpy as np import matplotlib.pyplot as plt import matplotlib as mpl mpl.use ...
- 『Python』matplotlib初识
1. 核心原理 使用matplotlib绘图的原理,主要就是理解figure(画布).axes(坐标系).axis(坐标轴)三者之间的关系. 下面这幅图更详细: 以"美院学生张三写生画画&q ...
- 『Python』matplotlib的imshow用法
热力图是一种数据的图形化表示,具体而言,就是将二维数组中的元素用颜色表示.热力图之所以非常有用,是因为它能够从整体视角上展示数据,更确切的说是数值型数据. 使用imshow()函数可以非常容易地制作热 ...
- 『Python』matplotlib实现GUI效果
1. 类RadioButtons的使用方法 类似单选框 import numpy as np import matplotlib.pyplot as plt import matplotlib as ...
- 『Python』matplotlib实现动画效果
一般而言,在绘制复杂动画时,主要借助模块animation来完成 import numpy as np import matplotlib.pyplot as plt import matplotli ...
- 『Python』matplotlib共享绘图区域坐标轴
1. 共享单一绘图区域的坐标轴 有时候,我们想将多张图形放在同一个绘图区域,不想在每个绘图区域只绘制一幅图形.这时候,就可以借助共享坐标轴的方法实现在一个绘图区域绘制多幅图形的目的. import n ...
- 『Python』matplotlib常用图表
这里简要介绍几种统计图形的绘制方法,其他更多图形可以去matplotlib找examples魔改 1. 柱状图 柱状图主要是应用在定性数据的可视化场景中,或是离散数据类型的分布展示.例如,一个本科班级 ...
- 『Python』matplotlib常用函数
1. 绘制图表组成元素的主要函数 1.1 plot()--展现量的变化趋势 import numpy as np import matplotlib.pyplot as plt import matp ...
- 『Python』__getattr__()特殊方法
self的认识 & __getattr__()特殊方法 将字典调用方式改为通过属性查询的一个小class, class Dict(dict): def __init__(self, **kw) ...
随机推荐
- SQL 练习7
查询所有同学的学生编号.学生姓名.选课总数.所有课程的总成绩(没成绩的显示为 null ) SELECT Student.SId,sname,t.选课总数,t.总成绩 from Student LEF ...
- NOIP 模拟 $11\; \rm english$
题解 本题有一定代码难度 对于需要区间最大值,可以反过来考虑,先预处理出每个数所能扩展的最大边界,也就是说,求出一个最大的区间,其最大值为这个数,单调栈 \(\mathcal O(n)\) 求解 那么 ...
- vim宏录制
宏录制 当你要重复某一个操作时,录制的宏可以很快地帮你完成任务. 准备文本 <!DOCTYPE html> <html lang="en"> <hea ...
- (1)hadoop之----linux配置jdk环境
首先Linux中应有jdk包 运用flashFXP上传文件,xshell连接linux系统 我一般将文件放在个人目录下softwear目录 ,软件装在个人目录下app目录 cd software ...
- Int 2e 与 Sysenter区别
参考:张银奎<软件调试>第八章 Int 2e: Windows将2e号向量专门用作系统调用,在启动早起初始化中断描述表时便注册好了适合的服务例程.因此当NtDll中的NtReadFile发 ...
- BootStrap学习代码
要为毕设做准备了! 哎,毕设前台得自己来,所以打算学学bootstrap,把学习的代码放到码云上面了,使用HbuilderX来写,界面友好,适合我这种前端小白- 第一天就感受到了写html快捷键的强大 ...
- jQuery中获取属性值:attr()、html()、text()、val()等(一)
<!DOCTYPE html> <html> <head> <title>01_basic.html</title> <meta na ...
- urllib3中学到的LRU算法
介绍 urllib3._collections.py::RecentlyUserContainer类,是一个线程安全的Dict类容器,用来维护一定数量(maxsize)的Key-Value映射, 当数 ...
- OpenCV 生成矩形mask
生成mask的一种操作 cv::Mat mask = cv::Mat::zeros(300, 300, CV_8UC1); mask(cv::Rect(100,150,100, 50)) = 255; ...
- Django的基本运用(垃圾分类)
title: 利用Django实现一个能与用户交互的初级框架 author: Sun-Wind date: September 1, 2021 Django实现基本的框架 此框架的功能是搭建服务器,使 ...