一文读懂clickhouse集群监控
更多精彩内容,请关注微信公众号:后端技术小屋
一文读懂clickhouse集群监控
常言道,兵马未至,粮草先行,在clickhouse上生产环境之前,我们就得制定好相关的监控方案,包括metric采集、报警策略、图形化报表。有了全面有效的监控,我们就仿佛拥有了千里眼顺风耳,对于线上任何风吹草动都能及时感知,在必要的情况下提前介入以避免线上故障。
业界常用的监控方案一般是基于prometheus + grafana生态。本文将介绍由clickhouse-exporter(node-exporter) + prometheus + grafana组成的监控方案。
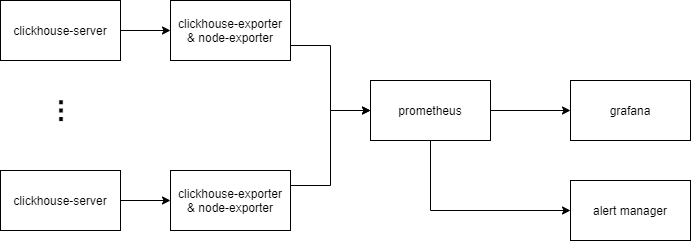
以上为监控方案示意图
- clickhouse-server中有4个系统表会记录进程内部的指标,分别是
system.metrics,system.asynchronous_metrics,system.events,system.parts - clickhuse-exporter是一个用于采集clickhouse指标的开源组件(https://github.com/ClickHouse/clickhouse_exporter),它会定时查询clickhouse-server中的系统表,转化成监控指标,并通过HTTP接口暴露给prometheus.
- node-exporter是一个用于采集硬件和操作系统相关指标的开源组件(https://github.com/prometheus/node_exporter)。
- prometheus定时抓取clickhouse-exporter暴露的指标,并判断报警条件是否被触发,是则推送到alert manager
- DBA可通过grafana看板实时查看当前clickhouse集群的运行状态
- DBA可通过alertmanager设置报警通知方式,如邮件、企业微信、电话等。
1 部署与配置
1.1 clickhouse-server
我们生产环境版本为20.3.8,按照官方文档部署即可。
1.2 clickhouse-exporter
clickhouse-exporter一般与clickhouse-server同机部署。
首先下载最新代码并编译(需预先安装Go)
git clone https://github.com/ClickHouse/clickhouse_exporter

cd clickhouse_exporter

go mod init

go mod vendor

go build

ls ./clickhouse_exporter
然后启动
export CLICKHOUSE_USER="user"

export CLICKHOUSE_PASSWORD="password"

nohup ./-scrape_uri=http://localhost:port/ >nohup.log 2>&1 &
最后检查指标是否被正常采集:
> curl localhost:9116/metrics | head

# TYPE clickhouse_arena_alloc_bytes_total counter

clickhouse_arena_alloc_bytes_total 9.799096840192e+12

# HELP clickhouse_arena_alloc_chunks_total Number of ArenaAllocChunks total processed

# TYPE clickhouse_arena_alloc_chunks_total counter

clickhouse_arena_alloc_chunks_total 2.29782524e+08

# HELP clickhouse_background_move_pool_task Number of BackgroundMovePoolTask currently processed

# TYPE clickhouse_background_move_pool_task gauge

clickhouse_background_move_pool_task 0

# HELP clickhouse_background_pool_task Number of BackgroundPoolTask currently processed
1.3 node-exporter
node-exporter需与clickhouse-server同机部署
首先下载最新代码并编译
git clone https://github.com/prometheus/node_exporter

make build

ls ./node_exporter
然后启动
nohup ./node_exporter > nohup.log 2>&1 &
最后检查指标是否被正常采集
> curl localhost:9100/metrics

# HELP go_gc_duration_seconds A summary of the GC invocation durations.

# TYPE go_gc_duration_seconds summary

go_gc_duration_seconds{quantile="0"} 6.3563e-05

go_gc_duration_seconds{quantile="0.25"} 7.4746e-05

go_gc_duration_seconds{quantile="0.5"} 9.0556e-05

go_gc_duration_seconds{quantile="0.75"} 0.000110677

go_gc_duration_seconds{quantile="1"} 0.004362325

go_gc_duration_seconds_sum 28.451282046

go_gc_duration_seconds_count 223479

...
1.4 prometheus
修改prometheus配置文件,添加alertmanager地址、clickhouse-exporter地址
prometheus.yml示例如下:
global:

  scrape_interval:     15s # Set the scrape interval to every 15 seconds. Default is every 1 minute.

  evaluation_interval: 15s # Evaluate rules every 15 seconds. The default is every 1 minute.

# Alertmanager configuration

alerting:

  alertmanagers:

  - static_configs:

    - targets:

      - alertmanager:9093

# Load rules once and periodically evaluate them according to the global 'evaluation_interval'.

rule_files:

  - ./rules/*.rules

# A scrape configuration containing exactly one endpoint to scrape:

# Here it's Prometheus itself.

scrape_configs:

  # The job name is added as a label `job=<job_name>` to any timeseries scraped from this config.

  - job_name: 'clickhouse'

    # metrics_path defaults to '/metrics'

    # scheme defaults to 'http'.

    static_configs:

    - targets: ['clickhouseexporter1:9116', 'clickhouseexporter2:9116', ...]
*.rules示例如下:
groups:

 - name: qps_too_high

   rules:

   - alert: clickhouse qps超出阈值

     expr: rate(clickhouse_query_total[1m]) > 100

     for: 2m

     labels:

      job: clickhouse-server

      severity: critical

      alertname: clickhouse qps超出阈值

     annotations:

      summary: "clickhouse qps超出阈值"

      description: "clickhouse qps超过阈值(100), qps: {{ $value }}"
启动promethus
nohup ./prometheus --config.file=/path/to/config --storage.tsdb.path=/path/to/storage --web.external-url=prometheus --web.enable-admin-api --web.enable-lifecycle --log.level=warn >nohup.log 2>&1 &
浏览器输入http://prometheus_ip:9090检查prometheus状态
1.5 alert manager
首先修改配置文件
配置文件示例如下:
route:

  receiver: 'default'

  group_by: ['service','project']

receivers:

- name: "电话"

  webhook_configs:

  - url: <url>

- name: "企业微信"

  webhook_configs:

  - url: <url>

- name: "邮箱"

  webhook_configs:

  - url: <url>
然后启动
nohup ./alertmanager --config.file=/path/to/config --log.level=warn >nohup.log 2>&1 &
1.6 grafana
关于clickhouse的dashboard模板已经有很多,在这里推荐:https://grafana.com/grafana/dashboards/882 将它导入到新建的grafana dashboard之后,即可得到漂亮的clickhouse集群看板(可能需要微调)。
另外建议安装clickhouse datasource插件。有了这个插件便能在grafana中配置clickhouse数据源,并通过Clickhouse SQL配置图表,详细文档见:https://grafana.com/grafana/plugins/vertamedia-clickhouse-datasource
2 重要指标和监控
我们可以看到,不管是node-exporter还是clickhouse-exporter,它们的指标种类很多,大概有几百个。我们的策略是抓大放小,对于重要的指标才设置报警策略并创建看板。
下面列举一些个人觉得比较重要的指标
2.1 系统指标
系统指标由node-exporter采集
| 指标名 | 指标含义 | 报警策略 | 策略含义 |
|---|---|---|---|
| node_cpu_seconds_total | 机器累计cpu时间(单位s) | 100 * sum without (cpu) (rate(node_cpu_seconds_total{mode='user'}[5m])) / count without (cpu) (node_cpu_seconds_total{mode='user'}) > 80 | 用户态cpu利用率大于80%则报警 |
| node_filesystem_size_bytes/node_filesystem_avail_bytes | 机器上个文件分区容量/可用容量 | 100 * (node_filesystem_size_bytes{mountpoint="/data"} - node_filesystem_avail_bytes{mountpoint="/data"}) / node_filesystem_size_bytes{mountpoint="/data"} > 80 | /data盘占用超过80%则报警 |
| node_load5 | 5分钟load值 | node_load5 > 60 | 5分钟load值超过60则报警(可根据具体情况设置阈值) |
| node_disk_reads_completed_total | 累计读磁盘请求次数 | rate(node_disk_reads_completed_total[5m]) > 200 | read iops超过200则报警 |
2.2 clickhouse指标
| 指标名 | 指标含义 | 报警策略 | 策略含义 |
|---|---|---|---|
| clickhouse_exporter_scrape_failures_total | prometheus抓取exporter失败总次数 | increase(clickhouse_exporter_scrape_failures_total[5m]) > 10 | prometheus抓取export失败次数超过阈值则报警,说明此时ch服务器可能发生宕机 |
| promhttp_metric_handler_requests_total | exporter请求clickhouse失败总次数 | increase(promhttp_metric_handler_requests_total{code="200"}[2m]) == 0 | 2分钟内查询clickhouse成功次数为零则报警,说明此时某个ch实例可能不可用 |
| clickhouse_readonly_replica | ch实例中处于只读状态的表个数 | clickhouse_readonly_replica > 5 | ch中只读表超过5则报警,说明此时ch与zk连接可能发生异常 |
| clickhouse_query_total | ch已处理的query总数 | rate(clickhouse_query_total[1m]) > 30 | 单实例qps超过30则报警 |
| clickhouse_query | ch中正在运行的query个数 | clickhouse_query > 30 | 单实例并发query数超过阈值则报警 |
| clickhouse_tcp_connection | ch的TCP连接数 | clickhouse_tcp_connection > XXX | 略 |
| clickhouse_http_connection | ch的HTTP连接数 | clickhouse_http_connection > XXX | 略 |
| clickhouse_zoo_keeper_request | ch中正在运行的zk请求数 | clickhouse_zoo_keeper_request > XXX | 略 |
| clickhouse_replicas_max_queue_size | ch中zk副本同步队列的长度 | clickhouse_replicas_max_queue_size > 100 | zk副本同步队列长度超过阈值则报警,说明此时副本同步队列出现堆积 |
2.3 其他常用SQL
在clickhouse中,所有被执行的Query都会记录到system.query_log表中。因此我们可通过该表监控集群的查询情况。以下列举几种用于监控的常用SQL。为了更方便的查看,可添加到grafana看板中。
最近查询
SELECT

    event_time,

    user,

    query_id AS query,

    read_rows,

    read_bytes,

    result_rows,

    result_bytes,

    memory_usage,

    exception

FROM clusterAllReplicas('cluster_name', system, query_log)

WHERE (event_date = today()) AND (event_time >= (now() - 60)) AND (is_initial_query = 1) AND (query NOT LIKE 'INSERT INTO%')

ORDER BY event_time DESC

LIMIT 100
慢查询
SELECT

    event_time,

    user,

    query_id AS query,

    read_rows,

    read_bytes,

    result_rows,

    result_bytes,

    memory_usage,

    exception

FROM clusterAllReplicas('cluster_name', system, query_log)

WHERE (event_date = yesterday()) AND query_duration_ms > 30000 AND (is_initial_query = 1) AND (query NOT LIKE 'INSERT INTO%')

ORDER BY query_duration_ms desc

LIMIT 100
Top10大表
SELECT

    database,

    table,

    sum(bytes_on_disk) AS bytes_on_disk

FROM clusterAllReplicas('cluster_name', system, parts)

WHERE active AND (database != 'system')

GROUP BY

    database,

    table

ORDER BY bytes_on_disk DESC

LIMIT 10
Top10查询用户
SELECT

    user,

    count(1) AS query_times,

    sum(read_bytes) AS query_bytes,

    sum(read_rows) AS query_rows

FROM clusterAllReplicas('cluster_name', system, query_log)

WHERE (event_date = yesterday()) AND (is_initial_query = 1) AND (query NOT LIKE 'INSERT INTO%')

GROUP BY user

ORDER BY query_times DESC

LIMIT 10
更多精彩内容,请扫码关注微信公众号:后端技术小屋。如果觉得文章对你有帮助的话,请多多分享、转发、在看。
- STL源码分析--vector
- zookeeper client原理总结
- redis实现分布式锁
- 推荐几个好用的效率神器
- C/C++关键字之restrict
- 现代C++之右值语义
- Python乱码九问
- Linux Shell脚本攻略读书笔记

一文读懂clickhouse集群监控的更多相关文章
- 即时通讯新手入门:一文读懂什么是Nginx?它能否实现IM的负载均衡?
本文引用了“蔷薇Nina”的“Nginx 相关介绍(Nginx是什么?能干嘛?)”一文部分内容,感谢作者的无私分享. 1.引言 Nginx(及其衍生产品)是目前被大量使用的服务端反向代理和负载均衡 ...
- kubernetes基础——一文读懂k8s
容器 容器与虚拟机对比图(左边为容器.右边为虚拟机) 容器技术是虚拟化技术的一种,以Docker为例,Docker利用Linux的LXC(LinuX Containers)技术.CGroup(Co ...
- 一文读懂Java动态代理
作者 :潘潘 日期 :2020-11-22 事实上,对于很多Java编程人员来说,可能只需要达到从入门到上手的编程水准,就能很好的完成大部分研发工作.除非自己强主动获取,或者工作倒逼你学习,否则我们好 ...
- 一文读懂数仓中的pg_stat
摘要:GaussDB(DWS)在SQL执行过程中,会记录表增删改查相关的运行时统计信息,并在事务提交或回滚后记录到共享的内存中.这些信息可以通过 "pg_stat_all_tables视图& ...
- DB监控-Riak集群监控
公司的Riak版本是2.0.4,目前已根据CMDB三级业务部署了十几套集群,大部分是跨机房部署.监控采集分为两个大的维度,第一个维度是单机,也就是 「IP:端口」:第二个维度是集群,也就是所有节点指标 ...
- Hbase集群监控
Hbase集群监控 Hbase Jmx监控 监控每个regionServer的总请求数,readRequestsCount,writeRequestCount,region分裂,region合并,St ...
- 理解OpenShift(7):基于 Prometheus 的集群监控
理解OpenShift(1):网络之 Router 和 Route 理解OpenShift(2):网络之 DNS(域名服务) 理解OpenShift(3):网络之 SDN 理解OpenShift(4) ...
- 一文读懂高性能网络编程中的I/O模型
1.前言 随着互联网的发展,面对海量用户高并发业务,传统的阻塞式的服务端架构模式已经无能为力.本文(和下篇<高性能网络编程(六):一文读懂高性能网络编程中的线程模型>)旨在为大家提供有用的 ...
- 从HTTP/0.9到HTTP/2:一文读懂HTTP协议的历史演变和设计思路
本文原作者阮一峰,作者博客:ruanyifeng.com. 1.引言 HTTP 协议是最重要的互联网基础协议之一,它从最初的仅为浏览网页的目的进化到现在,已经是短连接通信的事实工业标准,最新版本 HT ...
随机推荐
- git从安装到多账户操作一套搞定(二)多账户使用
作者:良知犹存 转载授权以及围观:欢迎添加微信:Allen-Iverson-me-LYN 总述 GIT是当今热门代码管理技术,但是如此火的系统,竟然是大神林纳斯花了两周用C写出来的一个分布式版 ...
- Educational Codeforces Round 97 (Rated for Div. 2)【ABCD】
比赛链接:https://codeforces.com/contest/1437 A. Marketing Scheme 题解 令 \(l = \frac{a}{2}\),那么如果 \(r < ...
- HDU5740 Glorious Brilliance【最短路 KM匹配】
HDU5740 Glorious Brilliance 题意: 给出一张不一定合法的染色图,每次可以交换相邻两点的颜色,问最少多少次能使染色图合法 合法的染色图相邻点的颜色不能相同 题解: 首先要确定 ...
- 2018-2019 ACM-ICPC, NEERC, Southern Subregional Contest, Qualification Stage(11/12)
2018-2019 ACM-ICPC, NEERC, Southern Subregional Contest, Qualification Stage A. Coffee Break 排序之后优先队 ...
- c语言实现n!算法
最近一面学习数据结构,一面在做些c语言的题目.这个题目前些天碰到,和同学讨论了下.于是就用c语言实现n!(n=10000) 1 #include<stdio.h> 2 #define MA ...
- 【poj 1182】食物链(图论--带权并查集)
题意:有3种动物A.B.C,形成一个"A吃B, B吃C,C吃A "的食物链.有一个人对N只这3类的动物有M种说法:第一种说法是"1 X Y",表示X和Y是同类. ...
- Kuroni and the Punishment CodeForces - 1305F 随机函数mt19937 + 质因子分解
题意: 给你n个数,你每次操作可以对一个数加1或者减1,让你求你最少需要操作多少次可以使这n个数的公因子大于1 题解: 正常方法就是枚举质因子(假设质因子为x),然后对于这个数组中的数a[i],让a[ ...
- python 编码问题随笔
原文点击这里 借用原作者的一句话"据说,每个做 Python 开发的都被字符编码的问题搞晕过,最常见的错误就是 UnicodeEncodeError.UnicodeDecodeError,你 ...
- Flow All In One
Flow All In One Flow is a static type checker for JavaScript https://github.com/facebook/flow https: ...
- chown -R & chmod 777 & chmod +x
chown -R & chmod 777 & chmod +x https://linux.die.net/man/1/chown chown - change file owner ...