matplotlib 操作子图(subplot,axes)
Matplotlib 中文用户指南 3.3 使用 GridSpec 自定义子图位置
- ax:matplotlib.axes._subplots.AxesSubplot,的基本操作
ax.set_xticks([]), ax_set_yticks([]):关闭坐标刻度ax.axis('off'):关闭坐标轴ax.set_title():设置标题
1. subplots
fig, ax = plt.subplots(nrows=1, ncols=2, figsize=(8, 4))

ax[0].plot(...)

ax[0].set_xlabel(...)

ax[0].set_title(...)

ax[1].plot(...)

ax[1].set_xlabel(...)

...
fig, (ax1, ax2, ax3) = plt.subplots(3, 1, sharex=True)更一般的做法(也是matlab的风格)是这样的:
fig = plt.figure()          # 创建一个figure对象,底下的一切显示均在此figure上完成

plt.subplot(121)

plt.imshow(img1)

plt.subplot(122)

plt.imshow(img2)

plt.show()

# 当然放在一个range里边

for i in range(ndim):

    plt.subplot(ndim//5, 5, i+1)

    plt.hist()
2. subplot2grid
subplot2grid
# 以下两条语句等价

ax = plt.subplot2grid((2,2),(0, 0))

ax = plt.subplot(221) # 下标从 0 开始- colspan、rowspan 与 索引的对应关系
import matplotlib.pyplot as plt

def disable_axis(ax):

    ax.set_xticks([])

    ax.set_yticks([])

    # ax.axis('off')

def set_title(ax, title):

    ax.set_title(title)

def subplot2grid_demo():

    ax1 = plt.subplot2grid((3, 3), (0, 0), colspan=2)

    disable_axis(ax1)

    set_title(ax1, 'ax1')

    ax2 = plt.subplot2grid((3, 3), (1, 0))

    disable_axis(ax2)

    set_title(ax2, 'ax2')

    ax3 = plt.subplot2grid((3, 3), (1, 1))

    disable_axis(ax3)

    set_title(ax3, 'ax3')

    ax4 = plt.subplot2grid((3, 3), (0, 2), rowspan=2)

    disable_axis(ax4)

    set_title(ax4, 'ax4')

    ax5 = plt.subplot2grid((3, 3), (2, 0), colspan=3)

    disable_axis(ax5)

    set_title(ax5, 'ax5')

    # plt.xticks([])

    # plt.yticks([])

    # plt.axis('off')

    plt.show()

if __name__ == '__main__':

    subplot2grid_demo()
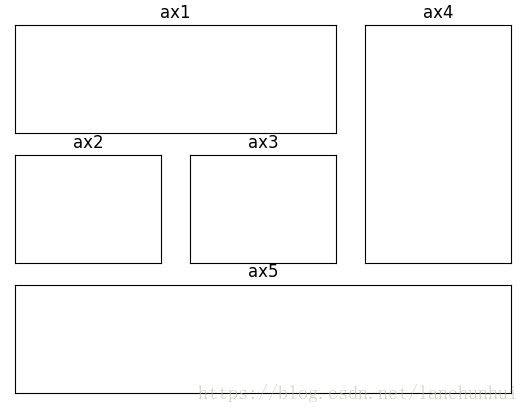
3. GridSpec:方便的切片操作
GridSpec 提供了十分方便的切片操作,实现上述功能,则只需如下代码:
def gridspec_demo():

    gs = gridspec.GridSpec(3, 3)

    ax1 = plt.subplot(gs[0, :2])

    ax2 = plt.subplot(gs[1, 0])

    ax3 = plt.subplot(gs[1, 1])

    ax4 = plt.subplot(gs[0:2, 2])

    ax5 = plt.subplot(gs[2:, :])

    plt.show()
matplotlib 操作子图(subplot,axes)的更多相关文章
- (转)Matplotlib的子图subplot的使用
转:https://www.jianshu.com/p/de223a79217a 前言 Matplotlib的可以把很多张图画到一个显示界面,这就设计到面板切分成一个一个子图.这是怎么做到的呢.mat ...
- Matlab绘制子图subplot使用攻略
参考:https://jingyan.baidu.com/article/915fc414ad794b51394b20e1.html Matlab绘制子图subplot使用攻略 听语音 原创 | 浏览 ...
- matplotlib 的 subplot, axes and axis
fig = plt.figure('多图', (10, 10), dpi=80) #第一个指定窗口名称,第二个指定图片大小,创建一个figure对象 plt.subplot(222) #2*2的第二个 ...
- matplotlib ----- 多子图, subplots
这一篇讲的比较详细. http://matplotlib.org/examples/pylab_examples/subplots_demo.html 官方文档给出的subplots用法, http: ...
- matplotlib添加子图(拼图功能)
我们已经知道,matplotlib是python中的一个十分好用的作图库,它的简单的使用方法可以在之前的随笔中找到.传送门:https://www.cnblogs.com/chester-cs/p/1 ...
- matplotlib画子图时设置总标题
matplotlib subplots绘图时 设置总标题 :fig.suptitle(name)
- matplotlib调整子图大小
因为子图太多而导致每个子图很小,很密,如何调整
- matplotlib绘制子图
fig,subs = plt.subplots(2,2) subs[0][0].plot(data_math_C1) subs[0][0].set_title('C_1 曲线') subs[0][1] ...
- python使用matplotlib:subplot绘制多个子图
1 问题描述 matploglib 能够绘制出精美的图表, 有些时候, 我们希望把一组图放在一起进行比较, 有没有什么好的方法呢? matplotlib 中提供的 subplot 可以很好的解决这个问 ...
随机推荐
- codeforces 350 div2 C. Cinema map标记
C. Cinema time limit per test 2 seconds memory limit per test 256 megabytes input standard input out ...
- c++ 查找容器中符合条件的元素,并返回iterator(find_if)
#include <iostream> // std::cout #include <algorithm> // std::find_if #include <vecto ...
- JS中dataTransfer对象在拖曳操作中的妙用。
转载 原文 https://my.oschina.net/jiangli0502/blog/179197 dataTransfer对象提供了对于预定义的剪贴板格式的访问,以便在拖曳操作中使用. 通 ...
- ASP.NET MVC实现网站验证码功能
网站添加验证码,主要为防止机器人程序批量注册,或对特定的注册用户用特定程序暴力破解方式,以进行不断的登录.灌水等危害网站的操作.验证码被广泛应用在注册.登录.留言等提交信息到服务器端处理的页面中. 在 ...
- django模型和字段
一个模型(model)就是一个单独的.确定的数据的信息源,包含了数据的字段和操作方法.通常,每个模型映射为一张数据库中的表. 基本的原则如下: 每个模型在Django中的存在形式为一个Python类 ...
- RabbitMQ入门_11_DLX
参考资料:https://www.rabbitmq.com/dlx.html 队列中的消息可能会成为死信消息(dead lettered).让消息成为死信消息的事件有: 消息被取消确认(nack 或 ...
- 流氓 2345.com的新动态及解决方法
安装了[电脑公司]的Win7_SP1之后, IE的主页被绑架. 症状是先转到 IE959.com,然后自动跳转到 www.2345.com 网上当然有很多例子了,可是都没有效果. 1. 更改IE设置没 ...
- ISO 8859-1 对照表 (扩展ASCII码表)
1. 0---127 是ASCII码 2.128--255 加了一些特殊符号 DEC OCT HEX BIN Symbol HTML Number HTML Name Description 128 ...
- R语言plot函数参数合集
最近用R语言画图,plot 函数是用的最多的函数,而他的参数非常繁多,由此总结一下,以供后续方便查阅. plot(x, y = NULL, type = "p", xlim = N ...
- 雷林鹏分享:Ruby 安装 - Windows
Ruby 安装 - Windows 下面列出了在 Windows 机器上安装 Ruby 的步骤. 注意:在安装时,您可能有不同的可用版本. 下载最新版的 Ruby 压缩文件.请点击这里下载. 下载 R ...