机器学习初入门03 - Matplotlib
这一部分很简单,所以以代码的形式给出,在实际学习开发中,Matplotlib最好只把它当成一个画图的工具来用,没有必要深究其实现原理是什么。
一、折线图的绘制
import pandas as pd
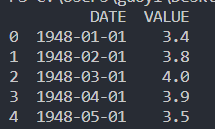
unrate = pd.read_csv("unrate.csv")
print(unrate.head(5))
#pandas应该会自动把xxxx/xx/xx转化为标准时间格式xxxx-xx-xx,如果没有,用下面一行代码实现
# unrate["DATE"] = pd.to_datetime(unrate["DATE"])
原始数据: 代码执行结果:

import matplotlib.pyplot as plt
#画图
plt.plot()
#把画的图显示出来
plt.show()

first_twelve = unrate[0:12]
#第一个参数为横轴,第二个参数为纵轴
plt.plot(first_twelve["DATE"], first_twelve["VALUE"])
plt.show()

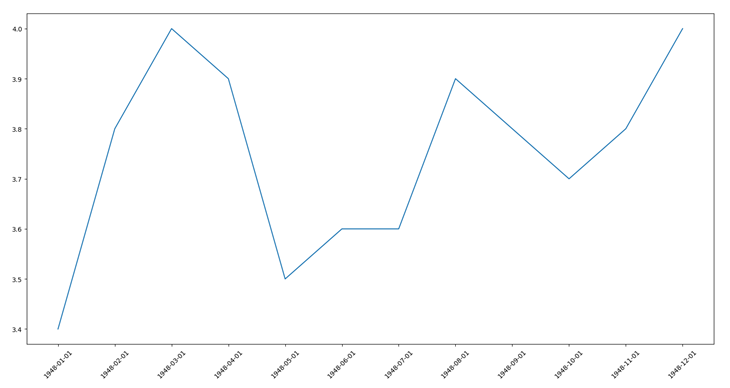
#可以看到上图的横坐标丑的一匹,怎么办呢
plt.plot(first_twelve["DATE"], first_twelve["VALUE"])
#指定x轴标签的角度
plt.xticks(rotation=45)
plt.show()
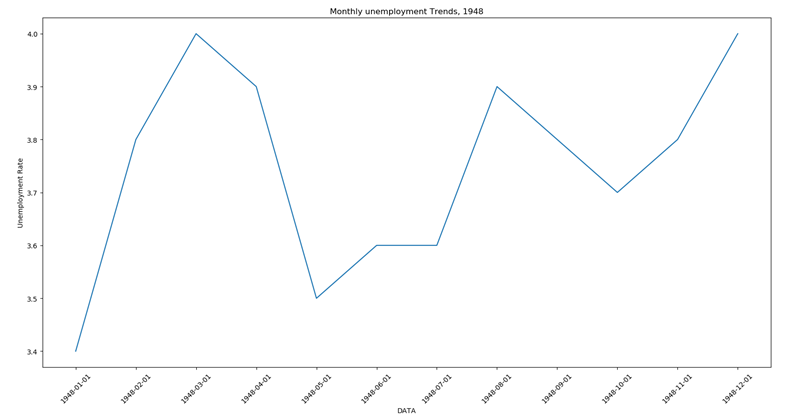
#给图像加标签
plt.plot(first_twelve["DATE"], first_twelve["VALUE"])
plt.xticks(rotation=45)
plt.xlabel("DATA")
plt.ylabel('Unemployment Rate')
plt.title('Monthly unemployment Trends, 1948')
plt.show()
二、子图操作
import matplotlib.pyplot as plt
#定义画图区域
fig = plt.figure()
#画子图
#前两个参数代表是一个2*2的画图区域,最后一个参数表示该子图的位置
ax1 = fig.add_subplot(2,2,1)
ax2 = fig.add_subplot(2,2,2)
ax3 = fig.add_subplot(2,2,4)
plt.show()

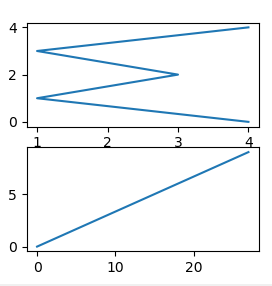
import numpy as np
#指定画图区域的大小
fig = plt.figure(figsize = (3,3))
ax1 = fig.add_subplot(2,1,1)
ax2 = fig.add_subplot(2,1,2)
ax1.plot(np.random.randint(1,5,5), np.arange(5))
ax2.plot(np.arange(10)*3, np.arange(10))
plt.show()
import pandas as pd
unrate = pd.read_csv("unrate.csv")
unrate["DATE"] = pd.to_datetime(unrate["DATE"])
unrate['MONTH'] = unrate['DATE'].dt.month
fig = plt.figure(figsize=(6,3))
#在一个图里画多条折线,c指定颜色,可以直接是颜色名称,也可以是RGB值
plt.plot(unrate[0:12]["MONTH"], unrate[0:12]['VALUE'], c='red')
plt.plot(unrate[12:24]["MONTH"], unrate[12:24]['VALUE'], c='blue')
plt.show()

fig = plt.figure(figsize=(10, 6))
colors = ['red', 'blue', 'green', 'orange', 'black']
for i in range(5):
subset = unrate[start_index:end_index]
label = str(1948 + i)
plt.plot(subset['MONTH'], subset["VALUE"], c=colors[i], label=label)
#标签框出现在哪
plt.legend(loc='best')
plt.show()

三、条形图与散点图
import pandas as pd
reviews = pd.read_csv('fandango_scores.csv')
cols = [
'FILM', 'RT_user_norm', 'Metacritic_user_nom', 'IMDB_norm',
'Fandango_Ratingvalue', 'Fandango_Stars'
]
norm_reviews = reviews[cols]
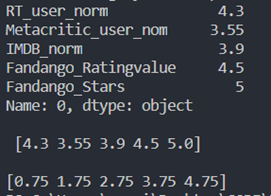
print(norm_reviews[:1] , '\n')
import matplotlib.pyplot as plt
from numpy import arange
num_cols = [
'RT_user_norm', 'Metacritic_user_nom', 'IMDB_norm', 'Fandango_Ratingvalue',
'Fandango_Stars'
]
#定义条形图的条高
框也一样。
框是指定column,但是在python3中ix是不赞成使用的
# bar_heights = norm_reviews.ix[0,num_cols].values
bar_heights = norm_reviews.loc[0][num_cols].values
print(norm_reviews.loc[0][num_cols], '\n\n', bar_heights, '\n')
#定义条的位置,即离原点有多远
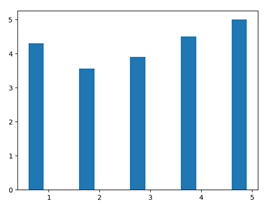
bar_positions = arange(5) + 0.75
print(bar_positions)
ax = plt.subplot()
#画条形图,第三个参数定义条宽
ax.bar(bar_positions, bar_heights, 0.3)
plt.show()
bar_heights = norm_reviews.loc[0][num_cols].values
#python range() 函数可创建一个整数列表
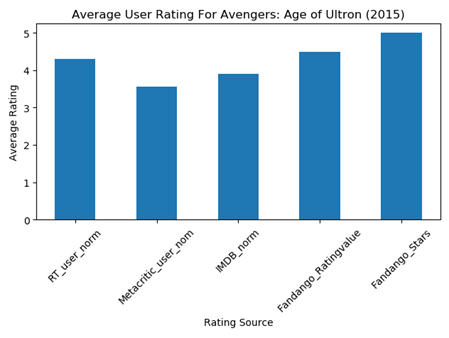
tick_positions = range(1, 6)
ax = plt.subplot()
ax.bar(bar_positions, bar_heights, 0.5)
ax.set_xticks(tick_positions)
ax.set_xticklabels(num_cols, rotation=45)
ax.set_xlabel('Rating Source')
ax.set_ylabel('Average Rating')
ax.set_title('Average User Rating For Avengers: Age of Ultron (2015)')
#如果图片显示不全,用下面的命令
plt.tight_layout()
plt.show()
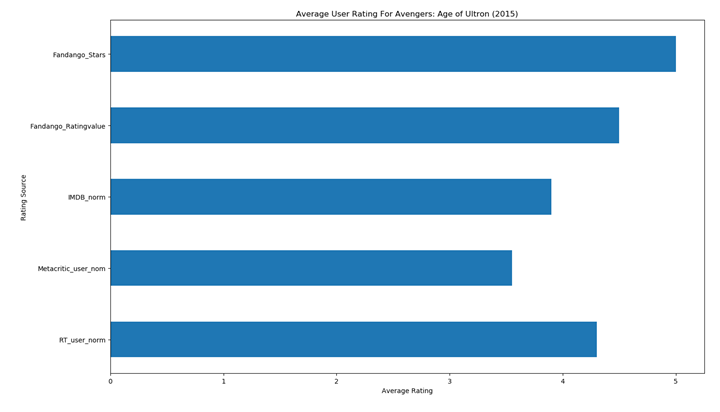
bar_widths = norm_reviews.loc[0][num_cols].values
tick_positions = range(1, 6)
ax = plt.subplot()
ax.barh(bar_positions, bar_widths, 0.5)
ax.set_yticks(tick_positions)
ax.set_yticklabels(num_cols)
ax.set_ylabel('Rating Source')
ax.set_xlabel('Average Rating')
ax.set_title('Average User Rating For Avengers: Age of Ultron (2015)')
plt.tight_layout()
plt.show()
#画散点图
ax = plt.subplot()
ax.scatter(norm_reviews['Fandango_Ratingvalue'], norm_reviews['RT_user_norm'])
ax.set_xlabel('Fandango')
ax.set_ylabel('Rotten Tomatoes')
plt.show()
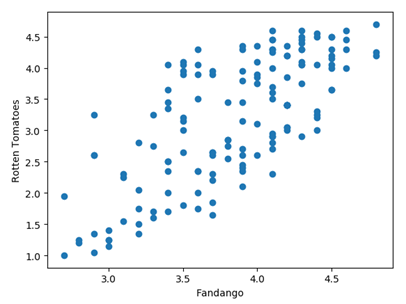
fig = plt.figure(figsize=(5, 10))
ax1 = fig.add_subplot(2, 1, 1)
ax2 = fig.add_subplot(2, 1, 2)
ax1.scatter(norm_reviews['Fandango_Ratingvalue'], norm_reviews['RT_user_norm'])
ax1.set_xlabel('Fandango')
ax1.set_ylabel('Rotten Tomatoes')
ax2.scatter(norm_reviews['RT_user_norm'], norm_reviews['Fandango_Ratingvalue'])
ax2.set_xlabel('Rotten Tomatoes')
ax2.set_ylabel('Fandango')
plt.show()

四、柱形图与盒图
import pandas as pd
import matplotlib.pyplot as plt
reviews = pd.read_csv('fandango_scores.csv')
cols = [
'FILM', 'RT_user_norm', 'Metacritic_user_nom', 'IMDB_norm',
'Fandango_Ratingvalue', 'Fandango_Stars'
]
norm_reviews = reviews[cols]
# print(norm_reviews[:5])
fandango_distribution = norm_reviews['Fandango_Ratingvalue'].value_counts()
fandango_distribution = fandango_distribution.sort_index()
imdb_distribution = norm_reviews['IMDB_norm'].value_counts()
imdb_distribution = imdb_distribution.sort_index()
ax = plt.subplot()
个
ax.hist(norm_reviews['Fandango_Ratingvalue'])
# ax.hist(norm_reviews['Fandango_Ratingvalue'],bins=20)
# range指定显示在图上的总区间
# ax.hist(norm_reviews['Fandango_Ratingvalue'], range=(4, 5), bins=20)
plt.show()
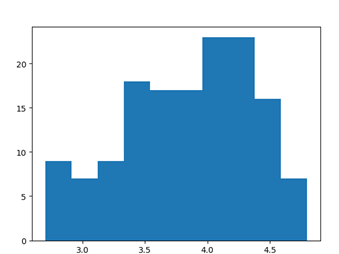
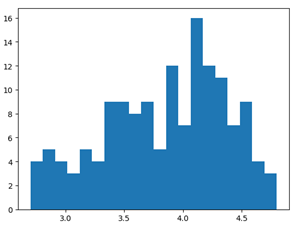

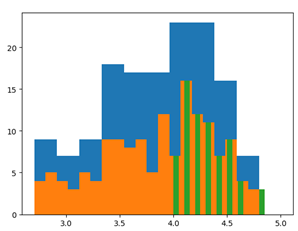
fig = plt.figure(figsize=(5, 20))
ax1 = fig.add_subplot(1, 4, 1)
ax2 = fig.add_subplot(1, 4, 2)
ax3 = fig.add_subplot(1, 4, 3)
ax4 = fig.add_subplot(1, 4, 4)
ax1.hist(norm_reviews['Fandango_Ratingvalue'], bins=20, range=(0, 5))
ax1.set_title('Distribution of Fandango Ratings')
#指定y轴区间
ax1.set_ylim(0, 50)
ax2.hist(norm_reviews['RT_user_norm'], 20, range=(0, 5))
ax2.set_title('Distribution of Rotten Tomatoes Ratings')
ax2.set_ylim(0, 50)
ax3.hist(norm_reviews['Metacritic_user_nom'], 20, range=(0, 5))
ax3.set_title('Distribution of Metacritic Ratings')
ax3.set_ylim(0, 50)
ax4.hist(norm_reviews['IMDB_norm'], 20, range=(0, 5))
ax4.set_title('Distribution of IMDB Ratings')
ax4.set_ylim(0, 50)
plt.show()

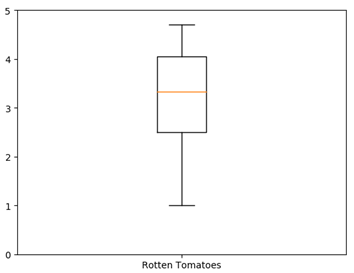
#画盒图
ax = plt.subplot()
ax.boxplot(norm_reviews['RT_user_norm'])
ax.set_xticklabels(['Rotten Tomatoes'])
ax.set_ylim(0, 5)
plt.show()
num_cols = [
'RT_user_norm', 'Metacritic_user_nom', 'IMDB_norm', 'Fandango_Ratingvalue'
]
fig, ax = plt.subplots()
ax.boxplot(norm_reviews[num_cols].values)
ax.set_xticklabels(num_cols, rotation=90)
ax.set_ylim(0, 5)
plt.tight_layout()
plt.show()

机器学习初入门03 - Matplotlib的更多相关文章
- 机器学习初入门04 – Seaborn(持续更新)
Seaborn库可以说是在matplotlib库上的一个封装,它给我们提供了非常丰富的模板 一.整体布局风格设置 import seaborn as sns import numpy as np im ...
- 机器学习初入门02 - Pandas的基本操作
之前的numpy可以说是一个针对矩阵运算的库,这个Pandas可以说是一个实现数据处理的库,Pandas底层的许多函数正是基于numpy实现的 一.Pandas数据读取 1.pandas.read_c ...
- 机器学习初入门01-numpy的基础用法
一.numpy基础结构 1. numpy.genformtxt('路径名', delimiter = '分割符', dytype = 读取方式如str ):读取一个文件,返回一个numpy.ndarr ...
- 机器学习简易入门(四)- logistic回归
摘要:使用logistic回归来预测某个人的入学申请是否会被接受 声明:(本文的内容非原创,但经过本人翻译和总结而来,转载请注明出处) 本文内容来源:https://www.dataquest.io/ ...
- CSS3基础入门03
CSS3 基础入门03 线性渐变 在css3当中,通过渐变属性实现之前只能通过图片实现的渐变效果.渐变分为线性渐变和径向渐变以及重复渐变三种.线性渐变的模式主要是颜色从一个方向过渡到另外一个方向,而径 ...
- 【网络爬虫入门03】爬虫解析利器beautifulSoup模块的基本应用
[网络爬虫入门03]爬虫解析利器beautifulSoup模块的基本应用 1.引言 网络爬虫最终的目的就是过滤选取网络信息,因此最重要的就是解析器了,其性能的优劣直接决定这网络爬虫的速度和效率.B ...
- SpringBoot 初入门
SpringBoot 初入门 关于介绍什么之类的就不讲了,主要做一下学习记录. 1. 启动方式 IDEA 启动 命令行启动: mvn spring-boot:run 部署到服务器启动: 先进行打包, ...
- Andrew Ng机器学习算法入门(一):简介
简介 最近在参加一个利用机器学习来解决安全问题的算法比赛,但是对机器学习的算法一直不了解,所以先了解一下机器学习相关的算法. Andrew Ng就是前段时间从百度离职的吴恩达.关于吴恩达是谁,相信程序 ...
- 机器学习入门03 - 降低损失 (Reducing Loss)
原文链接:https://developers.google.com/machine-learning/crash-course/reducing-loss/ 为了训练模型,需要一种可降低模型损失的好 ...
随机推荐
- 在eclipse中方便的比较各个语言 资源文件—jinto的安装
一.下载与安装jinto Eclipse插件的插件,用来解决资源文件的国际化问题 用jinto编辑器打开properties文件后,就可以方便的建立出各国和各种语言的资源文件,同时可以方便的对比书写各 ...
- Docker 使用入门,创建一个Nginx服务器
运行环境: MAC Docker 版本: Docker version 17.12.0-ce, build c97c6d6 一.启动Nginx 服务器 启动Nginx 服务器,并进入模拟终端 dock ...
- SAP跟踪前台操作导致的后台查询语句
SAP跟踪前台操作导致的后台查询语句,通过这个可以查看前台对应了后台的数据库表,然后可以通过se11查看表内容,也可以删除表内容. 在sap升级的时候,首先需要拷贝正式的sap系统,然后将拷贝的系统中 ...
- BZOJ4923:[Lydsy1706月赛]K小值查询(Splay)
Description 维护一个长度为n的正整数序列a_1,a_2,...,a_n,支持以下两种操作: 1 k,将序列a从小到大排序,输出a_k的值. 2 k,将所有严格大于k的数a_i减去k. In ...
- 如何永久激活(破解) IntelliJ IDEA 2018.1.3
版权声明:本文为博主原创文章,转载不需要博主同意,只需贴上原文链接即可. https://blog.csdn.net/zhige_me/article/details/80369336 1.去官网下载 ...
- 天地图api地址
天地图地址 http://lbs.tianditu.com/api-new/examples.html 参考资料 http://lbs.tianditu.com/api-new/class.html
- php大流量高并发解决方案
一.硬件 提升硬件,影响因素有: 带宽-硬盘读写速度-内存大小-cpu处理速度 二.软件 反向代理负载均衡 mysql : 1.优化你的sql和索引 2.加缓存,memcached,redis 3 ...
- 【转】1.2 CDN的基本工作过程
1.2 CDN的基本工作过程 使用CDN会极大地简化网站的系统维护工作量,网站维护人员只需将网站内容注入CDN的系统,通过CDN部署在各个物理位置的服务器进行全网分发,就可以实现跨运营商.跨地域的用 ...
- Drools实战系列(三)之eclipse创建工程
web工程和maven工程是目前比较常用的,当然对现在而言,maven工程是开发中最常用的. 两种Drools项目的创建方式,一种是直接创建Drools项目,另一种是基于Maven创建Drools项目 ...
- Invoking "cmake" failed报错处理
运行$ pip install -U rosdep rosinstall_generator wstool rosinstall six vcstools运行完成后再重新编译