
熔断监控面板(Hystrix Dashboard)
Hystrix Dashboard
Hystrix-dashboard是一款针对Hystrix进行实时监控的工具,通过Hystrix Dashboard我们可以在直观地看到各Hystrix Command的请求响应时间, 请求成功率等数据。
添加依赖
我们新建一个工程 spring-cloud-consul-monitor,修改 pom 文件,添加相关依赖。
pom.xml

    <dependencies>

        <dependency>

            <groupId>org.springframework.boot</groupId>

            <artifactId>spring-boot-starter-actuator</artifactId>

        </dependency>

        <dependency>

            <groupId>org.springframework.cloud</groupId>

            <artifactId>spring-cloud-starter-netflix-hystrix-dashboard</artifactId>

        </dependency>

    </dependencies>
启动类
在启动类中添加注解 @EnableHystrixDashboard 开启熔断监控支持。
ConsuleMonitorApplication.java
package com.louis.spring.cloud.consul.monitor;

import org.springframework.boot.SpringApplication;

import org.springframework.boot.autoconfigure.SpringBootApplication;

import org.springframework.cloud.netflix.hystrix.dashboard.EnableHystrixDashboard;

@EnableHystrixDashboard

@SpringBootApplication

public class ConsuleMonitorApplication {

    public static void main(String[] args) {

        SpringApplication.run(ConsuleMonitorApplication.class, args);

    }

}
修改配置
修改配置文件,配置启动端口和应用名称。
application.yml
server:

  port: 8531

spring:

  application:

    name: spring-cloud-consul-monitor
配置监控路径
注意,如果你使用的是2.x等比较新的版本,需要在 Hystrix 的消费端配置监控路径,我们这里消费端是 spring-cloud-consul-consumer, 所以修改它的启动类。
ConsuleConsumerApplication.java
    // 此配置是为了服务监控而配置,与服务容错本身无关,

    // ServletRegistrationBean因为springboot的默认路径不是"/hystrix.stream",

    // 只要在自己的项目里配置上下面的servlet就可以了

    @Bean

    public ServletRegistrationBean getServlet() {

        HystrixMetricsStreamServlet streamServlet = new HystrixMetricsStreamServlet();

        ServletRegistrationBean registrationBean = new ServletRegistrationBean(streamServlet);

        registrationBean.setLoadOnStartup(1);

        registrationBean.addUrlMappings("/hystrix.stream");

        registrationBean.setName("HystrixMetricsStreamServlet");

        return registrationBean;

    }
测试效果
先后启动 spring-cloud-consul-producer、 spring-cloud-consul-consumer、spring-cloud-consul-monitor 服务。
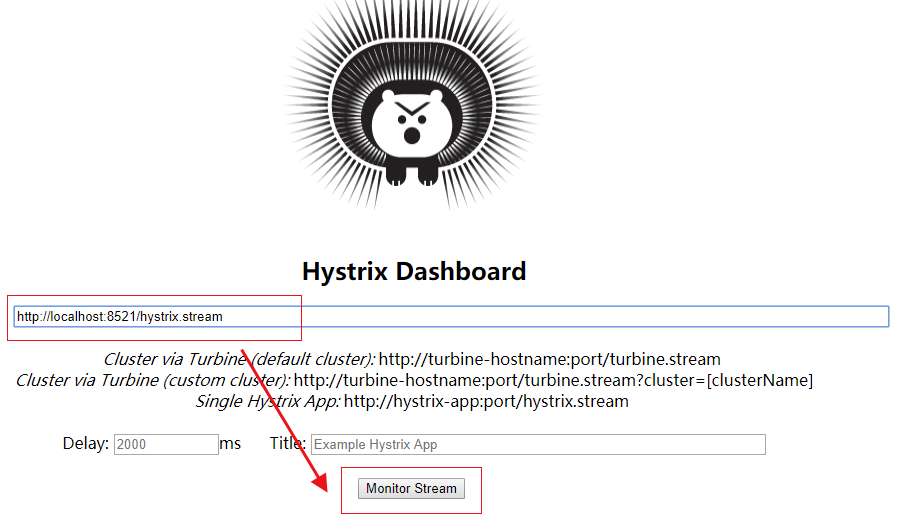
访问 http://localhost:8531/hystrix,会看到如下图所示界面。

此时没有任何具体的监控信息,需要输入要监控的消费者地址及监控信息的轮询时间和标题。
Hystrix Dashboard 共支持三种不同的监控方式:
单体Hystrix 消费者:通过URL http://hystrix-app:port/hystrix.stream 开启,实现对具体某个服务实例的监控。
默认集群监控:通过URL http://turbine-hostname:port/turbine.stream 开启,实现对默认集群的监控。
自定集群监控:通过URL http://turbine-hostname:port/turbine.stream?cluster=[clusterName] 开启,实现对clusterName集群的监控。
我们这里现在是对单体 Hystrix 消费者的监控,后面整合 Turbine 集群的时候再说明后两种的监控方式。
我们先访问 http://localhost:8521/feign/call, 查看要监控的服务是否可以正常访问。

确认服务可以正常访问之后,在监控地址内输入 http://localhost:8521/hystrix.stream,然后点击 Monitor Stream 开始监控。
刚进去,页面先显示 loading... 信息, 多次访问 http://localhost:8521/feign/call 之后,统计图表信息如下图所示。
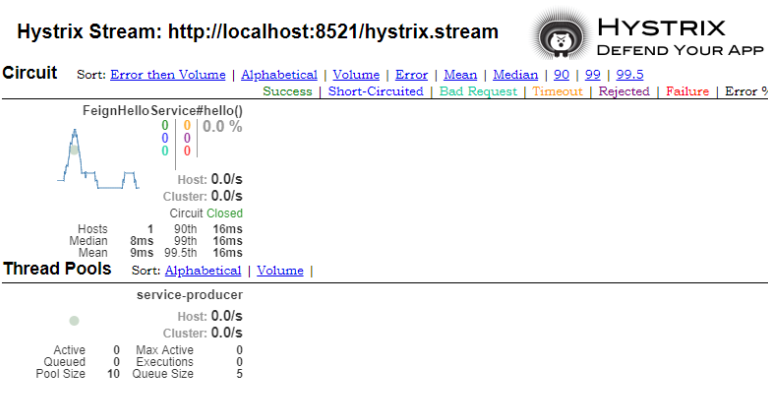
各个指标的含义参见下图。

熔断监控面板(Hystrix Dashboard)的更多相关文章
- spring cloud Hystrix监控面板Hystrix Dashboard和Turbine
我们提到断路器是根据一段时间窗内的请求情况来判断并操作断路器的打开和关闭状态的.而这些请求情况的指标信息都是HystrixCommand和HystrixObservableCommand实例在执行过程 ...
- SpringCloud断路器监控面板——Hystrix Dashboard
一.简介 Hystrix Dashboard是Hystrix的一个组件,Hystrix Dashboard提供一个断路器的监控面板,可以使我们更好的监控服务和集群的状态,仅仅使用Hystrix Das ...
- Spring Boot + Spring Cloud 构建微服务系统(五):熔断监控面板(Hystrix Dashboard)
Hystrix Dashboard Hystrix-dashboard是一款针对Hystrix进行实时监控的工具,通过Hystrix Dashboard我们可以在直观地看到各Hystrix Comma ...
- 006服务监控看板Hystrix Dashboard
1.POM配置 和普通Spring Boot工程相比,仅仅添加了Hystrix Dashboard和Spring Boot Starter Actuator依赖 <dependencies> ...
- 断路器监控(Hystrix Dashboard)
继上一篇http://www.cnblogs.com/EasonJim/p/7613595.html介绍了断路器之后,其实它还提供了一个管理页面来监控这些应用的调用数据. 首先,我是基于上一个例子Zo ...
- [Spring cloud 一步步实现广告系统] 19. 监控Hystrix Dashboard
在之前的18次文章中,我们实现了广告系统的广告投放,广告检索业务功能,中间使用到了 服务发现Eureka,服务调用Feign,网关路由Zuul以及错误熔断Hystrix等Spring Cloud组件. ...
- Spring Cloud学习笔记【五】Hystrix Dashboard监控面板
ystrix除了隔离依赖服务的调用以外,Hystrix 还提供了准实时的调用监控(Hystrix Dashboard),Hystrix 会持续地记录所有通过 Hystrix 发起的请求的执行信息,并以 ...
- spring cloud深入学习(六)-----熔断监控Hystrix Dashboard和Turbine
Hystrix-dashboard是一款针对Hystrix进行实时监控的工具,通过Hystrix Dashboard我们可以在直观地看到各Hystrix Command的请求响应时间, 请求成功率等数 ...
- 玩转Spring Cloud之熔断降级(Hystrix)与监控
本文内容导航目录: 前言:解释熔断降级一.搭建服务消费者项目,并集成 Hystrix环境 1.1.在POM XML中添加Hystrix依赖(spring-cloud-starter-netflix-h ...
随机推荐
- Nordic SDK例程目录结构
Nordic SDK例程目录结构为:SDK版本/ examples /协议角色/例子名称/开发板型号/协议栈型号/工具链类型/具体工程 Nordic每一个例子都支持5种工具链:Keil5/Keil4/ ...
- H5多媒体(用面向对象的方法控制视频、音频播放、暂停、延时暂停)
视频,音频播放器会是我们在工作中用到的一些h5新标签,它自带一些属性,比如暂停播放,快进快退,但是,我们经常不用原生的样式或者方法,我们需要自定义这些按钮来达到我们需要的样式,也需要我们自定义来实现一 ...
- Python全栈开发-Day2-Python基础2
本节内容 列表.元组操作 字符串操作 字典操作 集合操作 文件操作 字符编码与转码 1. 列表.元组操作 列表是我们最以后最常用的数据类型之一,通过列表可以对数据实现最方便的存储.修改等操作 定义列表 ...
- Java创建多线程和线程安全集合Vector
public class Test { public static Vector<String> data = new Vector<String>(); public sta ...
- MySql常用函数 --MySql
1.目标 MySQL数据库中提供了很丰富的函数.MySQL函数包括数学函数.字符串函数.日期和时间函数.条件判断函数.系统信息函数.加密函数.格式化函数等.通过这些函数,可以简化用户的操作.例如,字符 ...
- c++-pimer-plus-6th-chapter02
<C++ primer plus 英文版 第六版>娓娓道来.这个是上下分册.而且,出版时间是最新的2015年,买回来发现网上的勘误基本都被纠正过来了,极个别错误没有影响到理解,好哎!而且发 ...
- 从早期 Spring Boot 版本升级
如果你现在正在从早期的 Spring Boot 版本进行升级的话,请访问 “migration guide” on the project wiki 页面,这个页面提供了有关升级的详细指南.同时也请查 ...
- php字符串 统计个数
方法一 $arr=str_split($str); $arr=array_count_values($arr); /* * 方法二 * */ $arr = str_split($str); $a2 = ...
- python模块安装报错大全
报错 环境 解决 手动安装pip install mysqlclient 报错: _mysql.c(29) : fatal error C1083: Cannot open include file: ...
- python-django缓存
三 Django的缓存机制 1.1 缓存介绍 1.缓存的简介 在动态网站中,用户所有的请求,服务器都会去数据库中进行相应的增,删,查,改,渲染模板,执行业务逻辑,最后生成用户看到的页面. 当一个网站的 ...