docker-compose 快速部署Prometheus之服务端并监控ceph cluster 使用钉钉webhook 报警
现在环境是这样:
ceph 4台:
192.168.100.21 ceph-node1
192.168.100.22 ceph-node2
192.168.100.23 ceph-node3
192.168.100.25 ceph-node5
#已经部署好一个ceph cluster 集群 四个 osd 三个mon 没有使用块存储所有没有mod
监控服务端一台
192.168.100.26 Grafana 上面都是以容器部署了
Prometheus:
Grafana:
alertmanager:
prometheus-webhook-alert:
cAdvisor:
docker-compose 编排如下:
version: ""

networks:

    monitor:

        driver: bridge

services:

  prometheus:

    image: prom/prometheus

    container_name: prometheu

    hostname: prometheu

    restart: always

    volumes:

    - /Prometheus/config/prometheus.yml:/etc/prometheus/prometheus.yml

    - ./config/alertmanager-rule.yml:/etc/prometheus/alertmanager-rule.yml

    - /etc/localtime:/etc/localtime

    ports:

    - "9090:9090"

    networks:

    - monitor

  prometheus-webhook-alert:

    image: timonwong/prometheus-webhook-dingtalk:v0.3.0

    container_name: prometheus-webhook-alertmanagers

    hostname: webhook-alertmanagers

    restart: always

    volumes:

    - /etc/localtime:/etc/localtime

    ports:

    - "8060:8060"

    entrypoint: /bin/prometheus-webhook-dingtalk --ding.profile="webhook1=https://****#钉钉webhook自己去申请一个"

    networks:

    - monitor

  alertmanager:

    image: prom/alertmanager

    container_name: alertmanager

    hostname: alertmanager

    restart: always

    volumes:

      - ./config/alertmanager.yml:/etc/alertmanager/alertmanager.yml

      - /etc/localtime:/etc/localtime

    ports:

      - "9093:9093"

    networks:

      - monitor

  grafana:

    image: grafana/grafana

    container_name: grafana

    hostname: grafana

    restart: always

    volumes:

    - /etc/localtime:/etc/localtime

    - ./grafana-piechart:/var/lib/grafana/plugins/grafana-piechart-panel

    ports:

    - "3000:3000"

    networks:

    - monitor

  cadvisor:

    image: google/cadvisor:latest

    container_name: cadvisor

    hostname: cadvisor

    restart: always

    volumes:

    - /:/rootfs:ro

    - /var/run:/var/run:rw

    - /sys:/sys:ro

    - /var/lib/docker/:/var/lib/docker:ro

    - /etc/localtime:/etc/localtime

    ports:

    - "8080:8080"

    networks:

    - monitor
几处关键配置文件如下:
#普罗米修斯配置文件
cat ./config/prometheus.yml
# my global config

global:

  scrape_interval:     15s # Set the scrape interval to every  seconds. Default is every  minute.

  evaluation_interval: 15s # Evaluate rules every  seconds. The default is every  minute.

# Alertmanager configuration

alerting:

  alertmanagers:

  - static_configs:

    - targets: ["192.168.100.26:9093"]

# Load rules once and periodically evaluate them according to the global 'evaluation_interval'.

rule_files:

  - "alertmanager-rule.yml"

scrape_configs:

  # The job name is added as a label `job=<job_name>` to any timeseries scraped from this config.

  - job_name: 'prometheus'

    static_configs:

    - targets: ['192.168.100.26:9090']

  - job_name: 'cadvisor-1'

    static_configs:

    - targets: ['192.168.100.26:8080']

  - job_name: 'node-1'

    scrape_interval: 4s

    static_configs:

    - targets: ['192.168.100.26:9100']

  - job_name: 'cadvisor-2'

    static_configs:

    - targets: ['192.168.100.25:8080']

  - job_name: 'node-2'

    scrape_interval: 4s

    static_configs:

    - targets: ['192.168.100.25:9100']

  - job_name: 'ceph'

    scrape_interval: 4s

    static_configs:

    - targets: ['192.168.100.21:9128']
#监控报警组件 压制 合并 过滤配置文件 并配置webhook地址
cat ./config/alertmanager.yml
global:

  resolve_timeout: 5m

route:

  group_by: ['alertname']

  group_wait: 10s

  group_interval: 10s

  repeat_interval: 1h

  receiver: 'web.hook'

receivers:

- name: 'web.hook'

  webhook_configs:

  - url: 'http://192.168.100.26:8060/dingtalk/webhook1/send'

    send_resolved: true

inhibit_rules:

  - source_match:

      severity: 'critical'

    target_match:

      severity: 'warning'

    equal: ['alertname', 'dev', 'instance']
#监控报警规则配置文件
cat ./alertmanager-rule.yml
groups:
- name: ceph-rule
rules:
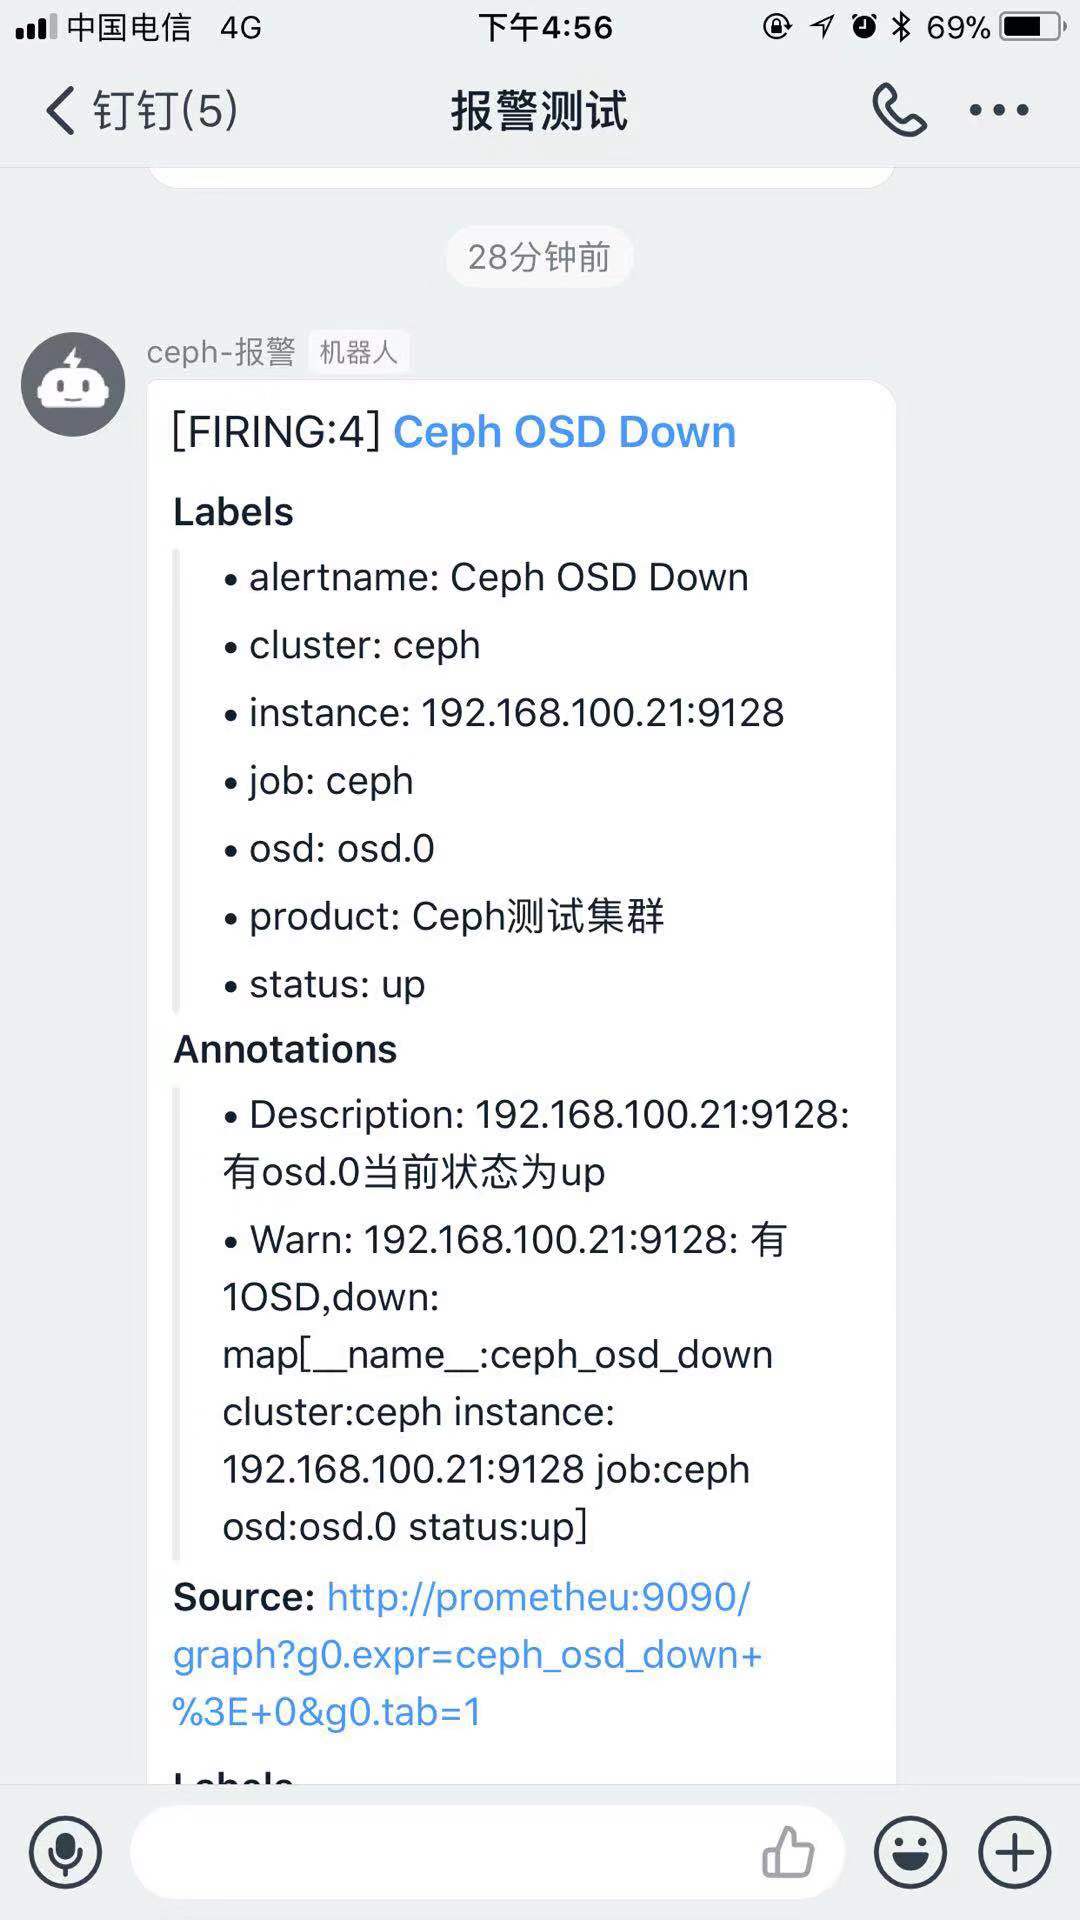
- alert: Ceph OSD Down
expr: ceph_osd_down >
for: 2m
labels:
product: Ceph测试集群
annotations:
Warn: "{{$labels.instance}}: 有{{ $value }}OSD,down: {{$labels}}"
Description: "{{$labels.instance}}:有{{ $labels.osd }}当前状态为{{ $labels.status }}" - alert: 集群空间使用率
expr: ceph_cluster_used_bytes / ceph_cluster_capacity_bytes * >
for: 2m
labels:
product: Ceph测试集群
annotations:
Warn: "{{$labels.instance}}:集群空间不足"
Description: "{{$labels.instance}}:当前空间使用率为{{ $value }}"
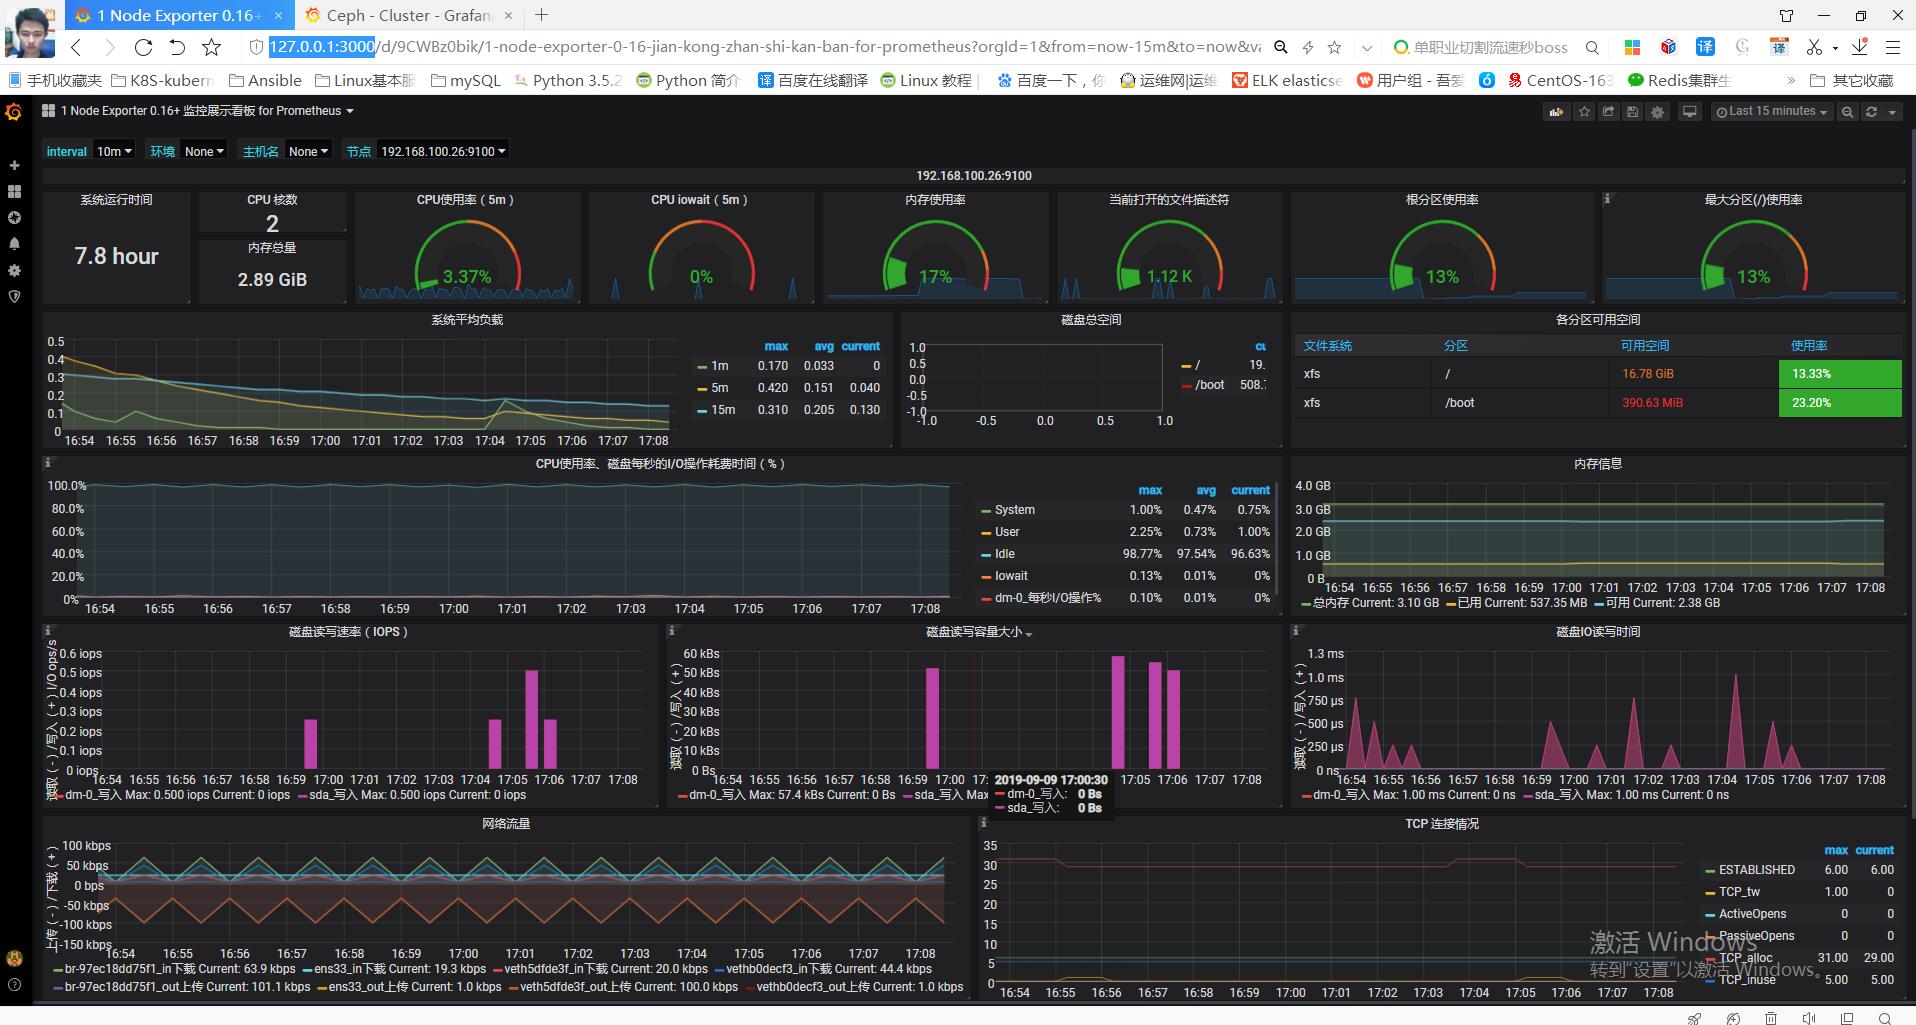
node-exporter: json模板下载 https://grafana.com/grafana/dashboards/10645
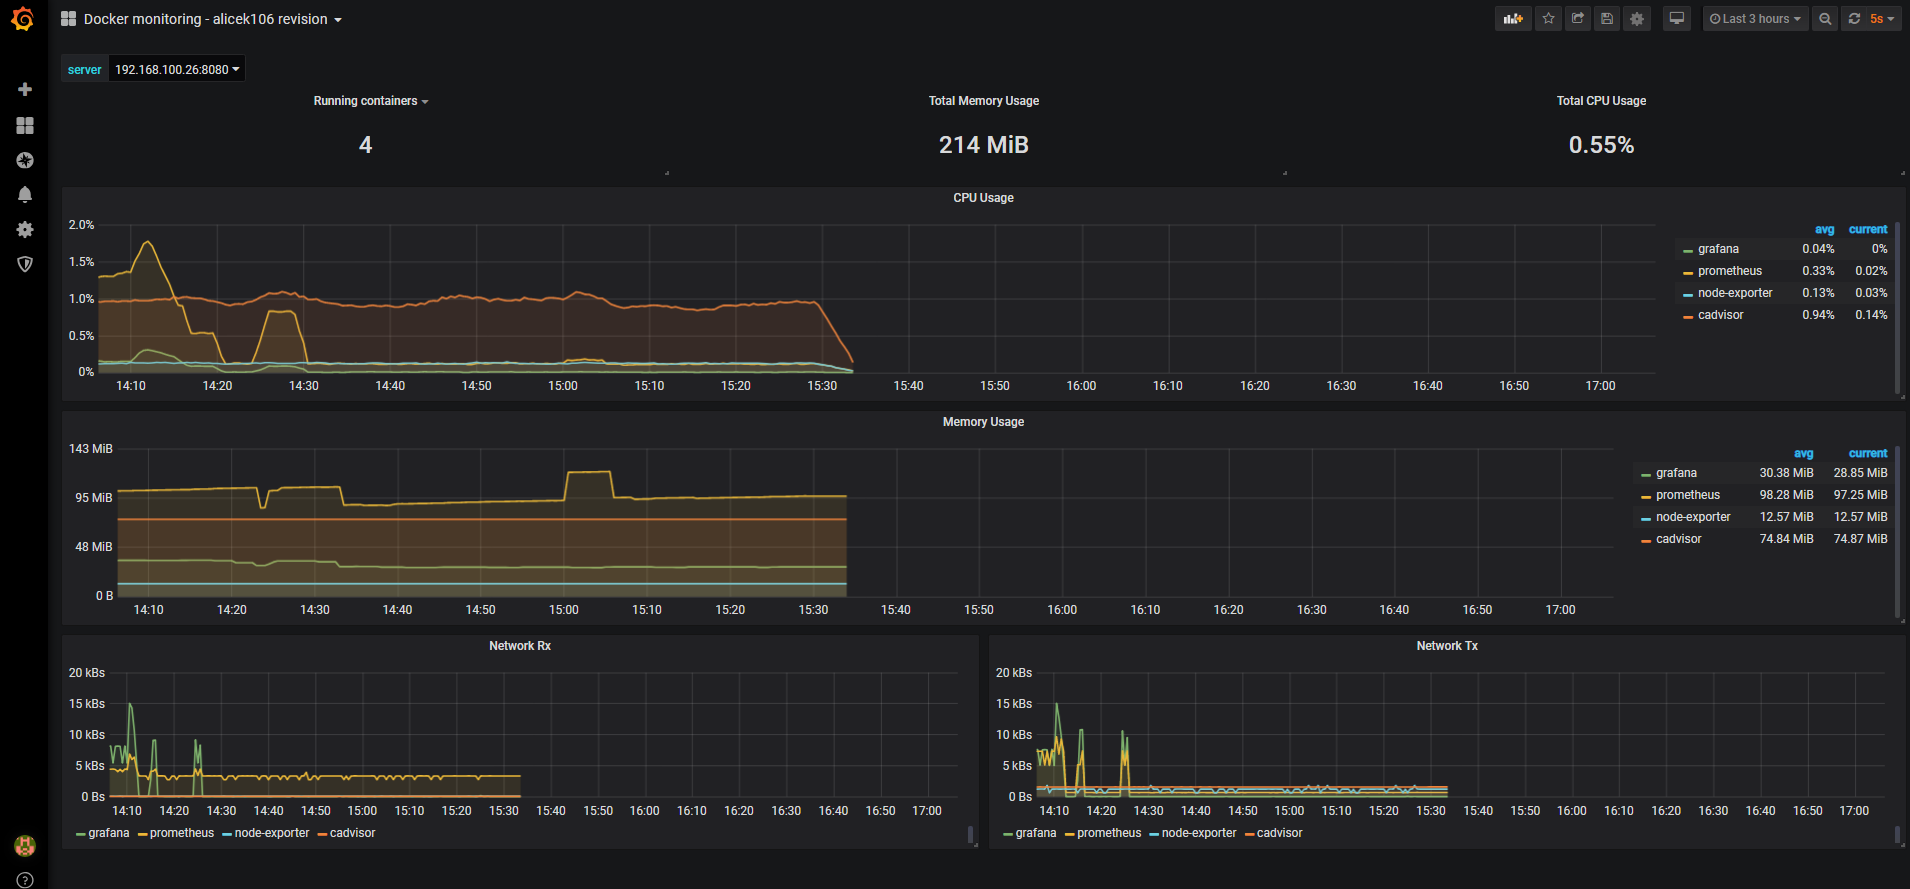
cadvisor: json模板下载: https://grafana.com/grafana/dashboards/3125
ceph cluster: json模板下载: https://grafana.com/grafana/dashboards/917%5D
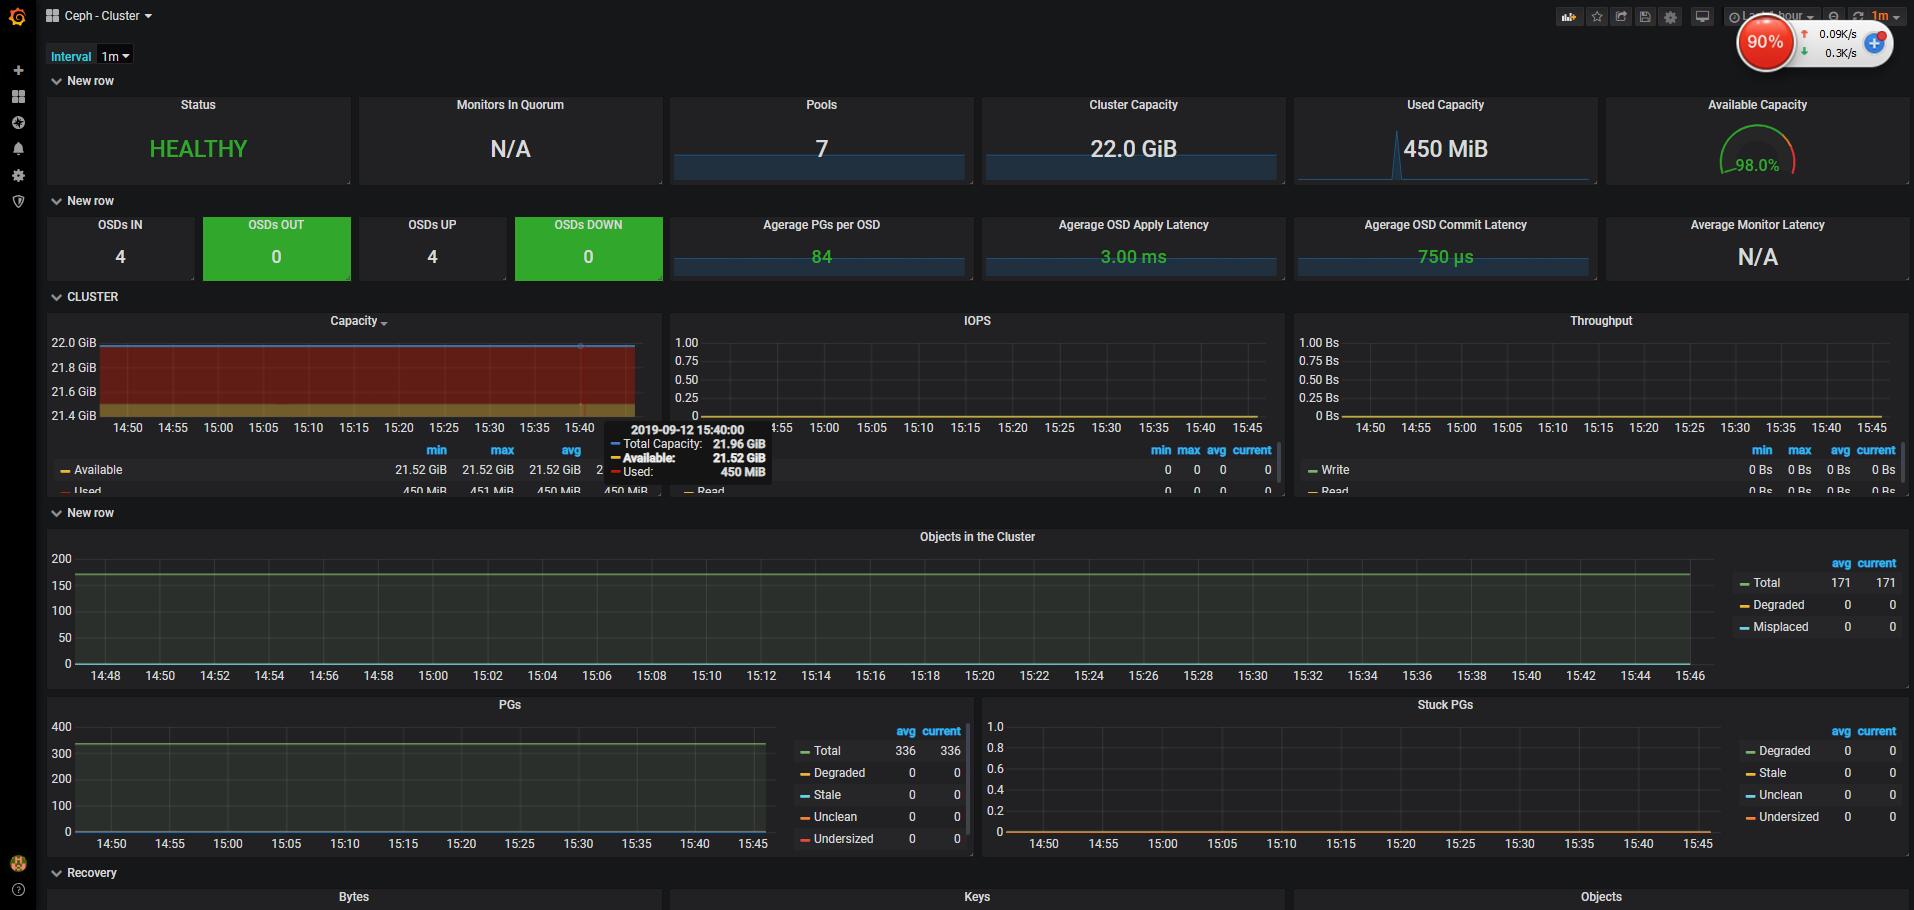
最后来一张完成 成果图
docker-compose 快速部署Prometheus之服务端并监控ceph cluster 使用钉钉webhook 报警的更多相关文章
- 使用 Docker Compose 快速构建 TiDB 集群
本文档介绍如何在单机上通过 Docker Compose 快速一键部署一套 TiDB 测试集群.Docker Compose 可以通过一个 YAML 文件定义多个容器的应用服务,然后一键启动或停止. ...
- 快速理解高性能HTTP服务端的负载均衡技术原理(转)
1.前言 在一个典型的高并发.大用户量的Web互联网系统的架构设计中,对HTTP集群的负载均衡设计是作为高性能系统优化环节中必不可少的方案.HTTP负载均衡的本质上是将Web用户流量进行均衡减压,因此 ...
- Docker Compose 一键部署LNMP
Docker Compose 一键部署LNMP 目录结构 [root@localhost ~]# tree compose_lnmp/ compose_lnmp/ ├── docker-compose ...
- Docker Compose 一键部署Nginx代理Tomcat集群
Docker Compose 一键部署Nginx代理Tomcat集群 目录结构 [root@localhost ~]# tree compose_nginx_tomcat/ compose_nginx ...
- Docker Compose 一键部署多节点爬虫程序
Docker Compose 一键部署多节点爬虫程序 目录结构 [root@localhost ~]# tree compose_crawler/ compose_crawler/ ├── cento ...
- 用Docker swarm快速部署Nebula Graph集群
用Docker swarm快速部署Nebula Graph集群 一.前言 本文介绍如何使用 Docker Swarm 来部署 Nebula Graph 集群. 二.nebula集群搭建 2.1 环境准 ...
- 通过 DynamicLinq 简单实现 N-Tier 部署下的服务端数据库通用分页
通过 DynamicLinq 简单实现 N-Tier 部署下的服务端数据库通用分页 YbSoftwareFactory 的 YbRapidSolution for WinForm 插件使用CSLA.N ...
- docker-compose 快速部署Prometheus,监控docker 容器, 宿主机,ceph -- cluster集群
话不多说上菜: 现在环境是这样: ceph 4台: 192.168.100.21 ceph-node1 192.168.100.22 ceph-node2 192.168.100.23 ceph ...
- 如何快速部署 Prometheus?- 每天5分钟玩转 Docker 容器技术(85)
上一节介绍了 Prometheus 的核心,多维数据模型.本节演示如何快速搭建 Prometheus 监控系统. 环境说明 我们将通过 Prometheus 监控两台 Docker Host:192. ...
随机推荐
- 在自定义的widget中引入图表后,运行时出现TypeError #1009错误
本人网上查找了很多资料,其中大部分都是关于Flash中的动画效果问题,与这里的问题关系型不太大.故把问题的解决方法写在这里,与人方便,与己方便. 方法一: 1.在自定义的widget中添加如下两个方法 ...
- 两个list 集合比较属性不同的值
for(Stall stall : stallList){ boolean flag = false; for(DeliveryStallCommission deliveryStallCommiss ...
- MSP430 CCS6.2无法启动仿真
前几天在淘宝买了个msp430的仿真器 因为熟悉eclipse的开发环境,所以选择用ccs6.2进行开发 拿到手的时候,仿真器的固件是v2版本的 对新版本的iar和ccs都不支持 随后我使用Lite ...
- JS获取光标在input 或 texterea 中下标位置
<textarea placeholder="请输入表达式" id="methodInput" ></textarea> 获取位置: v ...
- mybatis 无效字符
只想说 是真的坑啊!!!!!sql就是对 但就是报错无效字符..... 一.sql后有 “:”,我觉得这个应该坑了很多人了 二.标签后有类似于空格的东西(我也不知道是tab还是空格,反正删完就对了) ...
- 验证码校验(Ajax)
show.jsp <%@ page language="java" contentType="text/html; charset=utf-8" page ...
- ubuntu13.10设置永久静态IP重启不失效
步骤: 1.vi打开/etc/network/interfaces 2.手动添加static ip address 3.:wq保存退出 4.重启网络 service network-manager r ...
- C++常量表达式、const、constexpr(C++11新增)的区别
常量表达式是指值不会改变且在编译过程中就能够得到计算结果的表达式,能在编译时求值的表达式. 程序先编译再运行: 在编译阶段, 编译器将在编译过程中把用到该常量的地方都全都替换为 常量的值. 但是常量 ...
- Java 常用转换
日期转换 SimpleDateFormat ft = new SimpleDateFormat("yyyy-MM-dd HH:mm:ss"); Date date = ft.par ...
- 第2节 Scala中面向对象编程:9、getClass和classOf;10、调用父类的constructor;11、抽象类和抽象字段;
6.3.4. Scala中getClass 和 classOf Class A extends class B B b=new A b.getClass ==classOf[A] B b ...